Fast High-Throughput Chemical and Physical Characterization of Stationary Phases by NIRS
LCGC Europe
A non-invasive near-infrared spectroscopy method to characterize a wide range of stationary phases.
A simple, highly-precise non-invasive near-infrared spectroscopy (NIRS) method to characterize a wide range of stationary phases is described. This new approach produces results in a few seconds and offers significant advantages over conventional approaches.
The design of novel stationary phases — with enhanced selectivity, specificity and speed — is a constant challenge in chromatographic and electrophoretic separation science. Therefore, next to the calculation of chromatographic parameters, the characterization of chemical and physical properties of stationary phases is essential. Conventionally, column performance is checked by a test run which only allows users to prove efficiency column by column. Chemical parameters, including surface coverage, are normally analysed by burning combustion or frontal analysis. Physical parameters, including pore size, pore volume, surface area and particle size, are usually analysed by scanning electron microscopy (SEM), mercury intrusion porosimetry (MIP) and Brunauer Emmett Teller (BET). All these methods are extremely time consuming, invasive and require special equipment and specially trained lab staff.

To achieve fast high-throughput control of the chemical and physical parameters of stationary phases we introduced near-infrared spectroscopy (NIRS, 4000–10000 cm–1 ) as a non-invasive, easy-to-handle technology that achieves simultaneous analysis within only a few seconds at higher precision than traditional methods. This new approach is applicable to porous/non-porous materials, silica gel, polymer beads, carbon-based nanomaterials (e.g., fullerenes), monoliths for solid-phase extraction (SPE), liquid chromatography (LC) micro-liquid chromatography (µ-LC) materials and substances used for material enhanced laser desorption ionization (MELDI) and coated capillaries for capillary electrophoresis (CE) and capillary electrochromatography (CEC).
The established NIRS technique not only enables identification of the crude carrier material but also the ability to control the success of any derivatization procedure — including reversed- phase, normal phase, ion exchanger, immobilized affinity chromatography (IMAC), affinity chromatography and endcapping methods — by applying principal component analysis (PCA) to the spectra recorded.
Partial least square regression (PLSR) enables the determination of physical parameters, including porosity, total porosity, pore size, pore volume, particle size and surface area, with one single measurement in an established quantitative model. For a detailed investigation, NIRS imaging, which benefits from the combination of a NIR spectrometer with a microscope, allows the analysis of materials of interest with a lateral resolution down to 4 µm.
For the optimized design of polymeric phases, real-time in situ monitoring to control the polymerization progress can be extremely helpful. In this article, the advantages of this novel NIRS-based method for the fast high-throughput quality control of stationary phases is described.
Near Infrared Spectroscopy (NIRS)
In the late 1940s, near infrared spectroscopy (NIRS) became important in commercial applications in various industrial fields for analytical characterization and material analysis.1 The method became more popular in the eighties because of the availability of stand-alone NIR instruments offering enhanced reproducibility, new instrument accessories and statistical software. Improvements were made in imaging systems, light-fibre optics, optimized detectors and sample desk probes, alongside progress in miniaturization and the use of chemometrics to correlate the spectral data with physical and chemical properties of the sample.2 In- and on-line methods could be developed to perform kinetic studies and to control and monitor automated processes, including chemical3 and polymer applications.4 NIRS spectroscopy is considered superior to mid-IR (MIR) for industrial applications because in the 4000–10000 cm–1 range overtone and combination vibrations appear that are less intense than fundamental vibrations in mid-IR. This allows the use of much larger sample thicknesses. In the field of chemical and polymer research, NIR is mainly applied to control the polymerization and chemical processes of products with defined patterns and characteristics.5 Parameters such as porosity, anisotropy, composition, crystallinity, surface area, molecular weight, particle diameter, monomer content, intra-molecular interactions, etc., are investigated by characteristic absorptions, reflections and scattering effects in the NIR region.
Silica gel derivatized with alkyl chains of different lengths (C4–C30) is the most frequently applied phase for thin layer chromatography (TLC), SPE and all kinds of LC in different disciplines, including proteomics, metabolomics and phytomics.6–8
Nanomaterials based on carbon not only offer an excellent starting material for further derivatization but also offer a high ratio of surface to size and an enhanced capacity as a result. MELDI is a technique where human serum samples are incubated onto chemically (the type of derivatization) and physically (particle size, porosity, surface size) well-defined carrier materials. Following an optimized washing step, nonbound peptides are eluted and the remaining incubated material is put under investigation using matrix assisted laser desporption/ionization time-of-flight mass spectrometry (MALDI–TOF-MS). The resulting mass spectrum is used as a fingerprint to distinguish between different forms and/or stages of any illness, for example, prostate or breast cancer, using bioinformatics.
In many cases polymeric materials are helpful in SPE11–13 but they have also attracted attention as a starting material in immobilized affinity chromatographic (IMAC)-based proteomics (MELDI) as well as as a reactor for enzymatic digestion.14
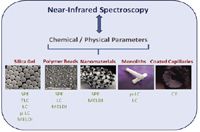
Figure 1: Investigated stationary phases and their application.
Monolithic capillary columns synthesized by copolymerizing bis(vinylphenylethane) and methylstyrene have been shown to be highly suitable for the separation of even low- (phenolic compounds, flavonoids) and high-molecular-weight analytes (peptides, proteins, oligonucleotides) by µ-LC.15,16 An overview of the different kinds of synthesized, stationary phases investigated in our laboratory and their application is provided in Figure 1.
In the following section the benefits of NIRS for the fast high-throughput characterization of chemical and physical parameters is discussed.
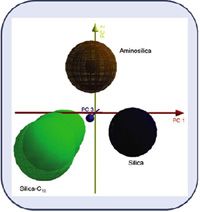
Figure 2: PCR model for the classification of silica and different kinds of derivatization.
Silica Materials
Silica is the main material used in all chromatographic-based separations17 and NIRS is an important technique to investigate its properties. A qualitative model based on principal component regression (PCR) allows clustering of materials with differences in particle size and/or surface area, pore structure and derivatization in a threedimensional factor plot. The basis for differentiation is found in corresponding overtone and combination stretching and deformation vibrations of C–H, N–H and O–H groups in the near-IR region (spectra not shown). As a selected example the cluster depicted in Figure 2 allows the classification of pure silica, silica-C18 and aminosilica.18 The sensitivity to differentiate between different particle size at consistent porosity and the sensitivity to differentiate between different porosity at consistent particle size was verified successfully in a detailed study described in reference 19. NIRS in combination with principal component analysis (PCA) was introduced to control success of endcapping procedures.20
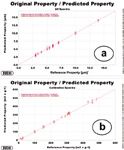
Figure 3: Predicted (NIRS) versus reference property for the determination of: (a) particle diameter; (b) specific surface area.
A quantitative approach enables the determination of surface coverage20 as well as particle size, pore structure and specific surface area and simultaneously.18,19 Particle size is routinely determined by electron microscopy, light scattering or the Coulter-Counter (CC) method. Recording 230 spectra of 23 different silica and silica-based phases allowed the establishment of a partial least square (PLS) model with higher precision compared with conventional applied methods. The CC method shows relative standard deviation of +15% to –12% and the novel NIR method is only 8.6%. The same is valid for the determination of surface area: BET analysis results in RSD% of ± 7.8% and NIRS of < 6.8%. Description of pore structure includes the determination of pore diameter and volume, which are routinely determined by size exclusion chromatography. Figure 3 shows the linear NIRS-based regression models for the quantitative determination of particle size and surface area. An impression upon the high efficiency of the novel NIRS- based method for the quantitative analysis of the parameters surface coverage, particle size, surface area and pore volume can be gathered from Table 1 which provides data for 18 selected silica phases.
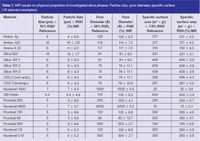
Table 1: NIR results on physical properties of investigated silica phases: Particle size, pore diameter, specific surface (18 selected examples).
Carbon-based Nanomaterials: C60-fullerenes
The suitability of NIRS as a derivatization control tool of modified nanomaterials was checked for C60fullerene samples. C60-fullerenes were oxidized to the corresponding epoxyfullerene and further covalently attached to amino-derivatized silica. The material proved to be highly efficient in desalting cell lysate samples and for the highly selective SPE of low-molecular weight plant ingredients.9,10 Each sample was scanned ten times in a wavenumber range from 4000–10000 cm–1 — the final spectra is presented as an average. Figure 4 shows the final recorded NIR spectrum including an assignment of the most relevant vibrations identified.
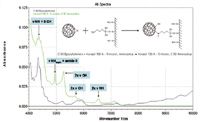
Figure 4: NIR spectrum of C60-fullerene covalently attached to amino-silica for SPE.
Polymer Beads: Poly(glycidyl methacrylate-co-divinylbenzene)
The potential to monitor on-line polymerization between glycidyl methacrylate (GMA) and divinylbenzene (DVB) by NIRS in diffuse reflection mode was successfully verified. In the first step, band assignment of glycidyl methacrylate, divinylbenzene and its copolymerized form will act as the basis for all further investigations. In this case, the most abundant vibration could be assigned to the C–H- and C=O-stretching vibrations at 4368 and 4524 cm–1 and a stretching vibration at 5244 cm–1 originating from GMA, followed by a C–H stretching vibration at 8748 cm–1 from DVB. In the following steps these vibrations were used to establish a qualitative cluster plot for the control of the monomer to crosslinker ratio in the resulting polymeric bead. In a quantitative model the monitoring of the on-line polymerization control was accomplished by measuring the signal intensities of the vibrations discussed above using light fibre optics outside of the reaction flask (Figure 5). Starting the reaction after 40 min, it took a further 140 min until the DVB core was formed. Addition of GMA after 180 min caused an immediate formation of poly(glycidyl methacrylate-co-divinylbenzene) particles, with increasing weight starting to sag to the ground of the reaction flask. After this, yield is increased and dispersion of particles from the ground caused an increased absorption. This model can also be used for the on-line measurement of other parameters including, for example, particle size and surface area (data not shown). The well characterized material is successfully applied in our laboratory for MELDI as well as a reactor for enzymatic digestion.13,14
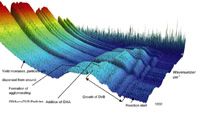
Figure 5: On-line monitored control of glycidyl methacrylate divinylbenzene copolymerisation.
Monoliths Copolymerized from Methylstyrene and Bis(vinylphenyl)ethane
Imaging spectroscopy with a resolution down to 4 µm can be successfully applied for the quality control (QC) of poly[methylstyrene-co-bis(vinylphenyl)ethane] monoliths in capillaries with an inner diameter of 200 µm.15,16 In our laboratory this technique was installed to control the ratio between monomer and crosslinker, which appeared to be extremely useful because the measurement is performed non-invasively and the same monolithic capillary can be used for LC separations. Recording spectra (average of 10 scans) in reflection mode over a wavenumber range from 4000–10000 cm–1 of 1 = 39%, 2 = 40%, 3 = 41%, 4 = 42%, 5 = 35%, 6 = 43%, 7 = 38%, 8 = 36%, 9 = 37% monomer + crosslinker amount allows us to also calculate the ratio in a quantitative model. Simultaneosuly, the ratio of macro-, meso- and micro-pores can be determined by using mercury intrusion porosimetry (MIP) as a reference method (Figure 6) for the establishment of the highly selective model.21

Figure 6: Resulting pore volume and pore area distributions by gradually increasing the MS/BVPE content.
Latex and Fullerenol-coated Capillaries
Quality control of latex and fullerenol coated capillaries (inner diameter < 75 µm, thickness of coating < 0.1 µm) can be achieved by NIR imaging combined with multivariate data analysis in a similar approach as described in the previous chapter. Coating of the capillaries' inner wall is helpful in preventing irreversible protein adsorption during electrophoretic separation process.22 The interpretation of the resultant model gives information about the homogeneity of the applied chemical coating. Figure 7 shows a two dimensional factor plot for the differentiation between bare fused silica, latex and fullerenol derivatized. The corresponding image is depicted in the small insert.
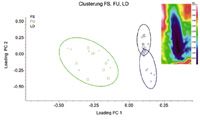
Figure 7: Two-dimensional factor plot for the identification of bare fuesed silica (FS), fullerenol (FU) and latex derivatized (LD) silica. The small insert shows the original recorded image.
Conclusions
The suitability of NIRS to simultaneously control chemical and physical properties of stationary phases including monoliths, silica particles, polymeric beads, coated capillaries and C60fullerene bound silica, was described. As measurement is extremely fast, this method has the potential for use in high-throughput control and should help to ensure quality.
Acknowledgements
The authors want to thank the Leopold-Franzens University, Innsbruck, Austria for financial support (Young Scientist Award 2007).
Christian Huck is associate professor at the Institute of Analytical Chemistry and Radiochemistry, University Innsbruck, Austria. The institute is headed by Professor Dr. Günther Bonn and has extensive experience in the design of novel stationary phases. In 1997, Christian Huck established a research group focusing on infraredspectroscopy (IR), which merges these two disciplines in a synergistic manner. The group has produced nine patents and more than 120 scientific contributions have been published in the fields of chromatography and/or spectroscopy, respectively.
References
1. J.W. Ellis and J. Bath, J. Am. Chem. Soc., 62, 2859–2861 (1940).
2. M. Blanco et al., Anal. Chim. Acta, 434, 133–141 (2001).
3. M.A. Liauw, B. Oderkerk and D. Treu, Chem. Engin., 113, 56–60 (2006).
4. M. Watari et al., Appl. Spectrosc., 58, 248–255 (2004).
5. I. Altig et al., Macromol. Symp., 230, 51–58 (2005).
6. I. Feuerstein et al., Proteomics, 5, 46–54 (2005).
7. G. Stecher et al., TRAC, 1, 1–14, (2003).
8. R. Pirker, C.W. Huck and G.K. Bonn, J. Chromatogr. B, 777, 147–153 (2002).
9. R.M. Vallant et al., Anal. Chem., 79, 8144–8153 (2007).
10. R.M. Vallant et al., J. Proteom. Res., 6(1), 44–53 (2007).
11. C.W. Huck and G.K. Bonn, J. Chromatogr. A, 885, 51–72 (2000).
12. M. Sultan et al., Current Med. Chem., 12, 763–771 (2005).
13. N.H. Aprilita et al., J. Proteom. Res., 4(6), 2312–2319 (2005).
14. H. Hahn et al., J. Proteom. Res., 2009, in press
15. T. Jakschitz et al., J. Chromatogr. A, 1147, 53–58 (2007).
16. L. Trojer et al., J. Chromatogr. A, 1146(2), 216–224 (2007).
17. Z. Szabo et al., J. Sep. Sci., 28, 313–324 (2005).
18. C.W. Huck et al., J. Near Infrared Spectrosc., 14, 51–57 (2006).
19. C.W. Huck et al., Open Anal. Chem. J., 1, 21–27 (2007).
20. N. Heigl et al., Vibr. Spectrosc., 49, 155–161 (2009).
21. N. Heigl et al., Anal. Chem., 80(22), 8493–8500 (2008).
22. C.W. Huck, R. Bakry and G.K. Bonn, Electrophoresis, 27, 111–125 (2006).

Determining Enhanced Sensitivity to Odors due to Anxiety-Associated Chemosignals with GC
May 8th 2025Based on their hypothesis that smelling anxiety chemosignals can, like visual anxiety induction, lead to an increase in odor sensitivity, a joint study between the University of Erlangen-Nuremberg (Erlangen, Germany) and the Fraunhofer Institute for Process Engineering and Packaging (Freising, Germany) combined behavioral experiments, odor profile analysis by a trained panel, and instrumental analysis of odorants (gas chromatography-olfactometry) and volatiles (gas chromatography-mass spectrometry).
Investigating 3D-Printable Stationary Phases in Liquid Chromatography
May 7th 20253D printing technology has potential in chromatography, but a major challenge is developing materials with both high porosity and robust mechanical properties. Recently, scientists compared the separation performances of eight different 3D printable stationary phases.
Detecting Hyper-Fast Chromatographic Peaks Using Ion Mobility Spectrometry
May 6th 2025Ion mobility spectrometers can detect trace compounds quickly, though they can face various issues with detecting certain peaks. University of Hannover scientists created a new system for resolving hyper-fast gas chromatography (GC) peaks.

.png&w=3840&q=75)

.png&w=3840&q=75)


.png&w=3840&q=75)


.png&w=3840&q=75)


