Determination of Chlorophenols and their Degradation Metabolites in Environmental Samples by SPME and on-fibre Silylation with GC–MS
A method based on SPME and GC–MS was developed to analyse chlorophenols and their metabolites in aqueous samples.
A simple, rapid and sensitive method based on solid-phase microextraction (SPME) and gas chromatography–mass spectroscopy (GC–MS) was developed to determine five chlorophenols and their two major metabolites in aqueous samples. To improve the peak shape, silylation was performed on the SPME fibre to get less polar forms, which are more favourable for GC–MS analysis. All parameters influencing SPME–GC–MS performance, including pH, salinity, extraction time, derivatization time, as well as desorption time, were carefully optimized. The method was successfully applied to the analysis of chlorophenols and their metabolites, excluding tetrachlorohydroquinone in pond water with recovery percentages ranging from 80.4% to 91.4%.
Chlorophenols (CPs), are known to contaminate the environment, and are highly toxic, poorly biodegradable and potentially carcinogenic.1,2 Within the list of 11 phenolic compounds considered as major pollutants, drawn up by the US Environmental Protection Agency (EPA), CPs are among the most toxic and carcinogenic.3 They are produced commercially for use as preservative agents, pesticides, antiseptics, disinfectants and are also used as intermediates in many industries including the pharmaceutical industry.4 In addition, some chlorophenols, especially 2-chlorophenol (2-CP), 2,4-dichlorophenol (2,4-DCP) and 2,4,6-trichlorophenol (2,4,6-TCP), could be produced when water is disinfected with chlorine, resulting in unpleasant and persistent organoleptic properties in the disinfected water.5,6
CPs enter the environment either directly from industrial waste or indirectly as important metabolites of some other chlorinated pesticides, such as PCBs.7 As well as CPs, their two major metabolites, dichlorohydroquinone and tetrachlorohydroquinone, also show high toxicities. They were reported to be more toxic because they could cause DNA damage by breaking a single strand of DNA chain.8,9 This makes the simultaneous determination of CPs and their metabolites very important when accessing their environmental risks. However, until now, most publications have put the emphasis on the analysis of one specific CP, or a group of CPs, but have ignored their metabolites.
Different techniques have been used to determine chlorophenols. Most of them used chromatographic-based instrumentation such as gas chromatography (GC)4,10–20 and high performance liquid chromatography (HPLC), particularly reversed-phase liquid chromatography (RPLC)21–31 in combination with ultraviolet detection (UV),22–25 fluorescence (F) detection,26,27 electrochemical (EC) detection28 or mass spectrometry (MS).13–20,29,30 Apart from when coupled with fluorescence or an MS detector, HPLC coupled with other detection methods suffers from interference from matrix compounds such as humic substances naturally occurring in environmental samples. GC is therefore preferable because of its high resolution, high sensitivity and selectivity when coupled with a versatile, selective detector such as an electron-capture detector (ECD), atomic emission detector (AED) or mass spectrometer11–20 During the GC separation process, peaks obtained from free chlorophenols show strong tailings. In this case, derivatization methods were suggested to get less polar forms, which could improve the peak shape.12,14,16 Silylation is the technique of choice because phenolic functional groups can be readily derivatized, and the reaction mixture can be directly injected into the GC without further sample pretreatment. This technique, however, requires prior separation of the analytes from the sample to avoid quenching of the silylating agent by the large amount of water or ethanol present in the matrix. Therefore, two of the major drawbacks of these technologies are laborious sample pretreatment and poor recoveries because of the volatile nature of the derivatives.
Due to the low concentration levels of CPs and the complicated matrices of environmental samples, different preconcentration methods have been used prior to the analysis. Liquid-liquid extraction (LLE)29 and solid-phase extraction (SPE)11,12,23,24,30 have been widely used. However, these traditional methods have the well-known disadvantages of being solvent- and sample consuming, time- and labour consuming and also have the risk of analyte losses. Therefore, liquid phase microextraction (LPME),13,15,16,22,25 solid phase microextraction (SPME)19–21 and head-space solid phase microextraction (HS-SPME)10 have been proposed as alternative methods to avoid the use of large volumes of sample and organic solvent. However, the precision of LPME suffers from the instability of the droplet when using single droplet LPME as a sample preparation method. Recently, research concerning the determination of chlorophenols by SPME has focused on the evaluation of new fibre coatings.10,19,20 These research projects have broadened the range of SPME applications. However, the new fibre coatings are not commercially available and are instable from fibre to fibre, which is the main problem to be solved.
The aim of this paper is to develop a simple, rapid and sensitive method for the determination of chlorophenols, as well as their degradation metabolites, in aqueous samples. To achieve this, SPME in combination with GC–MS was used. In addition, the silylation method was used to improve the peak shape. This is different from the traditional silylation procedure. The silylation in this paper was carried out on the SPME fibre based on head-space concept (i.e., the fibre was inserted into the headspace of silylating agent), after the extraction of chlorophenols from aqueous matrix. On-fibre silylation has the advantages of SPME but also makes up for the drawbacks of traditional silylation because the analytes have been separated by the fibre from the matrix.31–33
The small volume of water remaining on the fibre can react with the excess vapour of the silylating agent, whereas the silylating agent would be quenched by the large amount of water or ethanol present in the matrix during the traditional silylation procedure. Moreover, the derivatives generated on-fibre could be introduced directly and immediately into GC, which avoids the losses of analytes.
Experimental
SPME Equipment: The SPME manual fibre holder was from Supelco Inc. (Bellefonte, Pennsylvania, USA). Due to the polar property of CPs and their metabolites, polyacrylate (PA) fibre (Supelco) with 85 µm thickness was used for their extraction. The SPME fibres were conditioned under helium for 1–2 h in hot GC injection port before extraction. The SPME sampling stand and the heat/stir plate used in extraction were also from Supelco. The magnetic stirring bars (10 × 3 mm) were from Aldrich (St Louis, Missouri, USA).
Reagents: The standards of 2,6-dichlorophenol (2,6-DCP, 99%), 2,4,6-trichlorophenol (2,4,6-TCP, 98%), 2,5-dichlorohydroquinone (2,5-DiCH, 98%), tetrachlorohydroquinone (TeCH, 99%) and Bis(trimethylsilyl)trifluoroacetamide (BSTFA) were purchased from Acros Organics (Geel, Belgium), whereas pentachlorophenol (PCP, 98%), 2,3,4,5-Tetrachlorophenol (2,3,4,5-TeCP, 10 ng/µL) and 2,3,4,6-tetrachlorophenol (2,3,4,6-TeCP, 10 ng/µL) were from Sigma-Aldrich (St Louis, Missouri, USA).
The individual stock standard solution of 1 g/L 2,6-DCP, 2,4,6-TCP, 2,5-DiCH, TeCH and PCP were prepared by dissolving 0.0250 g of each standard in acetonitrile in a 25 mL volumetric flask. The 10 mg/L stock mix-standard of the above five compounds were prepared by adding 0.1 mL of each stock standard in a 10 mL volumetric flask and diluted with acetonitrile. The solutions were protected from light at 4 °C. The series of working standard solutions were freshly prepared by diluting proper volume of stock mix-standard solution, 2,3,4,5-TeCP and 2,3,4,6-TeCP with acidified Milli-Q water (pH 3). Three millilitres of each working standard was put into 4 mL sample vials, and then sealed with hole-caps and Teflon-faced silicone septa (both purchased from Supelco). The derivatizing reagent was also prepared by adding 100 µL BSTFA into the 4 mL sample vial, and then sealed with hole-caps and Teflon-faced silicone septa. All chemicals and reagents used in this study were analytical grade.
Analytical Procedure: The sampling was performed by immersing a SPME fibre directly into the 3 mL standard solution or sample for 60 min at ambient temperature under magnetic stirring for the adsorption of analytes onto the fibre coating. After extraction, the fibre was then inserted into the headspace of BSTFA. The analytes on the fibre were derivatized for 5 min to ensure the completion of silylation. The GC programme started as soon as the fibre was immediately inserted into the GC injector. Desorption time was set for 3 min with the temperature 270 °C.
Instrumentation and Operating Conditions: A Hewlett-Packard (Palo Alto, California, USA) 6890 gas chromatograph equipped with 5973 mass spectrometer and the MS Chemstation with Window Operational System (1701AA series) software was used for analysis. A 30 m × 0.25 mm i.d. × 0.25 µm HP-5MS fused-silica capillary column, coated with 5% biphenyl and 95% dimethylpolysiloxane (from HP Inc.) was used The column temperature programme was set as follows: 100 °C held for 1 min; 15 °C/min to 160 °C; 5 °C/min to 300 °C; held for 7 min. The total run time of the programme was 40 min. The GC injector port was used in the 'splitless' mode and held isothermally at 270 °C for SPME injections for the duration of the run. Helium was used as the carrier gas, at a flow rate of 1 mL/min by using electronic pressure control. The GC–MS interface temperature was maintained at 280 °C. The MS was operated in the electron impact (EI) ionization mode with electron energy of 70 eV, and mass-to-charge ratio (m/z) scan ranged from 50 to 550 amu to determine appropriate masses for selected ion monitoring (SIM). The MS ion source and mass filter (quad) temperatures were held at 230 °C and 150 °C, respectively.
Results and Discussion
Development of SPME-Silylation Procedure and GC–MS Analysis: In this study, the post-derivatization with silylation was performed on the fibre of SPME following extraction by using BSTFA gaseous phase. Generally, the silylation combined with SPME is difficult because the silylmethylated reagents and silylmethylated derivatives will hydrolyse in aqueous solutions. To overcome this problem, a method based on the silylation in the BSTFA gaseous phase after SPME was proposed. In this method, the fibre after extraction was then pierced immediately into the Teflon-faced silicone septa on the headspace of BSTFA, in which the adsorbed chlorophenols were derivatized with BSTFA.
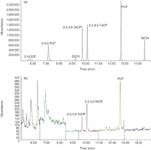
Figure 1: (a) TIC chromatogram of silylmethylated derivatives in mix-standard solution; (b) SIM chromatogram of silylmethylated derivatives in pond water [extracting individual quantification ions for each derivative].
Because CPs and their metabolites are polar compounds, commercially available polar SPME fibre coating, namely 85 µm polyacrylate fibre, was used for extraction. As CPs and their metabolites showed weak acidic properties, we primarily adjusted the pH value of standard solutions to 3 in order to get neutral forms of the target compounds for better extraction by SPME fibre. Figure 1(a) shows the chromatogram of derivatives (10 µg/L) obtained after SPME extraction and BSTFA silylation. All compounds were well separated under the above temperature programme. To increase the sensitivity, MS was used to quantitatively analyse CPs and their metabolites by selected ion monitoring (SIM) mode. The molecular weight, retention time, molecular ion and qualifier ions for each derivative are listed in Table 1. To minimize the baseline shifting after a derivatizing reagent peak, the signal was turned off as soon as the reagent appeared and turned on again after the reagent eluted.

Table 1: Molecular weight of parent compounds, retention time, molecular ion and qualifier ions of the derivatives of the analysed compounds.
Effect of Desorption Time: The optimum desorption time was studied by varying desorption time of polyacrylate fibre in the GC injector at 270 °C with 10 µg/L mix-standard solution (pH 3). The results showed that the desorbed amount of derivatives of target compounds on the fibre increased at 3 min. The carryover test was run to measure the amount of derivatives retained on the fibre after 3 min exposure. The fibre was placed back to the GC injector (270 °C) for another period of 3 min. None of the derivatives were found during the carryover test, which indicated that 3 min desorption was completed for target derivatives. Thus, 3 min was chosen for the subsequent experiments.
Effect of Derivatization Time: In derivatization, the silylation efficiency of target compounds after SPME was determined by the reaction time of BSTFA. In this work, the effect of reaction time on the silylation was studied by varying the exposure time to BSTFA from 1 min to 60 min at room temperature. According to the results shown in Figure 2, the efficiency of silylation for most selected compounds reached the maximum at 5 min, afterwards, the responses decreased with the increase of reaction time. The reason might be that long derivatization time could promote the release and the degradation of the derivatized chemicals from the fibre. Because the derivatized analytes were more volatile than their mother compounds. Long derivatization time might cause their release from fibre, thus influence the final results. Moreover, the silylated analytes might get desilylation when the derivatization time was too long. Thus, the optimum derivatization time was finally selected to be 5 min.
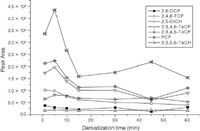
Figure 2: Effect of derivatization time on peak areas of silylmethylated derivatives by SPMEâGCâMS.
Effect of Extraction Time: The standard solution of target compounds (10 µg/L, pH 3) was used to investigate the optimum conditions for SPME procedure. The equilibrium time for SPME depends on the rate of mass transfer in the aqueous phase. The optimum extraction time was determined by varying the extraction time from 20 min to 90 min. All the extractions were carried out at room temperature and a constant rapid stirring was used to increase the rate of mass transfer in aqueous phase. As shown in Figure 3, the amount of most target compounds extracted, except PCP, increased with the increase of extraction time, and was in equilibrium at about 60 min. Based on the consideration of shorter pretreatment time, the optimum extraction time was set at 60 min.
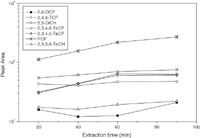
Figure 3: Effect of extraction time on peak areas of silylmethylated derivatives by SPMEâGCâMS.
Effect of pH: Generally, to increase the extraction efficiency in sample solution, favourable conditions for forming neutral forms of target compounds should be selected. Since selected compounds show weak acidic property, pH values of 3.0 and 7.0 were investigated. During the extraction procedure, extraction was kept at room temperature for 60 min and derivatized for 5 min, with 3 min desorption followed. Figure 4 illustrates the responses of the pH optimization. The results indicated that a higher sorption capacity was obtained at pH 3.0 than at pH 7.0. Thus, pH 3.0 was chosen as final experimental condition in this work.
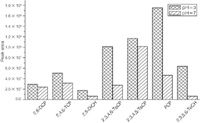
Figure 4: Effect of pH on peak area of silylmethylated derivatives by SPMEâGCâMS.
Effects of Salinities: The salt content in the sample solution affects hydration of ionizable compounds, changes their solubility in aqueous phase and thus affects the extraction efficiency by the fibre. The salinities of the sample solution were studied by adding different amounts of NaCl into the sample solution. Three concentrations of NaCl, 0%, 15% and 30%, were selected for salinities study. Figure 5 shows the effects of salinities on the response of the target compounds. During this procedure, adsorption was kept at room temperature for 60 min with sample pH at 3.0, and the derivatization time was 5 min. It was observed that, for 2,6-DCP and DiCH, the responses increased with the increase of ion strength, while for the rest of the compounds, responses reached the maximum when the concentration of NaCl was 15%. The possible reason for this phenomenon where extraction efficiency initially increased with the increase of salt content and then decreased with the further increase could be a "salt-out" effect and a reverse "salt-in" effect. Normally, salt content influences the extraction efficiency by this so-called ''salt-out effect''; salt would decrease the solubility of target compound in aqueous phase and thus increase the partition coefficient between fibre coating and aqueous phase. However, in some cases, the solubility of the compounds might not change and the addition of salt may decrease the amount extracted by decreasing the activity coefficients of the analytes.34 Considering the overall responses of the target compounds, a concentration level of 15% NaCl was selected.
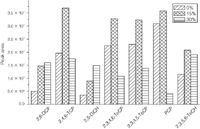
Figure 5: Effect of salinities on peak area of silylmethylated derivatives by SPMEâGCâMS.
Calibration Curve, Precision and Detection Limit: The SPME and post-silylation procedures were performed according to the optimized conditions. The electron impact (EI) ionization and selected ion monitoring (SIM) mode were used to determine the detection limit of selected compounds in aqueous solution. The concentrations of working solutions were selected to be 0.01, 0.1, 1 and 10 µg/ L respectively. The limits of detection (LOD) and the limit of quantification (LOQ) of selected compounds were calculated based on the 3σ and 10σ criteria, respectively. The precision was determined by performing three replicates from the aqueous solution, containing 1.0 µg/L of target compounds. The results are shown in Table 2. The linear ranges of target compounds by SPME procedure spanned over three orders of magnitude, with correlation coefficients ranging from 0.9963 to 0.9999. The relative standard deviation (RSD) of target compounds ranged from 3.9% to 10.4%, showing good reproducibility for all target compounds. The LOD and the LOQ of target compounds ranged from 2.3 × 10⁻⁴ to 2.8 × 10⁻³ µg/L and 7.6 × 10⁻³ to 9.3 × 10⁻³ µg/L respectively.

Table 2: Linearity, detection and quantification limits of target compounds in pure water obtained by SPMEâGCâMS.
Determination of CPs and their Metabolites in Pond Water: Pond water was selected as a real sample for evaluation of the developed method. Under the optimized conditions, the concentrations of seven selected compounds determined by SPME are shown in Table 3 and the SIM chromatogram is shown in Figure 1(b). Only three compounds, 2,3,4,5-TeCP, 2,3,4,6-TeCP and PCP, were detected by the developed method. To further evaluate the influence of matrix on direct determination of CPs and their metabolites by this method, the recovery test was performed by adding 1.0 µg/L mix-standards of selected compounds into pond water. Recoveries of most compounds were satisfying, ranging from 80.4% to 91.4%, except 2,3,5,6-TeCH (Table 3). Based on the fact that 2,3,5,6-TeCH has similar structure with 2,5-DiCH, the matrix would effect the extraction of 2,3,5,6-TeCH in the same way with 2,5-DiCH. The possible reason for bad recovery of 2,3,5,6-TeCH might be that some soluble enzymes produced by some microorganism in pond water made the dechloronation of 2,3,5,6-TeCH very fast.35 In this case, standard-addition should be applied to get the accurate concentration for 2,3,5,6-TeCH.

Table 3: Determination of pondwater by SPME and GCâMS.
Conclusions
A rapid and simple method for the determination of five CPs and their two major metabolites in an aqueous sample has been developed using gaseous phase on-fibre silylation following SPME. It is sensitive and selective. An 85 µm of polyacrylate-coated fibre could be used to have the limit of detection (LOD) and the limit of quantification (LOQ) of target compounds range from 2.3 ×10⁻⁴ to 2.8 × 10⁻³ µg/L and 7.6 × 10⁻³ to 9.3 × 10⁻³ µg/L respectively. This method has been shown to exhibit adequate precision and linearity. The method has been used to analyse CPs and their metabolites in pond water. The recoveries were satisfactory except for 2,3,5,6-TeCH.
Acknowledgements
Financial support from the National Natural Science Foundation of China (NSFC, No. 20977116 and 40601090), Natural Scientific Foundation of Guangdong Province (No. 9151027501000114) and Program for New Century Excellent Talents in University are gratefully acknowledged.
Hongtao Liu is associate professor at the Hygiene Detection Centre, School of Public Health and Tropical Medicine, Southern Medical University, Guangzhou, China.
Li Lin is associate professor, School of Life Sciences, Sun Yatsen University, Guangzhou, China.
Shichun Zou is associate professor at the School of Marine Sciences, Sun Yat-sen University, Guangzhou, China.
Lihua Yang is a lecturer at the School of Marine Sciences, Sun Yat-sen University, Guangzhou, China.
Yuanyuan Zhang is a bachelor of science student at the School of Life Sciences, Sun Yat-sen University, Guangzhou, China.
Tiangang Luan is a professor at the School of Life Sciences, School of Marine Sciences, Sun Yat-sen University, Guangzhou, China.
References
1. D. Perez-Bendito and S. Rubio, Environmental Analytical Chemistry, Comprehensive Analytical Chemistry, vol. XXXII, Elsevier, Amsterdam, 1999, pp.537.
2. R.A. Torres et al., Chemosphere, 50 , 97–104 (2003).
3. EPA method 625, phenols, in Federal Register, October 26, 1984. Environmental Protection Agency, part VIII, 40 CFR part 136, 1981, p.58.
4. M. Lee et al., J. Chromatogr. A. 806, 317–324 (1998).
5. K.L. Simpson and K.P. Hayes, Water Res., 32 (5), 1522–1528 (1998).
6. N. Campillo et al., Anal. Chim. Acta, 223, 182–189 (2005).
7. M. Jin and W. Yang, Anal. Chim. Acta, 566, 193–199 (2006).
8. Y.J. Wang et al., Chem. Biol. Interact., 128, 173–188 (2000).
9. J. Jiang et al., Chin. Sci. Bull., 49, 562–566 (2004).
10. W. Du, F.Q. Zhao and B.Z. Zeng, J. Chromatogr. A, 1216, 3751–3757 (2009).
11. L. Wennrich, P. Popp and M. Moder, Anal. Chem., 72, 546–551 (2000).
12. I. Rodriguez et al., J. Chromatogr. A, 721, 297–304 (1996).
13. L.W. Chung and M.R. Lee, TALANTA, 76 (1), 154–160 (2008).
14. A. Kovacs et al., J. Chromatogr. A, 1194, 139–142 (2008).
15. R. Ito et al., J. Chromatogr., B, 872, 63–67 (2008).
16. X. Wang et al., J. Chromatogr. A, 1216, 6267–6273 (2009).
17. J.A. Padilla-Sanchez, J. Chromatogr. A, 1217, 5724–5731 (2010).
18. J. Lopez-Darias et al., J. Chromatogr. A, 1217, 1236–1243 (2010).
19. H. Bagheri, A. Mir and E. Babanezhad, Anal. Chim. Acta, 532, 89–95 (2005).
20. M.P. LIompart et al., J. Chromatogr. A, 963, 137–148 (2002).
21. C. Mahugo Santana et al., J. Chromatogr. A,1140, 13–20 (2007).
22. Y.L. Wu, B. Hu and Y.L. Hou, J. Sep. Sci., 31, 3772–3781 (2008).
23. J.D. Li et al., J. Chromatogr. A, 1180, 24–31 (2008).
24. Q.Z. Feng et al., J. Hazard. Mater.,167, 282–288 (2009).
25. C.L. Ye et al., J. Sep. Sci., 30, 42–47 (2007).
26. F.E.O. Suliman et al., J. Chromatogr. A, 1101, 179–184 (2006).
27. Y. Higashi and Y. Fujii, J. Liq. Chromatogr. Related Technol., 32, 2372–2383 (2009).
28. M.N. Sarrion, F.J. Santos and M.T. Galceran, J. Chromatogr. A, 947, 155–165 (2002).
29. D. Puig et al., Anal. Chem., 69, 2756–2761 (1997).
30. P. Lopez-Roldan et al., Anal. Bioanal. Chem., 378, 599–609 (2004).
31. X.L. Li et al., Chinese J. Anal. Chem., 34, 325–328 (2006).
32. L.H. Yang, T.G. Luan and C.Y. Lan, J. Chromatogr. A, 1104, 23–32 (2006).
33. L.H. Yang et al., Anal. Bioanal. Chem., 386, 391–397 (2006).
34. J. Pawliszyn (ed.), Handbook of Solid Phase Microextraction, Chemical Industrial Press, Beijing, 2009.
35. M.M. Häggblom, D.Janke and M.S. Salkinoja-Salonen, Appl Environ Microbiol., 55, 516–519 (1989).

Characterizing Plant Polysaccharides Using Size-Exclusion Chromatography
April 4th 2025With green chemistry becoming more standardized, Leena Pitkänen of Aalto University analyzed how useful size-exclusion chromatography (SEC) and asymmetric flow field-flow fractionation (AF4) could be in characterizing plant polysaccharides.


