Extracting Information from Chromatographic Herbal Fingerprints
LCGC Europe
Herbs and their extracts are currently being used for preventive and therapeutic goals. Consequently, the identification and quality control of these natural products is becoming increasingly important. Fingerprint chromatography is accepted as an appropriate identification and quality evaluation technique for medicinal herbs. This article reviews the development procedure of a fingerprint and different ways to handle the fingerprint data.
Natural products have served mankind as a source of medicine since — and even before — historical records began. Herbal extracts now play an important and growing role in disease prevention and therapy, and are used extensively as drugs and food additives.
Compared with synthetic chemical drug compounds, the composition of herbal extracts is far more complex. Consequently, their quality control is becoming an increasingly important issue. For example, by the European legislation (directive 2004/24/EC concerning "traditional herbal medicinal products") a more strict control on the quality and purity of these products is required. This is also the case by the State Drug Administration of China. It involves, for example, the creation of a type of monograph as a guideline to test the identity and quality.
Identity and quality can be derived from fingerprint chromatograms. These fingerprints can be defined as "a chromatographic pattern of an herbal extract showing some common pharmacologically active and/or chemical characteristic compounds". An example is shown in Figure 1. The entire fingerprints are used as a source of information because by assaying only a number of compounds from the extract, the total intrinsic quality of the herb is not necessarily assessed.
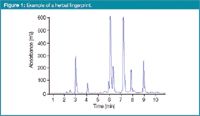
Figure 1
Another reason for stricter quality control is to assess if other herbs/extracts are used than those expected. This can be a result of conscious adulterations where another plant is sold, to the unconscious mistaken use of "look-alikes".
Confusion can also occur due to language. For example, when translating from Chinese pin-yin terminology into western languages or when the same name is used in different regions for different parts of the plant, or even different species or genera.
An example of such a language confusion resulting in the mistaken use of a herb occurred in the beginning of the 1990s in Belgium. Stephania tetrandra, which is used in a herbal treatment against obesity, was exchanged with Aristolochia fangchi, a herb resulting in a severe nephropathy because of the presence of aristolochic acid. Confusion probably occurred because of the similarity in the pin-yin terminology of both plants: Feng Fangji vs. Guang Fangji, respectively.
The fingerprint chromatograms are also accepted by the World Health Organization (WHO) as an identification and qualification technique for medicinal herbs. There are two main phases of a fingerprint approach:
- The development of the fingerprint.
- The extraction of information.
Analysis and handling of the fingerprint data is, therefore, an important aspect.
Fingerprint Development
The main separation technique used in fingerprint development is high-performance liquid chromatography (HPLC) coupled to ultraviolet (UV), electric light scattering (ELS) and, occasionally, mass spectrometry (MS) detection. For fingerprint development, spectroscopic techniques, such as near infra-red (NIR), Raman, nuclear magnetic resonance spectroscopy (NMR), and other separation techniques, including thin layer chromatography (TLC) and capillary electrophoresis (CE) can also be used.
Method Development of Fingerprints
There are two vital steps when developing fingerprints:
- Preparation of the herbal extracts.
- Determining analytical HPLC conditions.
For both steps both sequential and experimental design based approaches are described.1–3
Preparation herbal extracts: Firstly, the optimal extraction conditions should be chosen, for example, the alcohol concentration or presence of other organic solvents in the extraction solvent. Extracts could also be prepared according to standardized extraction procedures that are traditionally used to prepare the extract used as herbal medicine.
Determining HPLC conditions: A screening approach to find the best organic modifier (composition) for a Liquorice extract is shown in Figure 2. After selecting the best modifier and its gradient, the fingerprint can be further optimized in a sequential approach.3 The goal of the fingerprint development is to maximize the peak capacity for a given extract. Different criteria to evaluate the global separation quality could be applied in this context, but basically one prefers to detect a maximal number of peaks within the length of a fingerprint.
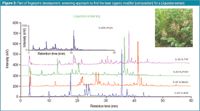
Figure 2
HPLC often consumes considerable amounts of organic solvents during analysis and there is a trend towards developing "green" fingerprints that use less solvent or simply water. Water can be used by working at elevated temperatures and using less solvent is achieved by using micro-separation techniques, such as pressurized capillary elecrochromatography (pCEC), capillary electrochromatography (CEC) and capillary liquid chromatography (CLC).
Data Handling
The fingerprints are so-called one-way data sets (i.e., a vector) and are mathematically equivalent to a spectrum, for example, an NIR spectrum. This means that all data treatment performed with spectra can also be applied on the fingerprints. Techniques such as exploratory data analysis, pattern recognition and multivariate calibration techniques can be used, depending on the goal. These different types of data handling will be described in more detail.
Data Pretreatment
It will often be necessary to pretreat the chromatographic data. Chromatographic fingerprints are subject to a number of experimental errors, which should be corrected before further data analysis. When, for example, replicate fingerprints are measured one will observe variations in the retention times for a given peak. This can be caused by experimental errors but also by the continuous column ageing process.
The chemometric techniques applied in the next section, usually include matrix computations and will only perform optimally when the retention time of a given substance is the same in the different fingerprints. Therefore, a correction will be performed to align corresponding peaks.
The techniques used for this purpose are called warping techniques, and some examples are correlation optimized warping, dynamic time warping, (semi-) parametric time warping and target peak alignment.4 The principle of peak alignment and the results on a series of fingerprints is demonstrated in Figure 3.
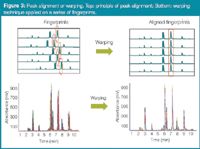
Figure 3
Extraction of Relevant Information
The information of interest can be very different. First of all, the fingerprints can be used for identification purposes, for example, in a "monograph" analysis. The fingerprint of a sample is then compared with a reference standard extract. Comparison can be done via the correlation coefficient between both or by calculating a so-called "similarity score".
A second objective can be to classify or cluster phyto-therapeutic samples to their geographic origin, or to distinguish between different species. A third objective could be to relate the fingerprints to a quantitative quality parameter of the samples, usually an activity. The quality parameter is then modelled as a function of the chromatographic data. Examples of parameters that can be modelled are (i) the antioxidant capacity and (ii) the biological activities of samples, such as their antibacterial activity or the anti-cancer activity against a set of cancer cell lines (cytotoxic activity). In these situations the activity will be modelled as a function of the fingerprint to be able to predict later the activity from a new fingerprint.
For the extraction of relevant information related to the second and third objectives, multivariate chemometric techniques will be applied. Two situations can be distinguished. Either one aims to classify or cluster the samples (according to their identity, origin, etc.), or one tries to model a quality or sample property as a function of information present in the fingerprints. In the first type of situation, a so-called exploratory data analysis will be made to visualize the data structure and to examine whether samples can be discriminated or clustered.
Initially a principal component analysis (PCA) will be performed.5,6 In Figure 4 an example of a PC1–PC2 score plot is shown for the fingerprints of a number of Mallotus species. Figure 5 shows that species occurring in clusters have similar fingerprints.
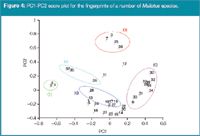
Figure 4
Other exploratory data analysis techniques, which possibly discriminate differently between potential clusters include projection pursuit, multiple factor analysis and robust PCA. Before now, in fingerprint analysis they are not or only rarely applied. Pattern recognition techniques7 could be applied to define borders around different classes, for example, geographic origin classes, activity classes to determine which class a certain future sample belongs. Also these techniques were, until now, rarely applied in the herbal fingerprint analysis.
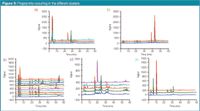
Figure 5
In the situations where a quantitative value, such as antioxidant or biological activity of the sample is modelled, multivariate calibration techniques will be applied.7 Partial least squares regression (PLS), uninformative variable elimination partial least squares regression (UVE–PLS), principal component regression (PCR) and stepwise multivariate linear regression (MLR), among many other techniques, can be used for this purpose.8
Figure 6 shows the principle of multivariate calibration to model the antioxidant capacity of green tea samples as a function of the fingerprints. The goal of the modelling is to have a model that is able to predict the antioxidant capacity of new samples from their fingerprints (i.e., where it is not required to measure the activity by means of a reference technique anymore). With each technique models of different complexity can be built. For example, containing different numbers of PCs in PCR or containing different numbers of variables in MLR.
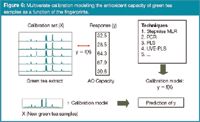
Figure 6
The model that is finally selected is the one that has the best compromise between model complexity and the predictive properties of the model.
A more complex model will include more variables and will fit the calibration set better. However, from a given complexity on the model also starts modelling the experimental error occurring in the calibration set, i.e., not only the response y.
The predictive properties of the model therefore improve with increasing complexity till the model starts overfitting. From that moment the predictive properties become worse. The best model is, therefore, the simplest model that has good predictive properties and is not overfitting. Often, for a given problem, models are built with different techniques and the predictive properties of the best models are compared to finally decide on a technique and model.
In fingerprints of herbal extracts where one looks for potentially interesting medicinal components, regions (peaks) could be localized which are contributing to the observed activity by looking at the so-called regression coefficients of a multivariate model. These coefficients indicate the importance of an original variable in relation to the modelled activity. This is illustrated in Figure 7 where some Mallotus fingerprints are plotted as well as the regression coefficients (black trace) from a multivariate calibration technique modelling the antioxidant activity. The more negative coefficients in this example correlate with the activity.
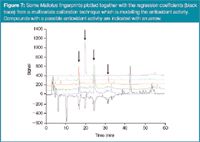
Figure 7
The peaks originating from compounds with a possible antioxidant activity are determined from these coefficients and are indicated with an arrow. These compounds clearly have highly negative regression coefficients (Figure 7). This selection should then allow a faster and easier identification of the components of interest using further MS analyses.
Conclusions
A herbal fingerprint can be developed for three main reasons: identification, classification or calibration. Identification confirms that a sample is originating from the herb expected and not from another source, to attain better quality control of the herbs.
Classification or clustering can be performed to classify samples according to, for example, their origin. A multivariate calibration can be performed when the herb or its extract can also be characterized by an activity, such as an antioxidant or cytotoxic activity. The activity can then be modelled as a function of the complete chromatogram. The goal of the modelling can be either to build models that can predict the activity for future samples based on the chromatogram, for example, the antioxidant activity from green tea, or to identify the main compounds/peaks responsible for a given activity.
Yvan Vander Heyden is a professor at the Vrije Universiteit Brussel, Belgium, department of analytical chemistry and pharmaceutical technology, and heads a research group on chemometrics and separation science.
References
1. Y.B. Ji et al., Journal of Chromatography A, 1066, 97–104 (2005)
2. Y.B. Ji et al., Journal of Chromatography A, 1128, 273–281 (2006)
3. G. Alaerts et al., Journal of Chromatography A, 1172, 1–8 (2007)
4. A.M. van Nederkassel et al., Journal of Chromatography A, 1118, 199–210 (2006).
5. D.L. Massart and Y. Vander Heyden, LCGC Eur., 17(11) 586–591 (2004).
6. D.L. Massart and Y. Vander Heyden, LCGC Eur., 1(2), 84–89 (2005).
7. D.L. Massart and Y. Vander Heyden, LCGC Eur., 17(9) 467–470 (2004).
8. M. Dumarey et al., Journal of Chromatography A, 1192, 81–88 (2008)

Silvia Radenkovic on Building Connections in the Scientific Community
April 11th 2025In the second part of our conversation with Silvia Radenkovic, she shares insights into her involvement in scientific organizations and offers advice for young scientists looking to engage more in scientific organizations.
Regulatory Deadlines and Supply Chain Challenges Take Center Stage in Nitrosamine Discussion
April 10th 2025During an LCGC International peer exchange, Aloka Srinivasan, Mayank Bhanti, and Amber Burch discussed the regulatory deadlines and supply chain challenges that come with nitrosamine analysis.
Removing Double-Stranded RNA Impurities Using Chromatography
April 8th 2025Researchers from Agency for Science, Technology and Research in Singapore recently published a review article exploring how chromatography can be used to remove double-stranded RNA impurities during mRNA therapeutics production.


