The Application of Capillary Electrophoresis for Vaccine Release and Characterization
LCGC Europe
Capillary electrophoresis (CE) is increasingly being used in vaccine analysis. Applications include vaccine quantification, purity assessment, process monitoring, characterization and nucleic acid analysis. CE has been used because it offers advantages over other techniques. Vaccine manufacturers such as Sanofi-Aventis, Merck and Wyeth are actively investigating the use of CE for vaccine analysis. While CE can be considered a mature technique, its application to vaccine release and characterization has been limited. It is difficult to ascertain if its use is expanding because there are still a small amount of publications, but given the inherent advantages of CE and the need for better analytical techniques in vaccine analysis, the application must be growing. This article illustrates some of the uses of CE in vaccine analysis.
What makes a vaccine? How are they different from therapeutic proteins?
A wide variety of antigens can be used as vaccine therapeutics. The first vaccines used the weakened live or killed microorganisms. As time progressed, protection could be acquired by using parts of a microorganism such as proteins or polysaccharides. A variety of technologies are used for preparing vaccines, including conjugation of polysaccharide or peptides to a carrier protein, recombinant expression and recombinant vectors. A protein vaccine (or the protein portion of a vaccine) is fundamentally the same as a protein therapeutic, from an analytical perspective.
Why use CE for vaccine analysis?
The use of CE for vaccine analysis is increasing based on the number of articles being published and scientific talks being given. Interested readers are referred to a more comprehensive review of this topic.1
CE is an established technique for the analysis of biotherapeutics2–3 as its advantages (speed, reduced complexity of operation and improved reproducibility/automation) have supported the effective replacing of sodium dodecyl sulphate polyacrylamide gel electrophoresis (SDS-PAGE) analyses as well as isoelectric focusing (IEF) gels.
CE has been used to replace a variety of techniques for vaccine analysis. The traditional methods employed in vaccine analysis include colorimetric assays for concentration determination, SDS-PAGE and high performance liquid chromatography (HPLC) for purity and impurity analysis and IEF for isoelectric point (pI) determination. The methods suffer from many problems including precision (analyst-to-analyst and assay-to-assay issues being significant), poor resolution and limited accuracy and linearity. CE offers advantages in terms of cost, precision (many of the analyst-to-analyst and assay-to-assay variance components are minimized), linearity and ease-of-use. For the analyst, CE offers a greater degree of automation, less "babysitting" and easier method development/validation.
What are the issues associated with the use of CE for vaccine analysis?
In the early years, CE suffered from some precision issues, which limited its uptake. With the advent of modern instrumentation (e.g., efficient temperature control) and methodologies (e.g., use of migration time standards), many of the precision issues have disappeared. Vaccine analytical chemistry requires the combination of a variety of disciplines including molecular biology, biochemistry, immunology and virology along with traditional analytical chemistry. The seemingly slower acceptance of the technology in vaccines may have some origin in the diversity of the scientists working on vaccines.
Which companies are using CE for vaccine analysis?
There are obvious problems of confidentially regarding pharmaceutical companies publishing their data so the reports understate the extent of usage. However, papers and presentations at scientific conferences show that the usage is widespread and includes vaccine manufacturers such as Sanofi-Aventis, Merck and Wyeth.
Are companies routinely using CE and including CE data in regulatory submissions?
Again there are obvious problems of confidentiality, regarding pharmaceutical companies publishing their data, so the exact details are unknown. However, it is know that biopharmaceutical companies are submitting CE methods, so it is reasonable to surmise the same is happening in vaccine submissions.
Is standard CE equipment used for vaccine analysis?
Yes! The CE instrument used for vaccine analysis is identical to the CE instrument used for any other biopharmaceutical analysis. No special modifications are needed.
Can CE be used for vaccine lot release applications?
There are several published examples of using CE for lot release applications. The quantification of Meningococcal polysaccharide serotypes A, C, W135 and Y was described by Lamb et al.4 The polysaccharides are unbranched homopolymers (A and C) or heteropolymers (W135 and Y). Serotype A is a homopolymer of mannosamine phosphate, serotype C is a homopolymer of sialic acid, serotype W135 has alternating sialic acid and galactose subunits and serotype Y has alternating sialic acid and glucose subunits. A colorimetric assay (either phosphorous quantification for serotype A or sialic acid quantification for serotypes C, W135 and Y) is used to quantify the polysaccharides.
These colorimetric methods can be variable (RSDs over 10%) including high analyst-to-analyst variability, are time consuming and require acid hydrolysis of the polysaccharide at high temperature. In addition, it is impossible to use the colorimetric method to quantify the polysaccharides in a mixture of the four serotypes. Antibody-based techniques must be used to quantify mixtures. CE offers advantages because it is simple, more precise, automated and provides quantification in mixtures of polysaccharides without hydrolysis.
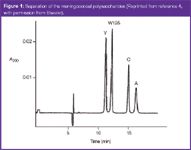
Figure 1
A typical electropherogram is shown in Figure 1. The CE method was compared favourable to the colorimetric method (Table 1), although no precision data was reported in the article. Using the data in the paper, the precision is estimated to be no greater than 7.7%. A paired t-test using the entire data set showed no significant difference between the methods. Using data from serotype Y, the relative standard deviaition (RSD) of the CE method was determined to be 2.8%. Because the estimate includes the analytical, process and sampling variability, the analytical variability must be less than this amount. CE has been used to determine the concentration of O-acetate groups in Streptococcus pneumoniae polysaccharides serotype 9V and 18C.5 Because these lack chromophores, potassium hydrogenphthalate was added for indirect detection at 254 nm. To prepare the samples for CE analysis, samples were hydrolysed for 16 hours using NaOH. The CE method was linear (R2 = 0.9999) with a LOD of 7 μM. The total variability for the methods was comparable to the ion chromatography (IC) method. The accuracy of the method was demonstrated through the absence of matrix effects and comparison with published reports. The CE method was superior to the IC method because of its speed, gentle buffer, ease-of-use and low-cost.
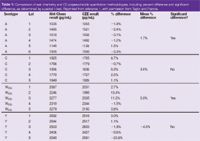
Table 1: Comparison of wet chemistry and CE polysaccharide quantitation methodologies, including percent difference and significant difference, as determined by a paired t-test. Reprinted from reference 1, with permission from Taylor and Francis.
What about CE for vaccine in-process methods?
An older publication reported the use of CE as an in-process test for the purification of recombinant hepatitis B vaccine.6 CE was used to quantify the amount of recombinant hepatitis B to demonstrate removal of impurities and show the presence and removal of reagents added to the process. A single CE method was able to monitor these parameters in each step of the 10-step process versus the use of a variety of different methods and different technologies.
As expected, the first step (a cell lysate step) showed a plethora of peaks in the electropherogram, including spikes from particulates in the sample. The next step (filtered lysate) electropherogram looked similar to the cell lysate step, although some proteins were removed across the microfilter. The following step is a 10-fold concentration step and the electropherogram reflects the increase in protein concentration. In the fourth step, the main product is absorbed on silica; this peak can be quantified, along with Triton X-100. The next step is a HIC step followed by treatment with Amberlite. These steps remove impurities. The seventh step is a diafiltration (100 kD MWCO) and gives a clean electropherogram with no Triton X-100 peak. The next step, another diafiltration step, looks similar to the previous step electropherogram with a reduction of impurity peaks. The last two steps are a sterilization and treatment with formaldehyde and thimerosal. No noticeable differences from the previous steps are noticed, with the exception of the appearance of thimerosal. The CE method was capable of quantifying thimerosal, Triton X-100 and the recombinant hepatitis B with good linearity (R2 of 0.999 or higher), although no precision or accuracy data was reported.
The quantification of Triton X-100 in an influenza vaccine has been described.7 Triton X-100 is added to limit aggregation and improve homogeneity during production of the influenza vaccine. A CE method was developed to quantify the Triton X-100 and Triton X-100 ethylene oxide oligomers levels in the process. The Triton X-100 method was inferior to a HPLC method, but the Triton X-100 ethylene oxide oligomers method performed well. As before, the separation was performed at 25 kV and detected at 200 nm. The CE method was linear (R2 = 0.99975), precise (4.5%), and showed an acceptable LOD (56 μg/mL).
How about CE for vaccine impurity methods?
Determination of the amount of free carrier protein is important for conjugate vaccines (vaccines which involve attachment to an immunogenic carrier protein). CE is well suited for this application because of its resolving power; conjugated vaccines are often well separated from the free protein.
CE has been used to determine the amount of free carrier protein in vaccines for Streptococcus pneumoniae and Neisseria meningiditis.8 The method was designed to separate free carrier protein from the conjugated polysaccharides. Free protein is a measure of the effectiveness of the conjugation reaction. The method was able to separate free carrier protein (diphtheria toxoid [Dt] or tetanus toxoid [Tt]) for a variety of conjugates (Figure 3) including
S. pneumoniae Type 7 conjugate,
S. pneumoniae Type 3 conjugate,
S. pneumoniae Type 18C conjugate as well as S. pneumoniae Type 5 conjugate, S. pneumoniae Type 6B conjugate,
N. meningiditis Type A conjugate,
N. meningiditis Type C conjugate,
N. meningiditis Type W135 conjugate and N. meningiditis Type Y conjugate. The method was able to quantify Dt with linearity (R2 > 0.99) and precision (5.8% RSD). The method was also able to determine the free polysaccharide because there was no significant overlap between the migration times for the polysaccharides when compared to the migration time of Dt or Tt (Figure 2). No peaks were observed for S. pneumoniae Type 6B and S. pneumoniae Type 23F.
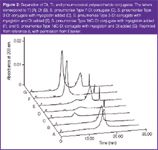
Figure 2
The same group published an optimized method for the determination of the amount of free protein for Meningococcal Polysaccharide-Diphtheria toxoid conjugate vaccines at the final bulk stage.9 The meningococcal conjugate migrated was resolved from the free Dt. The method had a LOD of approximately 15 μg/mL, which would allow for detecting as low as 2% free Diphtheria toxoid protein.
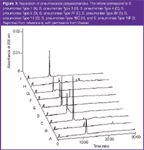
Figure 3
Can CE be used as an alternative technique for vaccines?
CE has shown great potential for use as an orthogonal technique for proteins. In addition, CE has proved to be an excellent alternative technique for vaccine characterization. The examples below show how CE has been used for purity assessments (replacing SDS-PAGE measurements) and for pI determination (replacing IEF gels).
Many vaccine companies have pursued a HIV vaccine. One company used a CE method to characterize their antigen, which was a recombinant HIV-1 gp120 protein expressed in CHO cells.10 The overall purity, based on molecules absorbing at 200 nm, was determined to be 98–99%.
CE was used to characterize the purity and to determine the pI of an attenuated recombinant Staphylococcus enterotoxin B.11 The Staphylococcus enterotoxin B gave a single peak at approximately 10 minutes. The cIEF method gave a pI for Staphylococcus enterotoxin B of 9.0 ± 0.1. The method was used on stability and showed no changes after 12 months when stored at –70 °C.
Are there any other applications?
Yes! One last application to discuss is the use of CE for nucleic acid applications. Some recent, albeit failed, vaccine candidates for HIV have included nucleic acids as their antigens. In addition, CE has been used to separate the products generated from RT-PCR of the RNA of polio virus where slab gel electrophoresis could not.12 For nucleic acid applications, CE is the best analytical technique to use.
The CE method used a capillary of either 37 cm (Leff = 30 cm) or 47 cm (Leff = 40 cm) in length and 100 μM in inner diameter with a buffer of linear polyacrylamide in TBE. The separation was performed using 200 V/cm (reverse polarity) and 20 °C with detection with LIF (λex = 488 nm and λem = 530 nm). Primer pairs were used to generate RT-PCR products from Mexican and Sabin 1 vaccine strains. Each of these strains showed a single peak at 163 bp (Mexican) and 97 bp (Sabin 1). A mixture of RT-PCR products of the Sabin 1 (97 bp), Sabin 2 (71 bp), and Sabin 3 (53 bp) viruses was separated and quantified by CE.
Conclusions
Table 2 shows a summary of some vaccine CE applications. There are many more applications of CE in the vaccine industry which have not been published. CE has been applied to a variety of applications including vaccine quantification, purity, pI determination, process monitoring, characterization and nucleic acid analysis. Given the diverse nature of vaccine antigens, more can be expected in the future.
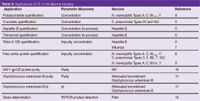
Table 2: Applications of CE in the Vaccine industry.
Brian K. Nunnally is currently the associate director in TO&PS Regulatory Affairs at Wyeth in Sanford, NC. Before joining TO&PS Regulatory Affairs, Dr. Nunnally was the associate director for GMP Operations in Vaccine Analytical Development at Wyeth. He previously worked for Eli Lilly and Company, leading a Quality Control (QC) laboratory devoted to new method development and implementing capillary electrophoresis (CE) in quality control.
References
1. B. K. Nunnally and K. Yao, Anal. Letters, 40, 615–627 (2007).
2. G. Hunt and W. Nashabeh, Anal. Chem., 71(13), 2390–2397 (1999).
3. J. S. Patrick and A. L. Lagu, Electrophoresis, 22, 4179–4196 (2001).
4. D. H. Lamb et al., Anal. Biochem., 338, 263–269 (2005).
5. R. Hepler and C. C. Yu Ip, J. Chrom. A, 680, 201–208 (1994).
6. W. H. Hurni and W. J. Miller, J. Chrom. A, 559, 337–343 (1991).
7. K. Heinig and C. Vogt, Fresenius J. Anal. Chem. 359, 202–206 (1997).
8. D. H. Lamb et al., J. Chrom. A, 894, 311–318 (2000).
9. D. H. Lamb, L. Summa and Q. P. Lei, Dev. Biol. (Basel), 103, 251–258 (2000).
10. D. H. Jones et al., Vaccine, 13(11), 991–999 (1995).
11. J. D. Coffman et al., Protein Expression and Purification, 24, 302–312 (2002).
12. E. F. Rossomando, L. White and K. J. Ulfelder, J. Chrom. B, 656, 159–168 (1994).

New Study Uses MSPE with GC–MS to Analyze PFCAs in Water
January 20th 2025Scientists from the China University of Sciences combined magnetic solid-phase extraction (MSPE) with gas chromatography–mass spectrometry (GC–MS) to analyze perfluoro carboxylic acids (PFCAs) in different water environments.
SPE-Based Method for Detecting Harmful Textile Residues
January 14th 2025University of Valencia scientists recently developed a method using solid-phase extraction (SPE) followed by high-performance liquid chromatography coupled to high-resolution mass spectrometry (HPLC–HRMS/MS) for detecting microplastics and other harmful substances in textiles.