Evaluation of Modified QuEChERS for Pesticide Analysis in Cannabis
Special Issues
While systems for growing, production and sale of cannabis and cannabis related products are well established, regulation and enforcement of quality and safety testing have lagged behind. However, state governments and private labs are focusing on product safety testing with special emphasis on pesticide analysis. This is partially the result of various product recalls, media attention and concern from patient advocacy groups. We evaluated a modified QuEChERS LC-MS/MS method for analysis of multiresidue pesticides. The AOAC QuEChERS method was used for a reduced 1.5 g amount of plant material and processed with a universal dSPE formulation. LC-MS/MS analysis used constant polarity switching ESI and monitored at least two transitions per analyte. Matrix-matched calibration was used for quantitation and both method and instrument internal standards were used. Analyte recovery validation was performed according to FDA guidelines by testing three matrices at three fortification levels in triplicate for over 200 pesticides. For the large majority of pesticides, in all three matrices and at all three fortification levels, recovery was between 70-120%.
Although systems for growing, production, and sale of cannabis and cannabis related products are well established, regulation and enforcement of quality and safety testing have lagged behind. However, state governments and private laboratories are focusing on product safety testing with special emphasis on pesticide analysis. This focus is partially the result of various product recalls, media attention, and concern from patient advocacy groups. We evaluated a modified quick, easy, cheap, effective, rugged, and safe (QuEChERS) sample preparation method followed by liquid chromatography–tandem mass spectrometry (LC–MS/MS) for the analysis of multiresidue pesticides. The Association of Analytical Communities International (AOAC) QuEChERS method was used for a reduced 1.5-g amount of plant material and processed with a universal dispersive solid-phase extraction (dSPE) formulation. LC–MS/MS analysis used constant polarity switching electrospray ionization (ESI) and monitored at least two transitions per analyte. Matrix-matched calibration was used for quantitation and both method and instrument internal standards were used. Analyte recovery validation was performed according to the United States Food and Drug Administration (US FDA) guidelines by testing three matrices at three fortification levels in triplicate for more than 200 pesticides. For the large majority of pesticides, in all three matrices and at all three fortification levels, recovery was 70–120%.
The United States legal medical and recreational cannabis market has established cannabis as a high value commodity. Cannabis sales in North America in 2016 were reported to be $6.7 billion, a 30% increase compared to 2015 (1,2). There is also a global movement for legalization adding to the importance of this commodity and the need for testing. Movement toward some form of legalization is occurring in Canada, Israel, Australia, and Spain with many more countries reassessing the legal status of cannabis (1,3,4).
As with any consumer item, product quality and safety are important. Quality and safety are paramount when cannabis is used for medical reasons with immunocompromised patients (5–7). The cannabis analytical testing market is new as well and in the process of building robust testing systems akin to those in industries such as the pharmaceutical and food industries. Potency testing is generally required for product labeling compliance and is often used to value plant material. Material with higher potency cannabinoids content is valued higher than material with lower cannabinoids content. Terpene testing is also a quality test that identifies the terpene content, which is linked to aroma and taste characteristics and thought to participate in medicinal action (8).
Product safety testing falls into several basic categories, including microbiological samples (for example, molds and fungi), heavy metals, aflatoxins, residual solvents, and pesticides. This work focused on pesticide residue testing in cannabis plant material. Concerns about pesticide use are seemingly justified as publicity indicating pervasive use and “high levels” of pesticides are fairly common. Pesticide use has also resulted in product recalls (9–12). However, the use of pesticides is confusing for growers and laboratories because of the lack of regulations or changing regulations, plus they do not have the benefit of the typical Environmental Protection Agency (EPA) oversight (7,13). The EPA registration process requires that extensive data, including toxicity data, be reported to the EPA so that maximum residue levels for a specific commodity can be set (14). This process sets allowable limits intended to protect human health.
The goal of the work described in this article is to evaluate well established techniques used by the food safety industry for use with cannabis plant material. The viability of quick, easy, cheap, effective, rugged, and safe (QuEChERS) sample preparation with liquid chromatography–tandem mass spectrometry (LC–MS/MS) analysis was investigated using the Association of Analytical Communities International (AOAC) QuEChERS method with a hydration step modification (15). Recovery of about 160 pesticides was determined at multiple fortification levels. Our results allow some indication as to the overall detectability of compounds in this complex matrix.
The QuEChERS sample preparation approach was used and is well established in the food safety industry (16). It is a generic approach that is well suited for multiresidue pesticide analysis in a variety of commodities. QuEChERS provides a “good enough” sample cleanup for analysis, both qualitative and quantitative, when paired with highly sensitive and selective analysis techniques like gas chromatography (GC) and LC–MS/MS. QuEChERS is much less resource intensive than previously used methods and is effective and compatible with many matrices, analytes, and both GC and LC analyses. Although cannabis presents some unique challenges, there is precedent for modifications to typical QuEChERS methods to deal with low water content commodities (17–19).
Experimental
Pesticide Standard
A multicomponent pesticide mix consisting of compounds varying in physiochemical properties was used. The pesticides represent different pesticide classes including organophosphorus, organonitrogen, and carbamate compounds. In addition, pesticides requiring testing or banned by states with a legal cannabis industry and amenable to LC were included (13).
The pesticide fortification solution at 10 ppm in 0.1% formic acid in acetonitrile was made by combining 10 stock solutions (Restek Corporation) immediately before use. Six deuterated pesticides were used as method internal standards by adding 75 µL of a 10 ppm solution at the beginning of sample preparation. The pesticides included atrazine-d5, diazinon-d10, dichlorvos-d6, dimethoate-d6, diuron-d6, and linuron-d6 and were combined from separate stock solutions at 100 ppm in acetonitrile (Restek Corporation). Linuron-d6 was the internal standard used for quantitative calculations. The other internal standards were analyzed in case the linuron-d6 data was compromised. The addition of 5 µL (10 µg/mL) of carbaryl-d7 (Restek Corporation) in 0.1% formic acid in acetonitrile per 1 mL of sample extract was used as an analytical internal standard to monitor instrument performance.
Cannabis Plant Material Fortification
Fortified cannabis flower samples were produced to determine pesticide recovery. We tested three different cannabis flower matrices indicated as orange kush flower, permafrost flower, and a composite. The composite material was a combination of flower and sugar leaves from several strains. The composite was necessary to secure enough pesticide-free material to perform the fortification experiment. These samples were tested to confirm the absence of pesticides before spiking with pesticides. We considered the samples to be “dry” but water content was not determined. Each matrix was spiked at three levels (50, 200, and 1000 ng/g “dry” weight) with the pesticide standard. These levels were chosen based on current and proposed regulatory limits from various states (13). Each spike level was performed in triplicate. Triplicate data allowed us to calculate average recovery and relative standard deviation (RSD) for each level in each matrix as well as across the three matrices. Matrix-matched calibration was used for quantitation and both method and instrument internal standards were used.
Typically, QuEChERS methods use 10–15 g of material per extraction and are ideal for commodities with high water content (>80%). In this work, 1.5 g of cannabis material was used in conjunction with hydration. This is a common modification of QuEChERS when dry material is tested (17,19).
Bulk material was gently mixed in the storage bag and then 1.5-g portions were weighed into 50-mL centrifuge tubes. Two 3/8-in. stainless steel balls were added to each tube and the material was homogenized for 5 min at 1500 rpm using a SPEX Geno/Grinder tissue homogenizer (SPEX SamplePrep). Next, 15 mL of LC–MS-grade water and 75 µL of the 10 ppm six-component deuterated pesticide mix were added. Pesticides were spiked at 1000 ng/g (ppb) by adding 150 µL of a 10-ng/µL pesticide spiking solution, 200 ng/g (ppb) by adding 30 µL of a 10-ng/µL pesticide spiking solution or 50 ng/g (ppb) by adding 7.5 µL of a 10-ng/µL pesticide spiking solution. These levels correspond to 100-, 20-, and 5-pg/µL (ppb) injection concentrations after sample preparation. Nonfortified samples were processed to determine incurred pesticides and produce matrix-matched calibration standards.
QuEChERS Extraction
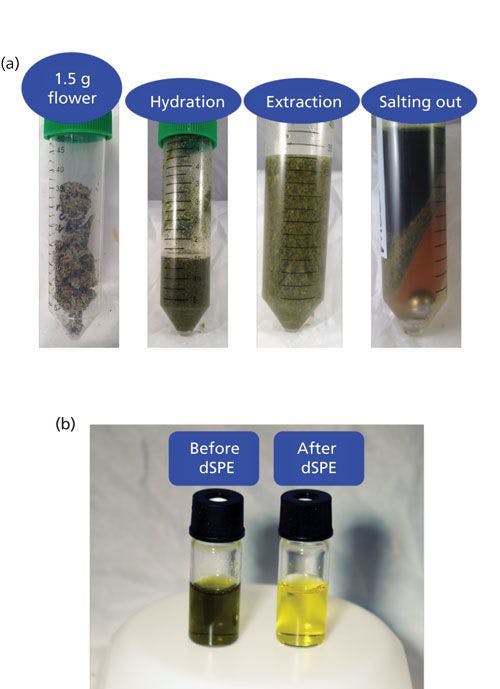
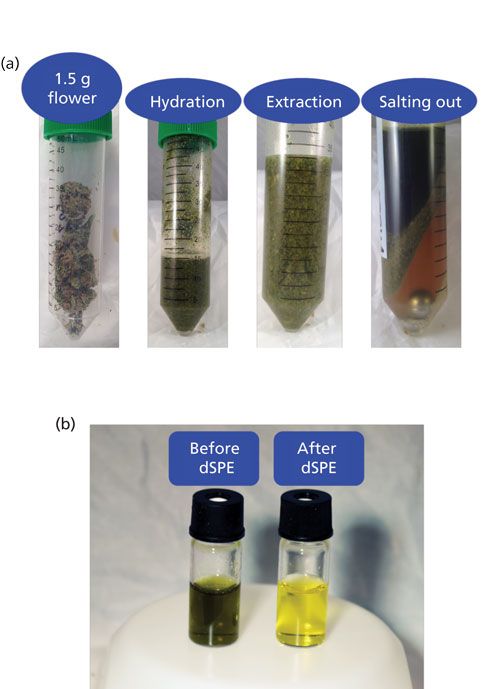
The AOAC QuEChERS method was used for sample extraction (15). After pesticide fortification, 15 mL of acetonitrile with 1% acetic acid was added to the homogenized and hydrated sample. After a 1-min shake on the tissue homogenizer (1500 rpm), the sample was allowed to extract for 30 min with periodic hand shaking. This extended extraction time was used to allow time for hydration and extraction of the dry material. Buffering salts containing 6 g of magnesium sulfate and 1.5 g of sodium acetate were added (Restek Corporation). Following a 1-min hand shake, the sample was centrifuged for 5 min at a force of 3000g. The top acetonitrile layer was removed to a clean vial. Photographs of the extraction steps are shown in Figure 1a.
Figure 1: (a) Images of each step of a QuEChERS extraction of 1.5 g of cannabis flower and (b) extract before and after dSPE showing pigment removal.
QuEChERS Dispersive Solid-Phase Extraction Cleanup
Extracts were cleaned by dispersive solid phase extraction (dSPE) consisting of loose sorbent in tubes. Primary secondary amine (PSA) sorbent removes coextracted compounds like sugars, fatty acids, and cannabinoids. It should be noted that the removal of cannabinoids is not significant with this method because of the high percent weight cannabinoid content and relatively low sorbent capacity. A C18 sorbent removes nonpolar matrix components and graphitized carbon black (GCB) reduces pigments and sterols. Magnesium sulfate removes trace amounts of water from the final acetonitrile extract. A dSPE formulation, referred to as universal, with 50 mg of PSA sorbent, 50 mg of C18 sorbent, 7.5 mg of GCB sorbent, and 150 mg of MgSO4, was used per milliliter of extract (Restek Corporation). Fortified samples were cleaned using the dSPE tube for 1 mL of extract. The 15-mL tube format was used to clean 8 mL of extract for the nonfortified samples to produce enough volume for matrix-matched calibration standards; however, the ratio of the sorbent amount to the extract volume was the same. Tubes were hand shaken for 2 min and centrifuged for 5 min. After 500 µL of the extract was placed in a Thomson single step standard filter vial (0.2 μm, Restek Corporation), 5 µL of a 5% formic acid in acetonitrile solution and 2.5 µL of a 10 ppm carbaryl-d7 in 0.1% formic acid in acetonitrile solution were added. Extract examples before and after dSPE are shown in Figure 1b.
Matrix-Matched Standards
Matrix-matched standards were prepared at 2000, 1000, 500, 200, 100, 50, and 20 ng/g (ppb). Matrix-matched standards were prepared by adding pesticide standard solutions to a final extract (post-cleanup) of a nonfortified sample so as not to exceed a 2% dilution with the addition of the pesticide standard. Recovery values for fortified samples for each matrix were calculated based on a matrix-matched calibration curve for that matrix.
LC–MS/MS Analysis
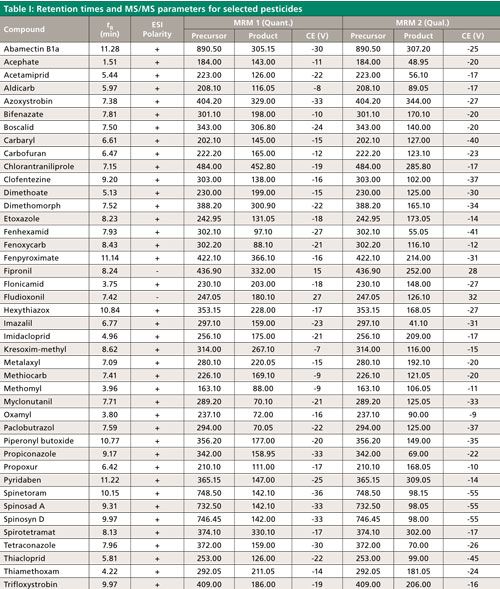
LC–MS/MS analysis was performed using a Shimadzu LCMS-8050 system with a Prominence HPLC system (Shimadzu Scientific Instruments). A 100 mm x 2.1 mm, 3-µm Raptor ARC-18 column, equipped with a Raptor ARC-18 Guard column housed in an EXP Direct Connect holder (Restek Corporation) was used with a flow rate of 0.5 mL/min. The column temperature was held at 40 °C and the autosampler temperature was held at 15 °C. The gradient program began with 90% of an aqueous solution containing 5 mM ammonium formate, 0.1% formic acid, and 10% methanol. This mobile-phase composition was held for 1.50 min and was ramped and reached 37% of the 5 mM ammonium formate with 0.1% formic acid solution and 63% methanol at 5.50 min. The next step was a linear ramp reaching 25% of the 5 mM ammonium formate with 0.1% formic acid solution and 75% methanol at 9.00 min, then ramping to 100% methanol at 10.00 min, where it was held for 2 min. The column was reequilibrated for 3 min at the initial mobile-phase conditions, which resulted in a 15-min run time. We used a 1-µL injection to help with the peak shapes of the early eluted pesticide since the extraction solvent was acidified acetonitrile and the initial mobile phase was primarily water. This approach also maintained column and instrument cleanliness and allowed many injections to be made before maintenance was needed. Retention times and multiple reaction monitoring (MRM) transitions for selected compounds can be found in Table I. These compounds have been named in state regulations and guidelines from Oregon, Washington, Nevada, and Massachusetts (13).
CLICK TABLE TO ENLARGE
The mass spectrometer ion source parameters were as follows: interface temperature, 300 °C; voltage, 4 kV (positive mode) and -3 kV (negative mode); nebulizing gas, 2 L/min; heating gas, 10 L/min; drying gas, 10 L/min; DL temperature, 250 °C; HB temperature, 400 °C; collision gas, argon at 270 kPa; MRM mode with 48-s detection window and 750-ms loop time. Collision energy was optimized for representative compounds and is listed in Table I. Electrospray ionization with continuous polarity switching mode, which acquires both positive and negative electrospray ionization (ESI) data, was applied so that all compounds were detected in a single analysis. One quantitative MS/MS transition and at least one qualifier transition were monitored for each analyte. The ion ratio of the qualifier–quantitative ions were compared to the ion ratio determined from solvent standards. Compound identification was confirmed if the experimental ion ratio was within 30% (relative) of the known ion ratio.
Results and Discussion
Matrix-Matched Calibration
Matrix-matched calibration is the gold standard for quantitation because it compensates for matrix effects. Matrix effects are the increase or decrease of analyte signal measured in the presence of matrix compared to solvent-only standards. It is common for LC–MS-based analysis to suffer from a decreased response when matrix extracts are tested. This decreased response is attributed to ion suppression of the analytes during ionization by the presence of coeluted coextracted matrix compounds. Ion suppression greater than 20% was observed for a significant number of analytes during method development, thus matrix-matched calibration covering 20 to 2000 ng/g was used.
About 470 calibration curves were evaluated (3 matrices x 158 compounds). Approximately 95% of the matrix-matched calibration curves showed r2 values of 0.99 or greater. The lowest r2 value observed was 0.94 for three curves. The compounds with lower r2 values were not the same across the three matrices tested. However, chlorantraniliprole, fludioxonil, abamectin B1a, bupirimate, and clethodim isomer 1 had r2 values less than 0.99 for two of the three matrices. Orange kush, dutch treat, and the composite had two, nine, and 12 compounds, respectively, with calibration curves with r2 < 0.99.
Detectability and Recovery
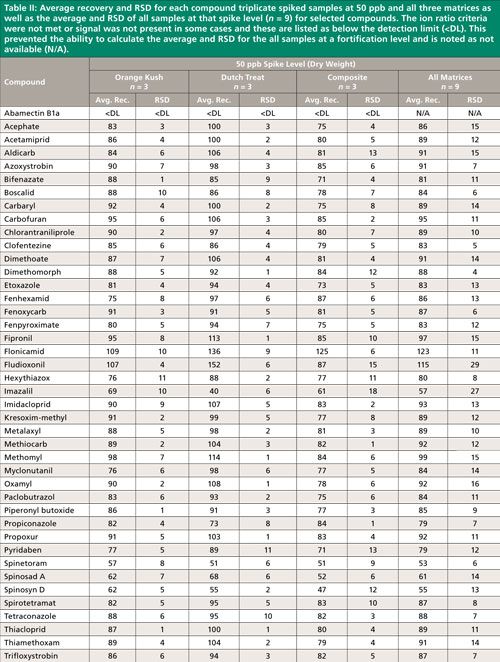
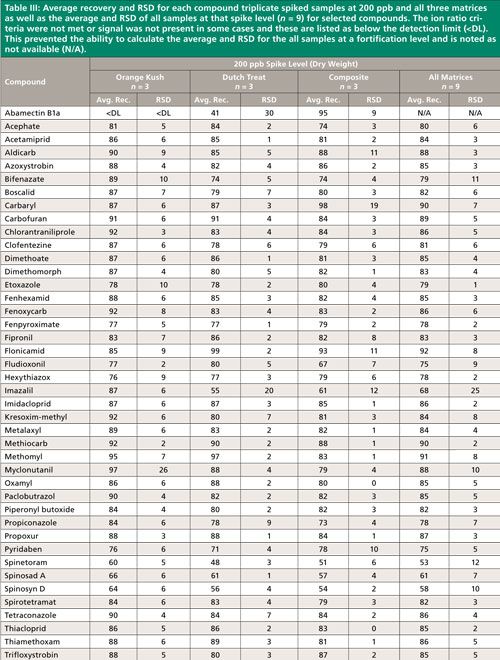
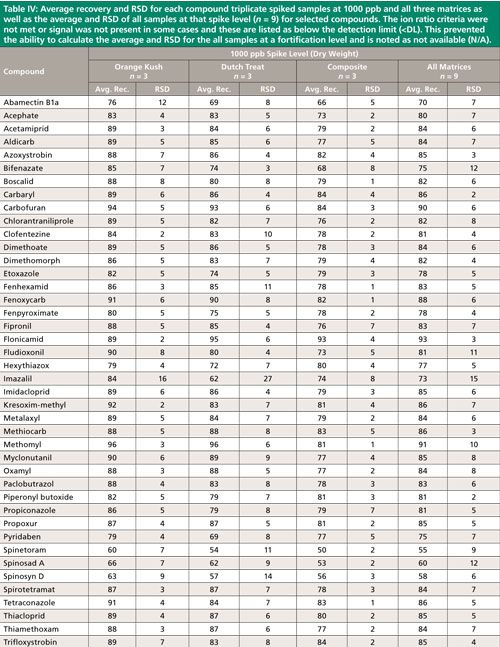
Summary recovery results (%) and relative standard deviation (RSD, %) of pesticides fortified in blank cannabis plant material matrices at 50, 200, and 1000 ng/g and extracted using the method described above are shown in Figures 2 and 3. Average recovery and RSD for compound triplicate spiked samples (n = 3) at each level and for all three matrices as well as the average and RSD of all samples at that spike level, (n = 9) for selected compounds can be found in Tables II–IV. The ion ratio criteria was not met or signal was not present in some cases and these results are listed as below the detection limit (<DL) in Tables II–IV, which resulted in an incomplete dataset. This occurred for six compounds at the lowest fortification level, which was at a 5-ppb injection concentration and for abamectin B1a at the midlevel fortification level. Abamectin, widely known by the trade name Avid, is a popular insecticide used to treat spider mites, a common cannabis pest. Abamectin is heat sensitive, so the hot LC–MS/MS interface used for other pesticides likely caused the abamectin signal to be low. Abamectin could be tested with different LC–MS/MS interface parameters to obtain the maximum signal and detect it at low levels.
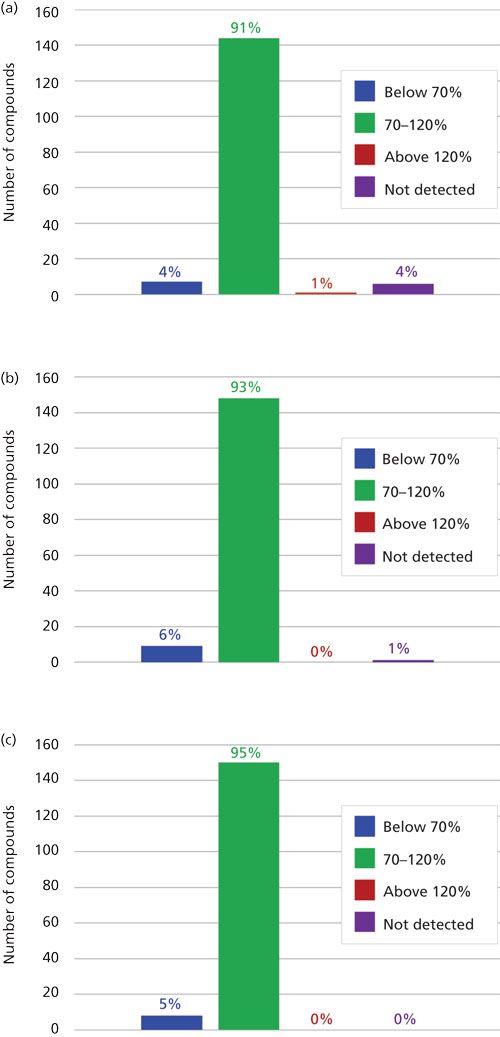
The desirable recovery range was defined as being between 70% and 120%. This recovery range is generally accepted as satisfactory by the food safety industry. The percentage of compounds in recovery ranges of below 70%, 70–120%, and above 120% as well as the percentage of compound not detected for each fortification level (n = 9) are shown in Figure 2. For the lowest spike level, 50 ng/g, 144 pesticides out of 158, or 91%, fell within this 70–120% recovery range. One compound, flonicamid, showed a recovery above 120% (123%, 11% RSD), seven compounds showed recovery lower than 70%, and six compounds were not detected (see Table II). For the 200-ng/g fortification level, 148 out of 158 compounds, approximately 93%, were recovered in the desired range, no compounds were above 120% recovery, nine compounds showed recovery lower than 70%, and abamectin B1a was not detected (see Table III). At the highest spike level, 1000 ng/g, 150 compounds out of 158 were recovered in the 70–120% range and eight compounds were recovered below 70% (see Table IV).
Figure 2: Percentage of pesticides that had average recovery values (n = 9) that fell below 70%, within 70–120%, and above 120% as well as not detected for triplicate spiked samples of three different plant materials tested at fortification levels (a) 50 ng/g, (b) 200 ng/g, and (c) 1000 ng/g.
CLICK TABLE TO ENLARGE
CLICK TABLE TO ENLARGE
CLICK TABLE TO ENLARGE
Compounds with low recovery, below 70%, showed less than desirable recovery across spike levels and matrices. Spinosad A and spinosad D showed slightly lower recovery, but these recovery values are generally consistent. Spiroxamine also showed lower recovery and was more variable. These compounds are slightly basic and recovery may be lower than other pesticides because of the acidic extraction conditions used during sample preparation. It is possible that a non-acidified QuEChERS method would be more appropriate for these compounds. Compounds with low but reproducible recovery included emamectin B1a, fenazaquin, fenbuconazole, and spinetoram. Imazalil and thidiazuron showed poor and irreproducible recovery.
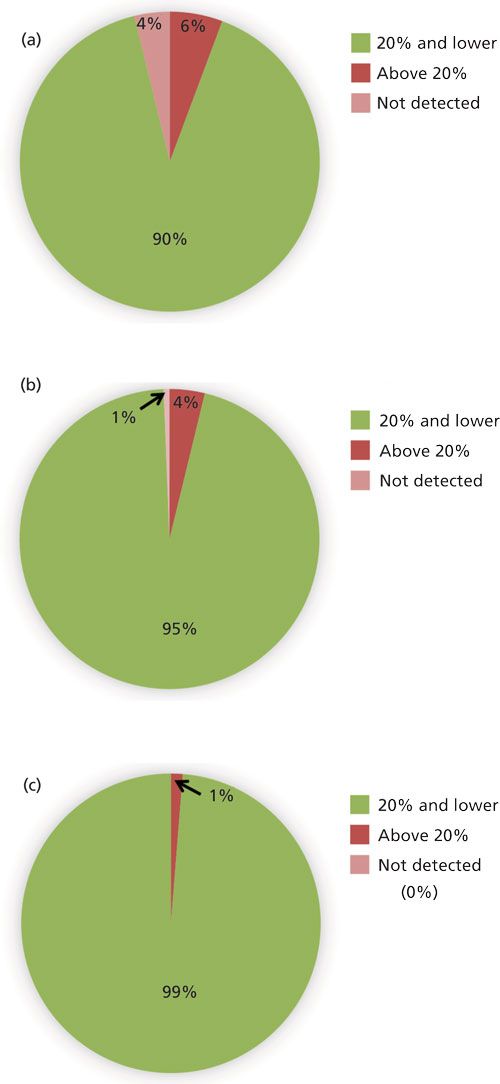
Figure 3 shows the percentage of pesticides with RSD values ≤20%, >20%, and not detected (ND) at each spike level. Recovery was considered reproducible for a pesticide at that fortification level when RSD ≤20% was achieved for all three matrices (n = 9). It is not surprising that the number of analytes not detected was highest at the lowest spike level corresponding to 5 pg injected on-column as indicated in Figures 2 and 3. All analytes were detected at the highest fortification level corresponding to 100 pg injected on-column. The same trend was observed for compounds with higher than desired recovery RSD. The lowest fortification level showed approximately 6% (nine pesticides) with RSD >20%, the mid-level spike showed a decrease to about 4% (six compounds), and the highest spike level showed only 1% (two compounds) with RSD >20%. No compounds that showed RSD values higher than desired were common to all three spike levels. In most cases, an RSD less than 20% was achieved for each matrix (n = 3) at a given spike level, but averaging recovery across the three matrices resulted in RSD > 20% (n = 9). These results indicate that recovery and quantitation were affected differently by each matrix for these compounds. Across all three matrices and fortification levels (n = 27) for most compounds were recovered reproducibly with RSD ≤20%.
Figure 3: Percentage of pesticides that had average recovery RSD (n = 9) that were 20% and below and above 20% as well as not detected for triplicate spiked samples of three different plant materials tested at fortification levels (a) 50 ng/g, (b) 200 ng/g, and (c) 1000 ng/g.
Currently, pesticides identified for testing differ for each state. The multiresidue method we developed includes about 40 of the nearly 60 pesticides in Oregon and 10 of 13 compounds in Colorado. Some of the compounds not covered are more amenable to GC analysis, thus coverage of relevant pesticides by this method is significant. Approximately 40 of the nearly 120 pesticides identified as targets by the Cannabis Safety Institute are covered by this method (20).
Conclusion
Overall, this method proved appropriate for multiresidue pesticide analysis in cannabis as demonstrated by the acceptable recovery and RSDs of nearly all of the almost 160 pesticide tested. Several pesticides tested are acid sensitive and using the original, unbuffered, or European EN 15662 methods could possibly improve recoveries of these compounds. Detectability for most compounds was sufficient, and quantitation using matrix-matched calibration was important because of the complexity of the cannabis matrices and the high cannabinoid content that remained in the final extract. The method was rugged primarily because of pigment removal and the use of a low injection volume. Using this method, the analysis of multiresidue pesticides in cannabis plant material was successful using an easy and inexpensive QuEChERS approach paired with sensitive LC–MS/MS analysis.
References
- C. Morris, special to CNBC.com, “The Next Big Billion-Dollar Cannabis Markets Investors Are Rushing To,” 2016, available from: http://www.cnbc.com/2016/10/21/the-next-big-billion-dollar-cannabis-markets-investors-are-rushing-to.html.
- Marijuana Business Daily, “Report: North America Marijuana Sales Hit $6.7 Billion in 2016,” 2017, available from: https://mjbizdaily.com/report-north-america-marijuana-sales-hit-6-7-billion-in-2016/.
- D. Giznik, “Israel Just Decriminalized Recreational Cannabis,” Herb, 2017, available from: http://herb.co/2017/03/07/israel-decriminalized-cannabis-2/.
- M. Senthilingam, “Germany Joins Global Experiment on Marijuana Legalization,” CNN.com, 2017, available from: http://www.cnn.com/2016/12/29/health/global-marijuana-cannabis-laws/.
- J. Pizzorno, Integr. Med. (Encinitas) 15(6), 8–12 (2016).
- J.C. Raber, S. Elzinga, and C. Kaplan, J. Toxicol. Sci. 40(6), 797–803 (2015).
- D. Stone, Regul. Toxicol. Pharmacol. 69(3), 284–288 (2014).
- E.B. Russo, Br. J. Pharmacol. 163(7), 1344–1364 (2011).
- Denver Department of Environmental Health, “GMC LLC Voluntarily Recalls Medical and Recreational Marijuana and Products Due to Pesticide Residues,” 2017, available from: https://www.denvergov.org/content/denvergov/en/environmental-health/about-us/news-room/2017/GMCRecall.html.
- D. Migoya and R. Baca, “Caregivers For Life Faces Another Recall Over Pesticide-Tainted Pot,” The Denver Post, 2016, available from: http://www.denverpost.com/2016/04/21/caregivers-for-life-faces-another-recall-over-pesticide-tainted-pot/.
- D. Migoya and R. Baca, “Pesticide Recall Hits Life Flower Medical Marijuana Dispensary,” The Denver Post, 2016, available from: http://www.denverpost.com/2016/04/25/pesticide-recall-hits-life-flower-medical-marijuana-dispensary/.
- N. Sullivan, S. Elzinga, and J.C. Raber, J. Toxicol. 2013, 378168 (2013).
- L. Rough, “Leafly’s State-by-State Guide to Cannabis Testing Regulations,” Leafly. com, 2016, available from: https://www.leafly.com/news/industry/leaflys-state-by-state-guide-to-cannabis-testing-regulations.
- US EPA, Pesticide Registration, (U.S. Environmental Protection Agency, Washington, D.C., Pesticide Registration Manual, 2017). Available at: https://www.epa.gov/pesticide-registration/pesticide-registration-manual
- AOAC Official Method 2007.01, “Pesticide Residues in Foods by Acetonitrile Extraction and Partitioning with Magnesium Sulfate,” (Association of Analytical Communities International, 2007).
- M. Anastassiades et al., J. AOAC Int. 86(2), 412–431 (2003).
- U. Koesukwiwat et al., J. Agric. Food Chem. 58(10), 5950–5958 (2010).
- G. Martínez-Domínguez et al., Food Chem. 177, 182–190 (2015).
- K. Mastovska et al., J. Agric. Food Chem. 58(10), 5959–5972 (2010).
- P. Rodger Voelker and P. Mowgli Holmes, “Pesticide Use on Cannabis,” Cannabis Safety Institute (2015), available from: http://cannabissafetyinstitute.org/wp-content/uploads/2015/06/CSI-Pesticides-White-Paper.pdf.
K. Mastovska et al., J. Agric. Food Chem. 58(10), 5959–72 (2010).
P. Rodger Voelker and P. Mowgli Holmes, “Pesticide Use on Cannabis,” Cannabis Safety Institute (2015), available from: http://cannabissafetyinstitute.org/wp-content/uploads/2015/06/CSI-Pesticides-White-Paper.pdf.
Julie Kowalski was formerly with Restek Corporation in Bellefonte, Pennsylvania, and is now with Trace Analytics in Spokane, Washington. Jeffrey H. Dahl is with Shimadzu Scientific Instruments in Columbia, Maryland. Amanda Rigdon is with Emerald Scientific in San Luis Obispo, California. Jack Cochran is with VUV Analytics in Cedar Park, Texas. Derek Laine and Gordon Fagras are with Trace Analytics. Direct correspondence to: Julie@traceanalytics.com


.png&w=3840&q=75)

.png&w=3840&q=75)


.png&w=3840&q=75)


.png&w=3840&q=75)
