Essential Theory of HPLC
Challenges that can be encountered when using isocratic high performance liquid chromatography (HPLC) can be overcome by using gradient HPLC.
Challenges that can be encountered when using isocratic high performance liquid chromatography (HPLC) can be overcome by using gradient HPLC.
The elution mechanism in gradient high performance liquid chromatography (HPLC) is fundamentally different to that of the isocratic mode. In gradient HPLC, as the elution strength is initially low, analytes may be stationary within the column, partitioned fully into the stationary phase. As the elution strength increases, the analytes begin to migrate through the column with increasing speed, and, depending upon the gradient profile and column length, may be travelling at the same velocity as the mobile (that is, it does not partition into the stationary phase at all) prior to elution. This contrasts with isocratic HPLC, in which the analyte will move with constant speed through the column, as the elution strength of the mobile phase does not change.
While retention behaviour in isocratic HPLC is described using the retention factor (k) in gradient HPLC, this is not appropriate, as the retention factor is continuously varying and we must use a new relationship to describe the retention behaviour, which is shown in equation 1:

tg is the gradient time in minutes, F is the eluent flow rate in mL/min, âΦ is the change in eluent composition (0.4 for a 20% to 60% B gradient), Vm is the interstitial volume of the column, which is estimated by equation 2:

S is a shape selectivity factor, which can be estimated by 0.25 Mw0.5 (for analytes < 1000 Da a value of 5 is typically used for S).
So for the following separation:
- Column: C18 150 × 4.6 mm, 5 μm
- Flow rate: 1.5 mL/min
- Gradient: 20% to 65% acetonitrile (0.1% formic acid) in 7 min
k* would be calculated as follows (equation 3):

For a “good” method, we would ideally want k* to lie in the range 2 to 10, and, for an “acceptable” method, k* should certainly be in the range 1 to 20.
If k* is too low, then we risk interference from other sample components or analytes, as the analyte does not have enough affinity for the stationary phase to differentially partition away from other sample components. When k* is too high, the analysis time is unnecessarily long.
Equation 1 also highlights the important factors that can be easily varied to optimize retention (and therefore selectivity and resolution) in gradient HPLC as the initial and final composition of the gradient (as defined by âΦ), the gradient steepness (as defined by gradient time [tg] assuming âΦ remains unchanged), and the eluent flow rate. The column dimensions can also be altered to effect changes in k*; however, this is much less convenient from a method development perspective.
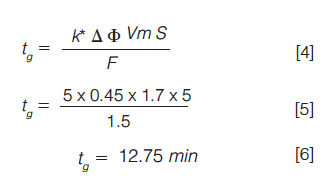
Of these, it is perhaps most convenient to alter the gradient steepness, and we can rearrange equation 1 in a more usable form to allow us to make a prediction of the optimum value of tg for a particular separation as given in equations 4 through 6:

In this way, we can predict the optimum gradient time based on the other parameters within the method. In order to generate an “ideal” k* value of five, in this case a gradient value of 12.75 min would have produced a more ideal separation than the original time of seven minutes.
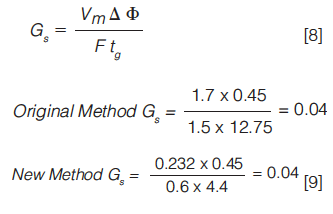
We may also use another very useful relationship that defines an adjusted gradient steepness (Gs), and which can be used to maintain analyte selectivity when other factors in method are adjusted as in equation 7:

So, for our original example (gradient time of 12.75 min), if we wanted to change the column dimensions to 100 × 2.1 mm (with a corresponding Vm value of 0.232), by maintaining a constant value for Gs in equation 7, through altering the flow rate or gradient time for example, we might expect the chromatogram to be similar in both cases (equations 8 and 9):

By altering the flow rate to 0.6 mL/min (a sensible flow rate for this new column dimension), we can see that a gradient time of 4.4 min will produce a theoretically equivalent separation.

Characterizing Plant Polysaccharides Using Size-Exclusion Chromatography
April 4th 2025With green chemistry becoming more standardized, Leena Pitkänen of Aalto University analyzed how useful size-exclusion chromatography (SEC) and asymmetric flow field-flow fractionation (AF4) could be in characterizing plant polysaccharides.
Investigating the Protective Effects of Frankincense Oil on Wound Healing with GC–MS
April 2nd 2025Frankincense essential oil is known for its anti-inflammatory, antioxidant, and therapeutic properties. A recent study investigated the protective effects of the oil in an excision wound model in rats, focusing on oxidative stress reduction, inflammatory cytokine modulation, and caspase-3 regulation; chemical composition of the oil was analyzed using gas chromatography–mass spectrometry (GC–MS).


