The Electronic Control of Carrier Gas Pressure, Flow, and Velocity
LCGC North America
How does a GC system set and control gas pressures, flows, and carrier gas velocities electronically?
Have you wondered how your gas chromatography (GC) system sets and controls gas pressures, flows, and carrier gas velocities electronically? Here, we describe requirements for and the operation of electronic gas control systems for GC columns and detectors.
Computerized or electronic pneumatic control (EPC) systems for carrier gas, split flow control, and detector gases abound in modern gas chromatographs (GC), as well as in headspace samplers and column switching systems. The accuracy and repeatability of EPC are superior to that of manual adjustment, and the improved control of instrument parameters greatly reduces the possibility for making gas-related mistakes. Computerized pneumatics excel at controlling column pressure drop or detector gas flow rates. An EPC system generally relieves operators from having to make repetitive adjustments and measurements with a flow meter and stopwatch. However, running an EPC system blindfolded, so to speak, by never cross-checking actual gas behavior with selected set-points, only invites trouble. Like any computer system, the results can only be as good as the column and gas parameters that a user enters. Thus, a good working understanding of how an EPC system works and what goals are to be accomplished is essential for obtaining the best possible results.
How It Works
In an EPC system, gas flows from the gas supply input, through a metering valve, into a pressure or flow transducer, and then out to the device — inlet, detector, or other GC component — that consumes the gas. The GC system sends a set-point value to the EPC controller, which returns the measured flow or pressure value from its transducer. The set-point and actual values are compared in the EPC system, which adjusts the metering valve as required to maintain the desired set point. The EPC controller incorporates column and carrier gas characteristics to determine the necessary pressure drop at any given moment. Atmospheric and gas supply pressures plus controller temperatures are included as required to compensate for drift and instabilities.
In the simplest configurations an EPC channel acts as a carrier gas flow controller for a packed column or controls a detector gas, such as air or hydrogen, for flame ionization detection (FID). Two controllers — one pressure and one flow — can provide the split flow and inlet pressure for a capillary column inlet splitter. Other more complex applications include pressure or flow controllers for auxiliary devices such as purge-and-trap or headspace samplers, or pressure-switching controllers for multidimensional column systems.
Computer-controlled pneumatics cannot prevent operators from selecting inappropriate column pressures or split flow rates. An operator may easily establish incorrect conditions and become misled as to the reasons for a problem. Because of their complexity and flexibility, computerized pneumatic systems offer analysts more opportunities for errors.
Capillary Column Control
One of the most common applications for EPC is the control of capillary (open-tubular) column carrier gas. The column flow rate and the carrier gas linear velocity are complex functions of the column dimensions, oven temperature, and type of carrier gas. The mathematical relationships between GC column dimensions, temperature, and flow, pressure, and linear velocity are well understood. Fortunately for today's GC users, all of this is incorporated into the EPC system, which acts as a kind of gas calculator.
A wide-bore 30 m × 530 µm column makes a good example to help understand the ins and outs of EPC control. At 50 °C with helium carrier gas this column will require about 4.1 psig of inlet pressure to maintain a flow of 5.6 mL/min or an average carrier gas linear velocity of 40.0 cm/s. I know this because I used the EPC "calculator" in my GC system to compute the pressure, flow, and velocity by first entering the column dimensions, carrier gas type, oven temperature, and desired velocity of 40 cm/s. Because I am using a split inlet, I entered the split ratio as well. With this column, a desired split ratio of 20:1 results in a split-flow set point of 112 mL/min.
Garbage In, Garbage Out
An alert reader will realize at this point that they could have entered an incorrect column length or internal diameter, or perhaps failed to correct an existing set of parameters from the previously installed column. This type of error would, for the most part, go unnoticed by the GC system itself unless a required pressure or flow could not be attained by the controller. Suppose that the column internal diameter was mistakenly set at 320 µm. Entering a velocity of 40 cm/s would result in a pressure drop of 20.7 psig. This is achievable by the EPC controller, which upon increasing the pressure to that level would cause the actual 530-µm column flow to increase to 41.9 mL/min with an average linear velocity of 190 cm/s! The split ratio of 20:1 would still call for a split flow rate of 112 mL/min, and so the actual split ratio would be more like 2.67:1.
These erroneous operating parameters are within the capabilities of the split inlet pressure and flow controllers, so the GC system would not report an error even though the column was operating very far from its desired set point. A subsequent injection might alert the operator to a problem; the peaks would be eluted too rapidly and they would be much larger than expected. If not identified immediately this type of problem could cause serious difficulties later on. Of course, if the retention times were known under the correct conditions then this situation would be evident after one injection.
Rather than wait until after a run is recorded to discover such errors, the operator can double-check flow rates or unretained peak times after a column has been installed and the preliminary setup completed. Time an unretained peak or measure the flow at the column outlet and compare that to what the EPC system says they should be. Bear in mind that direct flow measurement is more difficult with smaller internal diameter columns, and if necessary use an electronic flow meter that is rated for low flow rates.
Small deviations in the actual column internal diameter or length will give rise to relatively small errors in actual velocities or flows, as discussed in more detail in another "GC Connections" installment (1). For the best accuracy, it's a good idea to include the stationary phase film thickness, if greater than about 1 µm, with the column dimensions entered into the GC system.
Pneumatic Programming
The pressure drop that's required for a particular column flow depends on the oven temperature as well as the column dimensions and carrier gas, so the operator must specify the temperature at which the desired flow is to be achieved — this is nearly always the same as the initial oven temperature. So far so good, but what happens when the column temperature increases during oven temperature programming? The column flow rate depends on the oven temperature, as well as many other factors, so the flow and velocity will change during temperature programming. The EPC split inlet controller maintains a set pressure level and does not directly control flow or velocity — it must instead calculate the pressure required to establish a desired flow or velocity. What are the effects of choosing these different pneumatic control modes?
Constant Column Pressure Drop
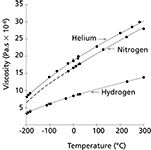
As temperatures increase so does the carrier gas viscosity, which causes the flow and velocity to decrease at higher temperatures if the pressure is kept constant. Figure 1 shows the relationships of temperature and gas viscosity for three common GC carrier gases. EPC systems use these relationships to calculate carrier-gas viscosity dynamically as the oven temperature changes. Figure 1 gives a good idea of how large this viscosity effect can be. Going from 50 °C to 250 °C, for example, causes helium viscosity to increase by about 40%. The other carrier gases undergo viscosity changes of a similar magnitude.

Figure 1: Carrier gas viscosity as a function of temperature (adapted from reference 2). The dots correspond to published measurements; the solid lines represent interpolated data and the dashed lines extrapolated data.
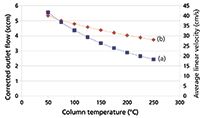
With a constant inlet pressure drop, the column flow decreases during temperature programming. Figure 2 illustrates the effect on carrier gas flow and average linear velocity of changing the oven temperature while holding the pressure drop constant, using our example wide-bore column with a constant 4.1 psig of helium carrier gas. The column flow rate of 5.6 mL/min at 50 °C decreases to 2.5 mL/min at 250 °C, a 55 % loss. Across the same temperature range, the average linear velocity decreases from 40 cm/s at 50 °C to 28 cm/s at 250 °C, a 30% loss.

Figure 2: Theoretical effect of column temperature on (a) corrected carrier gas flow and (b) average linear velocity with constant pressure drop. Column dimensions: 30 m à 0.530 mm; pressure drop: 4.1 psig; carrier gas: helium; column outlet pressure: 1 atm.
When using a constant inlet pressure with temperature programming, the reduction in flow rate at elevated temperatures can cause unwanted peak broadening as the carrier gas velocity departs from optimum, and it also can extend elution times unnecessarily. Usually in this situation, choosing a different pneumatic operating mode will produce better results.
Constant Column Flow Rate
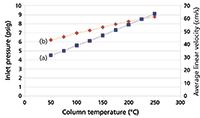
An EPC system can be programmed to increase the column pressure drop sufficiently to maintain a constant carrier-gas flow rate as the temperature increases. Figure 3 shows how this choice affects the pressure drop and the average linear velocity. The EPC controller maintains a constant column flow of 6.0 mL/min by increasing the pressure drop from 4.5 psig at 50 °C to 9.1 psig at 250 °C. Note that the average linear velocity increases as the oven temperature goes up, which perhaps runs counter to intuition. But with a constant flow rate the linear velocity can remain in a more efficient region somewhat higher than optimum, which largely will avoid column efficiency losses. Peaks will be eluted sooner and at lower temperatures, reducing the total run time compared to constant pressure operation.

Figure 3: Theoretical effect of column temperature on (a) carrier gas pressure drop and (b) average linear velocity while maintaining constant corrected column flow. Column dimensions: 30 m à 0.530 mm; column flow: 6.0 mL/min; carrier gas: helium; column outlet pressure: 1 atm.
Detector Effects
Large shifts in column flow rate can affect detector operation. Constant column flow is desirable for consistent detector function during temperature programming. Mass spectrometry (MS) detection solute ionization fragmentation patterns depend somewhat on the source pressure, which in turn depends on the incoming flow rate, especially with higher column flows. Granted, the 530-µm column example discussed here is not the best choice for direct interfacing to a benchtop mass spectrometer, but the benefits can be significant in terms of consistent spectra and library searches for those narrower internal diameter columns that can be connected directly.
When FID is used with hydrogen carrier, it's a good idea to keep the total hydrogen flow through the detector constant. This can be accomplished in two different ways, either by maintaining a constant column flow rate or by programming the detector hydrogen flow to compensate for changes in the column flow, that is, by keeping the sum of the column and detector hydrogen flows constant.
Flow Control Versus Pressure Control
Ultimately, the most important consideration may be peak resolution and not necessarily detector performance, especially in situations where the separation is marginal. Deciding whether constant pressure or constant flow will yield a better temperature-programmed separation, let alone the effects of changing the temperature program itself, is a more complex consideration that doesn't give itself over very well to purely theoretical modeling. Relative peak positions in a chromatogram depend heavily on the thermodynamic relationships between the stationary phase and a solute's chemical characteristics. As a result, individual peaks move in different ways relative to each other as the temperature changes.
In general, the more the chemical natures of a pair of peaks differ, the greater the effect of changing the column temperature or temperature program will be. At higher flows, peaks will be eluted earlier in a temperature program and, therefore, at somewhat lower column temperatures. But this change of elution temperature may or may not improve the separation of a pair of peaks if both are not affected in the same way. This effect is illustrated in the series of test chromatograms shown in Figure 4. Here, a test mixture was injected with either constant pressure or constant flow programmed pneumatics, with the initial pressure drop the same in either case. The program rate was doubled in each of four consecutive runs, from 3 °C/min to 6 °C/min, 12 °C/min, and finally 24 °C/min.

Figure 4: Series of chromatograms at increasing oven temperature program rates with constant pressure or constant flow controlled pneumatics. Temperature programming from 50 °C, hold 2 min, then to 250 °C at: (a) 3 °C/min; (b) 6 °C/min; (c) 12 °C/min; (d) 24 °C/min. Constant pressure at 4.1 psig (P) or constant flow at 6.0 mL/min (F). Column: 30 m à 0.530 mm, 1.3-µm df EC-Wax. 1.0 µL manual injections split 20:1 at 200 °C. Peaks: 1 = n-C10, 2 = n-C11, 3 = n-C12, 4 = n-C13, 5 = 2-octanone, 6 = 1-octanol, 7 = 2,6-dimethylaniline, 8 = 2,4-dimethylphenol.
The overall effects of constant flow compared to constant pressure operation are clear in these chromatograms: The peaks all are eluted sooner with constant flow. The last peak in the run, 2,4-dimethylphenol (DMP), is eluted at 24.85 min with constant pressure and at 22.79 min with constant flow at 6 °C/min. Similar reductions in retention times hold for the other peaks when the flow rate is kept constant, across all of the selected programming rates.
The effects on retention times of increasing the temperature program rate far outweigh the differences observed between constant pressure and constant flow pneumatic modes. The DMP peak moves in from 40.66 min at 3 °C/min (elution temperature = 166 °C) to 11.1 min at 24 °C/min (elution temperature = 250 °C). Again, there are no surprises here — the temperature effects are quite strong.
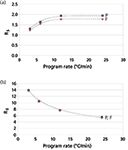
The overall effect on peak resolution, however, is somewhat unexpected. The two closest-eluted peak pairs, n-decane–2-octanone and 2,6-dimethlyaniline (DMA)–DMP, show opposite trends. Resolution increases with temperature program rate for the first pair but decreases for the second pair, regardless of the pneumatic programming mode. Interestingly, the constant pressure mode gives slightly better resolution than the constant flow mode for the first pair, but makes little difference for the later peak pair. Figure 5 plots the resolution of these two peak pairs as a function of the temperature programming rate and the pneumatic mode.

Figure 5: Peak resolution (RS) as a function of temperature programming rate and pneumatic mode for (a) n-C13 and 2-octanone, and (b) 2,6-dimethylaniline and 2,4-dimethylphenol. P = constant pressure and F = constant flow. Conditions and chromatograms from Figure 4.
Although the resolution of DMA–DMP is high in all cases — there is no reason to be concerned with this peak pair itself — if there were other peaks between these two in a "real" sample, then it would be interesting to find an optimum set of conditions for the overall chromatogram instead of choosing the best case for the first peak pair. A temperature programming rate of 12 °C/min might be a good choice because it keeps the resolution of the first pair while still utilizing a good portion of the available resolving power between the second pair.
A better choice might be to use a two-ramp temperature program instead of a compromise single-ramp program. At the time that the first peak pair is being eluted, the later-eluted DMA–DMP pair has not started to move along the column much, so cutting the temperature programming rate back to 6 °C/min or even 3 °C/min halfway through the run would make some sense. That way, the later-eluted pair would behave in much the same way as found by running the entire chromatogram at the lower rate, while the earlier pair would get the full advantage of the maximum available resolution. Of course, other solutions might include changing to a narrow-bore column or investigating the effects of a different stationary phase composition.
Overall, these examples demonstrate that there can be significant differences in how peaks behave relative to each other as the column pneumatic and thermal conditions are varied. Clearly, such changes can affect resolution in ways that may not be anticipated. Chromatographers always should validate and confirm that required peak resolution and quantitation performance levels are met after making any changes to the chromatography.
Conclusion
Computerized pneumatic control adds a very capable multipurpose tool to the chromatographer's tool belt. Such systems make setting up a GC system easier by automating some tasks. They can give more repeatable results from run to run and laboratory to laboratory. Some detector performance improvements can be obtained with constant carrier-gas flow control. And computerized pneumatics excel in facilitating advanced separations techniques. But when it comes to chromatographic performance gains in solute resolution, the choice of constant flow or constant pressure control can produce significant differences for multiple peak pairs in the same analysis.
References
(1) J.V. Hinshaw, LCGC North Amer. 3(30), 224–233 (2012).
(2) J.V. Hinshaw and L.S. Ettre, Introduction to Open-Tubular Column Gas Chromatography (Advanstar, 1994), p. 25.
John V. Hinshaw"GC Connections" editor John V. Hinshaw is a Senior Scientist at Serveron Corporation in Beaverton, Oregon, and a member of LCGC's editorial advisory board. Direct correspondence about this column to the author via e-mail: lcgcedit@lcgcmag.com.

John V. Hinshaw

This information is supplementary to the article “Accelerating Monoclonal Antibody Quality Control: The Role of LC–MS in Upstream Bioprocessing”, which was published in the May 2025 issue of Current Trends in Mass Spectrometry.
Investigating the Protective Effects of Frankincense Oil on Wound Healing with GC–MS
April 2nd 2025Frankincense essential oil is known for its anti-inflammatory, antioxidant, and therapeutic properties. A recent study investigated the protective effects of the oil in an excision wound model in rats, focusing on oxidative stress reduction, inflammatory cytokine modulation, and caspase-3 regulation; chemical composition of the oil was analyzed using gas chromatography–mass spectrometry (GC–MS).
Evaluating Natural Preservatives for Meat Products with Gas and Liquid Chromatography
April 1st 2025A study in Food Science & Nutrition evaluated the antioxidant and preservative effects of Epilobium angustifolium extract on beef burgers, finding that the extract influenced physicochemical properties, color stability, and lipid oxidation, with higher concentrations showing a prooxidant effect.


