Electrochemistry and LC–MS for Metabolite Generation and Identification: Tools, Technologies, and Trends
LCGC Asia Pacific
This article provides an introduction to electrochemical liquid chromatography mass spectrometry.
The elucidation of oxidative metabolism reactions is a crucial point in drug development. Generally, in vivo or in vitro experiments with liver microsomes or hepatocytes are performed. A complementary, purely instrumental method is presented in this article. In an electrochemical (EC) flow-through cell, the oxidative metabolism of xenobiotics is simulated. The cell is used in an online set-up with liquid chromatography–mass spectrometry (LC–MS), so that a separation with subsequent detection and identification of the metabolites is possible. The article provides an introduction to this new approach. The instrumental set-up is presented and selected applications of EC-LC–MS in drug development processes are discussed.
The elucidation of the metabolic fate of drug candidates in the human body is one of the major challenges in pharmaceutical research (1). The main route of drug elimination is an enzymatic biotransformation. This is frequently initiated by oxidation reactions ("phase I metabolism"), which are catalyzed by enzymes of the cytochrome P450 superfamily (2). With a strongly increasing number of novel chemical entities (NCEs) in recent years, rapid screening techniques that provide both reliable and easily accessible information about the biotransformation of a drug candidate are required. The earlier these tests are performed, the earlier unsuitable drug candidates can be excluded from the development process, thus leading to significant economic advantages in the early stages of drug discovery. For this reason, various model systems, which mimic metabolic processes in vitro have been developed (3).
The established methods for in-vitro simulation of the oxidative metabolism are generally based upon cytochrome P450 enzymes originating from the liver, including an isolated perfused animal liver, liver slices, hepatocytes or, most importantly, liver-cell microsomes (4). However, these testing schemes are based upon animal experiments and are tedious, time consuming, and of limited reproducibility.
Electrochemistry (EC) is one of the classical methods to induce oxidation reactions. It thus seems obvious to employ EC as a simulation technique in drug-metabolism studies. Electrochemical flow-through cells coupled online to analysis techniques, such as mass spectrometry (MS) with or without previous liquid chromatographic separation (EC-LC–MS or EC–MS), have now become the technique of choice for these simulation experiments because they may provide exhaustive information about the nature of the electrochemically generated metabolites. The respective experimental approaches, applications and possible future trends are presented in this article.

KEY POINTS
Experimental
Electrochemical cells: The majority of studies towards the electrochemical simulation of the oxidative metabolism has been performed using commercially available coulometric flow-through cells. Besides that, amperometric thin-layer or wall-jet cells have been implemented in a number of studies (5–7). All three types of electrochemical cells are equipped with a three electrode set-up, consisting of a working-electrode, a reference electrode and a counter electrode. The oxidation potential is set between the counter electrode and the working electrode. Polarization effects on the counter electrode, resulting in unstable working potentials, are compensated by the reference electrode, which is most commonly based upon Pd/H2.
The cell geometries of the amperometric and coulometric cells are presented in Figure 1. The working electrode of the coulometric flow-through cell in Figure 1a consists of porous glassy carbon. The analytes are passed through the electrode and are oxidized at the large surface area. The main feature of the coulometric flow-through cell is the high conversion rate, which is affected by the flow rate (~10–500 μL/min) to only a minor extent. The cell is almost maintenance free and the cleaning procedure simply consists of flushing with aqueous or organic solvent. This fact might be considered as an advantage, however, adsorption or fouling processes on the electrode surface, detectable by changes in back pressure or in the electrochemical signal, cannot be detected visually or be removed by manual cleaning procedures.
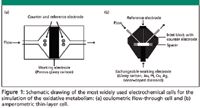
Figure 1
Amperometric cells such as the thin-layer cell in Figure 1b have a planar working electrode surface where the electrochemical conversion takes place. This surface is less affected by adsorption processes and the electrode surface can be cleaned and polished manually. In comparison to the coulometric flow-through cell, lower flow rates have to be used to achieve high conversion rates in the thin-layer cell (~10 μL/min). Therefore, these cell types can hardly be implemented on the high-pressure side of the high performance liquid chromatography (HPLC) system and up to now, this cell type has been mainly used in off-line batch experiments. This disadvantage can be overcome using an experimental set-up including a switching valve as explained below. As an additional feature, the thin-layer cell offers the implementation of different working electrode materials, which might be useful for the investigation of further applications. For example, working electrodes made out of platinum are expected to exhibit less adsorption than glassy-carbon electrodes and boron-doped diamond (BDD) electrodes are highly resistant towards chemicals and offer an enlarged range of oxidation potentials.
The electrochemical oxidation has to be optimized carefully for each application, regarding the cell type, the oxidation potential, the buffer system and the flow rate in the electrochemical cell. Nonpolar compounds tend to adsorb on the surface of the porous glassy-carbon electrode of a coulometric flow-through cell. Thus, amperometric cells with exchangeable electrode materials are more suited for these applications. The buffer solution acts on the one hand as electrolyte, on the other hand a defined pH value is of particular importance regarding the pH-dependent Pd/H2 reference electrodes. For most applications the buffer system is adjusted to a physiological pH of 7.4. The flow rate in the electrochemical cell influences the conversion rate. Lowering the flow rate increases the conversion. However, too low flow rates can promote adsorption on the electrode surface.
The best way to optimize the oxidation potential is to record a "mass voltammogram": The outlet of the EC cell is directly connected to the ionization source of the mass spectrometer. The compound of interest is pumped continuously through the EC cell, and the potential at the working electrode is ramped within the desired range. Mass spectra are then recorded in dependence upon the electrochemical potential. From the resulting three-dimensional plot, information about reasonable oxidation potentials for the EC-LC–MS set-up, as well as first insight into the nature of possible oxidation products, can be obtained. As an example, the mass voltammogram of the antimalarial agent amodiaquine (AQ) is shown in Figure 2. AQ itself has, as a protonated molecule, an m/z of 356 in the positive ion (PI) mode. An additional signal resulting from in-source fragmentation of AQ is detected at m/z = 283. From the mass voltammogram, it is obvious that AQ starts to oxidize at about 200 mV versus Pd/H2, first under formation of dehydrogenated AQ (amodiaquine quinoneimine, AQQI) and then, above 600 mV versus Pd/H2, under N-dealkylation. Thus, acquiring mass voltammograms provides insight into the oxidation behavior of the drug of interest.
Online Separation of Oxidation Products
While first achievements in coupling EC to MS were obtained without HPLC separation (8–10), the chromatographic separation has proved to be an essential part of the whole system more recently (11–13). As demonstrated in Figure 2, the mass voltammogram measured by EC-MS provides a fast overview of the generated oxidation products. However, no information about different isomers or the polarity of the oxidation products is obtained. Using an advanced set-up, consisting of EC coupled online to LC and MS, the different regioisomers, formed, for example, upon electrochemical hydroxylation of aromatic rings, can be distinguished by LC separation. Furthermore, the retention time provides valuable information on the polarity of the oxidation products and reference compounds can be used to identify oxidation products by comparing the retention times.
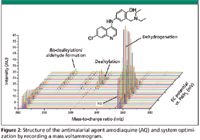
Figure 2
Two different online EC-LC–MS set-ups have been implemented for the simulation of oxidative drug metabolism. In the classic flow-through system, the EC cell is placed directly in front of the column and the analyte is injected by the autosampler of the system (Figure 3a) (11–14). After the injection, the compound of interest is oxidized in the EC cell and the oxidation mixture is separated on the HPLC column and detected by MS. However, in this case, the EC oxidation takes place under the same conditions as are used as starting parameters for the HPLC separation concerning flow rate, ionic strength, and composition and pH of the mobile phase. This is a drawback in many cases, for example, if the oxidation at physiological pH is desired, but the separation of the metabolites requires acidic conditions. Additionally, an organic solvent content of 50% or more is often needed in coulometric EC cells to prevent adsorption at the electrode surface. This high solvent concentration is in most cases not compatible with the HPLC separation of the polar analytes. Furthermore, as already discussed above, thin-layer cells cannot be implemented into this set-up as a result of the high flow rates at the high-pressure side of this system.
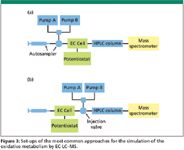
Figure 3
Therefore, an improved set-up was developed using a switching valve for the injection (1). As can be seen in Figure 3b, the compound of interest is pumped at a constant flow rate through the EC cell using a syringe pump. The effluent from the cell is discharged into an injection loop, which is mounted on a 10-port switching valve. The injection is triggered by switching the valve. The major advantage of this set-up is the decoupling of EC oxidation and HPLC separation conditions, which can be optimized independently concerning flow rate, composition of the mobile phase, and pH.
Basically, nonpolar, reversed-phase LC columns are well suited to separate the drug and the generated oxidation products. Upon reversed-phase separation, oxidation products such as hydroxylation and N-dealkylation products generally are eluted earlier than the drug itself, whereas dehydrogenation products, especially quinones, show an increased retention. C8 and C18 stationary phases are used in a number of studies, including the electrochemical metabolism simulation of the drugs amodiaquine (13) and toremifene (15) as well as for the separation of the pesticide boscalide (16) from its oxidation products. Regarding the often aromatic structure of the drug molecules, a phenyl phase can provide an enhanced selectivity compared to solely alkyl-based phases. Figure 4 shows the separation of the drug tetrazepam and its electrochemically generated metabolites using a Nucleodur Sphinx RP column with a stationary phase consisting of propylphenyl and C18 (Macherey-Nagel, Düren, Germany) (7). The EC-LC–MS measurement of tetrazepam points out the necessity of a chromatographic online separation. Besides dehydrogenation and N-dealkylation products, six different tetrazepam +O products are generated and separated in the EC-LC–MS system. The +O products correlated to a hydroxylation of tetrazepam at six different positions.
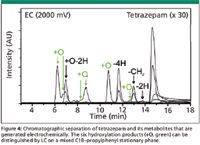
Figure 4
Aiming for the quantification of oxidative metabolites, the hyphenation of EC, LC, and inductively coupled plasma mass spectrometry (ICP-MS) has been proven to be a valuable tool (17). ICP-MS allows an element-specific quantification of drugs containing heteroatoms such as iodine. Using ICP-MS detection, an isocratic LC separation is required, which was in the case of the drug amiodarone achieved by phase-optimized LC (POPLC, Bischoff Analysentechnik, Leonberg, Germany). POPLC enables the combination of different stationary phases, so that the phase can be individually adjusted toward a separation problem. Another promising separation technique for the EC-LC–MS set-up is hydrophilic interaction chromatography (HILIC), which will be especially suited for the separation of highly polar oxidation products.
Application
General applications: During the last decade, significant work has been performed to evalute to what extent the electrochemical oxidation reactions are consistent with oxidation reactions catalyzed by enzymes of the cytochrome P450 superfamily. For these studies, numerous compounds have been examined using EC and isolated human- or rat-liver enzymes. The electrochemically generated metabolites, as well as metabolites generated upon microsomal incubation, have been analyzed by LC–MS. Further identification by fragmentation experiments has been performed for metabolites of the drugs tetrazepam, paracetamol, and clozapine. In case of metoprolol, synthetic reference materials have been used for identification. The results are summarized in Table I (7,11–13,18–22). Even though the mechanism of the enzymatic oxidation and the electrochemical oxidation is quite different, both methods show a good agreement. Besides epoxidation and alcohol/aldehyde oxidation, the typical phase-I reactions are successfully simulated in the EC cell.
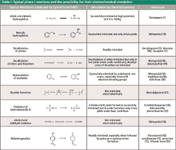
Table I: Typical phase I reactions and the possibility for their electrochemical simulation
Quantitative data regarding the conversion yield of the microsomal approach and the electrochemical simulation have been estimated for the drugs metoprolol, lidocaine, mephenytoin, and S-methylthiopurine by peak areas in the base-peak chromatograms. In the case of amiodarone, the yields of the microsomal and the electrochemical method have been determined quantitatively by EC-LC–ICP-MS. Regarding the comparison of these quantitative data, it is important to note that the conversion rate varies for each compound and cannot be given in general for a phase-I oxidation reaction. Furthermore, the electrochemical conversion depends upon the conditions, for example in terms of the flow rate or the buffer system. The conversion yield of the microsomal approach is strongly connected to the expression of different isoforms of cytochrome P450 in the organism. Thus, only a tendency towards the conversion rate for the electrochemical simulation of typical phase-I reactions can be provided.
The information presented in Table I — including the type of phase-I reactions being simulated, the conversion rate and the conditions — should be seen as a first guideline for the electrochemical simulation of the oxidative phase-I metabolism, which is still under development. Further studies that include a larger number of compounds and variations in the experimental conditions have the potential to extend the range of applications.
Reactive metabolites: While in most cases, metabolism is regarded as a detoxification process, bioactivation to reactive metabolites may sometimes occur as well. These reactive metabolites may cause severe toxic side effects because of covalent protein binding. Therefore, it is very important to have a reliable detection and identification method for reactive metabolites. However, the direct detection of reactive metabolites in biological systems — such as the commonly used microsomes or hepatocytes — is in most cases not possible because protein binding occurs immediately after formation of the reactive metabolites. Therefore, indirect detection approaches are used in which the reactive metabolites are trapped with suitable trapping agents, such as glutathione, and in which the trapped metabolites are identified. EC-LC–MS in contrast offers a good alternative to perform a direct detection of reactive metabolites (13).
As an example, a closer look into the electrochemical metabolism of the antimalarial agent amodiaquine (AQ), which was already discussed in the previous section, shall be taken. AQ is of particular interest because the drug is known for the formation of reactive metabolites. One reactive metabolite of amodiaquine is amodiaquine quinoneimine (AQQI), which is formed by dehydrogenation under cytochrome P450 catalysis. As can be seen from Figure 2, AQQI is also formed by electrochemical oxidation of AQ. Figure 5 shows an HPLC separation of AQ and its electrochemical metabolites. While in the chromatogram of the AQ standard, only one peak resulting from AQ itself is visible, electrochemical oxidation of AQ at 700 mV results in various peaks. Using the MS information, the molecular weight of the oxidation products could be assigned. AQQI, the respective deethylated AQQI-Et, and the deethylated AQ could be identified. The retention times are in good accordance with the theoretically expected retention times, because all quinoid species, being less polar than the respective hydrogenated compounds, have longer retention times than AQ itself.
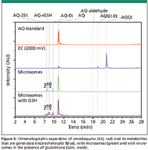
Figure 5
From the chromatogram after electrochemical oxidation, it is clearly visible that the reactive quinoid metabolites can be detected directly in EC-LC–MS experiments and that trapping with glutathione or other trapping agents is not necessary. For comparison, Figure 5 also shows the results of standard metabolism approaches using microsomes. In the microsomal incubation mixture without trapping agent, only deethylated AQ was detectable, but no reactive quinoid species with longer retention time. However, this does not mean that no quinoid species were formed upon microsomal incubation, because the same experiment in presence of glutathione as trapping agent yielded an AQ-glutathione adduct at a retention time of 9 min, which can only be formed after activation of AQ to the respective quinoid species AQQI. AQQI, however, is not directly detectable as a result of immediate binding to proteins in the microsomal incubation mixture. This example shows that direct detection of reactive metabolites in biological samples is often not possible and indirect detection after trapping has to be performed. In contrast, EC-LC–MS offers the possibility for an easy and convenient direct detection of reactive metabolites. Figure 6 summarizes the metabolic oxidation of AQ and shows the comparison between microsomal and electrochemical oxidation.
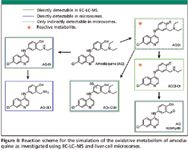
Figure 6
Other applications: Not only for the direct detection of reactive metabolites, but also for the identification of their protein adducts, EC offers interesting perspectives. As discussed in the previous section, reactive metabolites may covalently modify proteins, resulting in toxic side-effects of the drug. The identification of these covalently modified proteins in a complex biological mixture is rather laborious. As described in a recent publication using EC–LC–MS (23), drug–protein adducts can easily be generated, the binding site in the protein can be identified and the tendency of a drug to form covalent protein adducts can be evaluated.
The lack of reference standards is a drawback in the identification and quantification of drug metabolites. With respect to this issue, EC offers interesting possibilities as well: In a recently published approach, it was shown that EC is well-suited for the synthesis of a drug metabolite, which was used as reference substance in screening processes for doping-control purposes (24).
Conclusions
The online coupling of EC with LC–MS has evolved as a powerful tool for the elucidation and study of drug metabolism reactions in recent years. Oxidative metabolism reactions are simulated electrochemically and metabolites are separated with HPLC and identified with MS. Although standard in vivo and in vitro approaches, such as the use of liver microsomes, can certainly not be replaced by EC, the purely instrumental technique has found its application in several complementary issues. By the hyphenation of EC and MS, so-called mass voltammograms can be generated. The three-dimensional plots provide a very fast overview of the oxidative labile sites in a drug molecule. In contrast to standard approaches, the identification and direct detection of reactive metabolites is possible using online EC-LC–MS. Furthermore, the covalent modification of proteins by reactive metabolites can easily be studied by EC-LC–MS. Using an EC-LC system, metabolites can be eletrochemically synthesized and be isolated for further use as reference substances or for advanced structure elucidation by NMR. Therefore, the use of EC for drug-metabolism studies is an interesting supplemental instrument for drug metabolism studies.
Uwe Karst is a full professor at the University of Münster, Germany. His research interests are LC–MS, with particular focus on the simulation of oxidative metabolism reactions based upon the analysis of nonpolar analytes by means of LC–MS and speciation analysis using LC with electrospray- and ICP–MS.
Wiebke Lohmann completed her Ph.D. studies in analytical chemistry in October 2008 in the group of Uwe Karst. Her thesis was entitled "Simulation of the Oxidative Metabolism of Pharmaceuticals Using Online Electrochemistry/Liquid Chromotography/Mass Spectrometry". She is currently with Bruker Daltonik GmbH, Bremen, Germany.
Anne Baumann studied chemistry at the University of Münster from October 2003 to December 2007. She is currently a Ph.D. student in the group of Uwe Karst. The main focus of her studies is the simulation of metabolism reactions by electrochemistry hyphenated to LC separation and MS detection.
References
(1) S.J. Grossman in Drug Metabolism in Drug Design and Development, D. Zhang, M. Zhu, and W.G. Humphreys, Eds. (John Wiley & Sons, Hoboken, New Jersey, 2008), pp. 3–12.
(2) P.D. Josephy, F.P. Guengerich, and J.O. Miners, Drug Metab. Rev. 37, 575–580 (2005).
(3) W. Lohmann and U. Karst, Anal. Bioanal. Chem. 391, 79–96 (2008).
(4) E.F.A. Brandon et al., Toxicol. Appl. Pharmacol. 189, 233–246 (2003).
(5) C.N. Svendsen, Analyst 118, 123–129 (1993).
(6) S.A. Özkan, Chromatographia 66, S3–S13 (2007).
(7) A. Baumann et al., J. Chromatogr., A 1216, 3192–3198 (2009).
(8) G. Hambitzer and J. Heitbaum, Anal. Chem. 58, 1067–1070 (1989).
(9) F. Zhou and G.J. van Berkel, Anal. Chem. 67, 3643–3649 (1996).
(10) T.A. Getek et al., J. Chromatogr., A 474, 245–256 (1989).
(11) S.M. van Leeuwen et al., Anal. Bioanal. Chem. 382, 742–750 (2005).
(12) W. Lohmann and U. Karst, Anal. Bioanal. Chem. 386, 1701–1708 (2006).
(13) W. Lohmann and U. Karst, Anal. Chem. 79, 6831–6839 (2007).
(14) U. Karst, Angew. Chem. Int. Ed. 43, 2476–2478 (2004).
(15) W. Lohmann and U. Karst, Anal. Bioanal. Chem. 394, 1341–1348 (2009).
(16) W. Lohmann et al., J. Am. Soc. Mass Spectrom. 20, 138–145 (2009).
(17) W. Lohmann et al., Anal. Chem. 80, 9769–9775 (2008).
(18) T. Johansson, L. Weidolf, and U. Jurva, Rapid Commun. Mass Spectrom. 21, 2323–2331 (2007).
(19) K.G. Madsen et al., Chem. Res. Toxicol. 21, 1107–1119 (2008).
(20) S.M. van Leeuwen, H. Hayen, and U. Karst, Anal. Bioanal. Chem. 378, 917–925 (2004).
(21) B. Blankert et al., Electroanalysis 17, 1501–1510 (2005).
(22) W. Lohmann, H. Hayen, and U. Karst, Anal. Chem. 80, 9714–9719 (2008).
(23) M. Thevis et al., Eur. J. Mass Spectrom. 14, 163–170 (2008).
