Data Integrity Metrics for Chromatography
LCGC Europe
The authors discuss metrics for monitoring data integrity within a chromatography laboratory, from the regulatory requirements to practical implementation.
Mark E. Newton1 and R.D. McDowall2, 1Eli Lilly and Company, Lilly Corporate Center, Indianapolis, Indiana, USA, 2R.D. McDowall Ltd, Bromley, Kent, UK
The authors discuss metrics for monitoring data integrity within a chromatography laboratory, from the regulatory requirements to practical implementation.
Key performance indicators (KPIs) or metrics are used by many laboratories to measure the operational and quality performance of processes and the laboratory itself: If you can’t measure it, you can’t control or manage it. Metrics are also a requirement of the ISO 9001 quality standard and six sigma initiatives for continuous improvement of processes. In this instalment of “Questions of Quality”, we look at the regulatory requirements for data integrity metrics so that laboratory managers can understand how their laboratories are performing with respect to data integrity and identify where they may have potential problems. For those that don’t understand laboratory metrics, let us start with a primer.
Understanding Laboratory Metrics
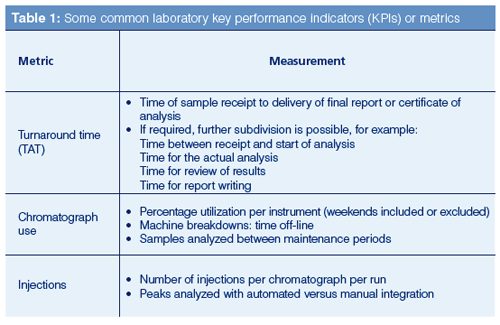
Consider a laboratory analysis, a supervisor or manager needs to know how many samples are being analyzed and how long it takes to analyze them. They need to know if there are any bottlenecks and if they have enough resources assigned for the job. Metrics can provide this information to measure a process or activity. If used correctly, metrics can help staff understand the performance measures that a laboratory is judged against. Some common laboratory metrics are shown in Table 1.
Metrics Must be Generated Automatically
A key requirement for collection of metrics is that the process must be automatic. Why is this? The simple reason is that if humans are used to collect and collate the data manually it becomes an errorâprone, tedious, and labour-intensive process, and could also be subject to falsification.
Automatic metric generation is the only way to create metrics that are timely, accurate, and repeatable. This is where suppliers of chromatography data systems and other laboratory informatics applications could help by implementing applications that generate both general and data integrity metrics automatically.
FDA Quality Metrics Guidance
The Food and Drug Administration (FDA) are also focusing on quality metrics as a way of identifying facilities that have lower risks. The Agency issued two draft guidance for industry documents on quality metrics in July 2015 and November 2016. To monitor the performance of QC laboratories, the Agency has selected outâofâspecification (OOS) results. The metric chosen was invalidated out-of-specification rate (IOOSR), which is defined as the number of OOS test results for lot release and long-term stability testing invalidated (1).
From a laboratory perspective, knowing the OOS rate is an important criterion for both quality and data integrity. One of the key questions to ask when auditing or inspecting a laboratory is the OOS results for the past six months. However, answering “we don’t have any” can result in a regulatory surprise:
Since beginning manufacturing operations in 2003, your firm has initiated a total of 0 outâofâspecification investigations for finished product FDA 483 Observation, November 2014.
As analytical procedures are subject to variation we expect to see not only OOS but also outâofâexpectation (OOE) and outâof-trend (OOT) results. There is a specific EU GMP regulation that requires trending of laboratory results:
6.9 Some kinds of data (e.g. tests results, yields, environmental controls) should be recorded in a manner permitting trend evaluation. Any out of trend or out of specification data should be addressed and subject to investigation (2).
6.16 The results obtained should be recorded. Results of parameters identified as quality attribute or as critical should be trended and checked to make sure that they are consistent with each other…… (2).
What would be an OOS rate in a regulated laboratory? If you don’t know there might be some issues during the next inspection.
Why Metrics for Data Integrity?
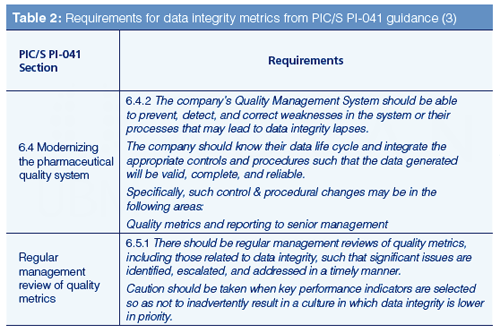
We now need to ask why data integrity metrics are important. Put simply, it is now a regulatory expectation as we can see from the PIC/S guidance PI-041 in Table 2 (3). There is an expectation that data integrity metrics of processes and systems are collected for management review. Of course, there is the implicit expectation to act if the metrics indicate an activity or trend that has the potential to compromise data integrity.
Metrics Lead Behaviour?
The second row of Table 2 states that you should be careful when selecting a KPI or metric so as not to result in a culture in which data integrity is lower in priority. Let us consider this statement further. Take the example of turnaround time (TAT) in Table 1. Imagine that the laboratory target for TAT is set for 10 days and over the past few months the target has been missed and the laboratory manager is not pleased. The sample you are starting to analyze has been in the laboratory for nine days and your analysis will take two days to perform. You will miss the TAT target unless…
This is where quality culture, management, and data integrity collide and it is where the PIC/S guidance caution about metrics comes into play-can some metrics, intended to monitor activities, become the means of inducing behaviours that compromise data integrity?
One other factor to consider here: As you monitor some actions, they will improve because they get attention, but this can be at the expense of other activities that are not being monitored. Be aware of what you do not monitor
as well, for example, measuring metrics on quality control production TAT can cause stability tests to be neglected.
Overview of Data Integrity Metrics in An Organization
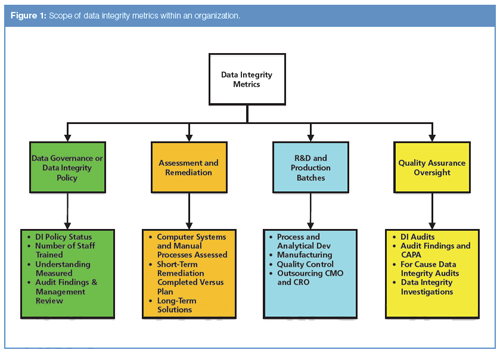
This is an evolving subject but the aim in this column is an overview of data integrity metrics that could be generated as part of a data integrity programme of work as well as for routine work. Let us look at where in an organization metrics for data integrity could be generated (Figure 1). In this column, we will not consider production manufacturing metrics. Although focused in a quality control laboratory, the same principles apply to an analytical development laboratory in R&D. The scope of data integrity metrics can cover the four main areas within an organization:
- Data governance such as data integrity policy(ies) and the associated training;
- Assessment and remediation of laboratory manual processes and computerized systems;
- Development and production activities including outsourcing of laboratory analysis;
- Quality assurance oversight.
DI Policies and Assessment and Remediation of Processes and Systems
The first two areas from Figure 1 to consider for data integrity metrics are data integrity policies and procedures and assessment and remediation of processes and systems.
Data integrity policies and procedures should include the following:
- DI policy outlining company expectations, behaviours, and culture;
- Good documentation practices SOP covering paper, hybrid and electronic processes and systems;
- Second person review SOP including audit trail and e-records review;
- Updating current procedures to include validation processes that ensure the integrity of records and detection of improper actions;
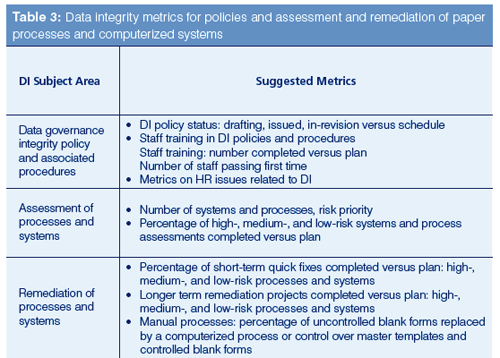
- Metrics for policies and procedures in Table 3 focus on the training and its effectiveness. This is a subject where a read and understand approach is not tenable and demonstrable evidence of understanding is required.
Assessment of processes and systems should cover the following activities:
- Assessment of new systems for integrity gaps prior to purchase;
- Identification of existing computerized systems and paper processes for assessment including access databases and spreadsheets and their listing in an inventory;
- Processes and systems are prioritized by risk and record impact;
- Assessment of systems and paper process;
- Data flow mapping to highlight generated records and their vulnerabilities;
- For each process and system there should be short- and long-term remediation plans;
- The metrics shown in Table 3 are focused on the completion of assessments for high-, medium-, and low-risk systems.
Remediation plans executed for processes and systems:
- Implementation order of both shortâ and long-term remediation should be based on inventory (total) risk;
- Short-term quick fixes to remediate critical risks to records, for example, eliminate shared user identities or restrict access to data directories to meet ALCOA+ criteria;
- Longer term remediation (for example, update the system to have a database or effective audit trail, or replace hybrid systems with electronic systems);
- Replacement of manual processes using uncontrolled blank forms with either a computerized process, or controlled master templates and blank forms with reconciliation.
Metrics for progress of short-term and long-term remediation versus plans are shown in Table 3.
Laboratory Data Integrity Metrics
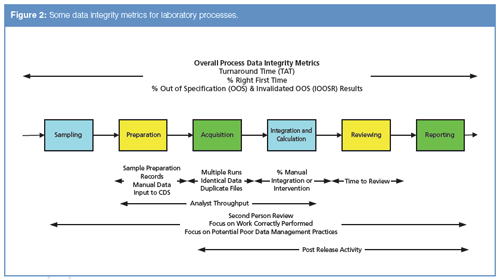
We can see some of the data integrity metrics that could be generated in Figure 2.
Preliminary Considerations:
Most data integrity reports can provide only points of concern. It is rare where 1 record = 1 data integrity breach. You must carefully select what areas will be monitored by metrics because too many can bury you in data. Start small, evaluate the data, and adjust as necessary.
Not all metrics are equal; therefore, their review should not be equal.
- It is nearly impossible to generate and analyze metrics for manual or hybrid activities. For example, you could detect missing files in a system by comparing the instrument use log (paper) against a report of sample IDs from all runs stored on a computer system. However, this approach is too tedious to be done on a regular basis and is best left for either a data integrity audit or investigation. In contrast, sample IDs in a laboratory information management system (LIMS) or electronic laboratory notebook (ELN) could be compared to the data files on laboratory data systems using an automated script. Owing to the time involved in their preparation, manual reports should be limited to specific scenarios over a specific time period (for example, detecting fraud from a single suspected individual as part of an investigation).
- There are some activities that are just difficult to catch with a report. For example, once a user changes the naming convention on repeat injections, you will probably not detect it on a routine report. And trying to catch everything that could be done is like testing every possible branch of a program. It could be done if you had infinite resources.
- Some things can’t be reported. For example, chromatographers can delete data on a balance or other simple analytical system. The data existed outside the system and so the records are gone. This is where data capture to a central informatics system can improve the situation compared with the following citation: “He said that he recalibrated the balance and prepared new documentation, and subsequently discarded the original record. Furthermore, we learned that additional original calibration records of other balances had similarly been discarded” (4).
- Metrics could also include assessment of the performance of individuals, for example, measuring the time to complete a method for several different people and looking for someone working too quickly. This is where regulatory compliance can clash with the works council-who are concerned with protecting the rights of workers- in some countries. The balance between ensuring data integrity of the organization producing and marketing pharmaceutical products needs to be balanced with the rights of individuals. However, the regulatory expectation is that processes must ensure the integrity of records generated.
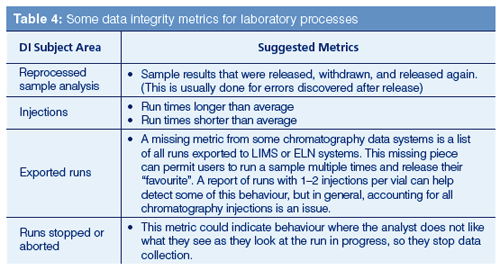
Some metrics for laboratory processes are shown in Table 4 and cover the main areas of chromatographic analysis.
Quality Assurance Data Integrity (DI) Metrics
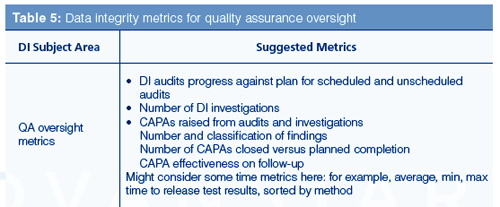
The main areas for quality assurance oversight in data integrity are DI audits and investigations and the resulting corrective and preventive actions (CAPAs) that are raised following them. Typically, there will be:
- DI audits following a schedule of both announced and unannounced visits for all processes, systems, and areas of an organization. The reason for unannounced audits is to see a better picture of work carried out although there is a risk of disrupting work;
- Data integrity investigations raised either by an audit or inspection finding or a staff concern;
- CAPAs arising from audits or investigations, close out versus planned completion, and how effective each action plan was.
Management Review of DI Metrics
Data integrity metrics need to be reviewed by management because they are responsible for the whole of the quality management system. The review should be formal with minutes kept of the meeting and action items raised and their progress monitored. This is especially true for high risk or impact systems-along with rapid implementation of short-term fixes to ensure any major data integrity gaps are remediated. Demonstrable progress is important and management activity in this area is best evidenced by actions and not words. Management review and follow-up emphasizes the importance of data integrity to the organization and ensures that process and resource bottlenecks are exposed and removed.
It’s Déjà Vu All Over Again!
For those with short memories, data integrity is the third major IT systems improvement program that has faced the pharmaceutical industry over the past 20 years, the other two being Year 2000 (Y2K) and electronic records and signatures (Part 11) assessment and remediation. Is the pharmaceutical industry going to make the same mistakes again? Let us explore this question. The Y2K program was simply replacing applications and operating systems that could handle dates past 31st December 1999. Typically, it was a case of updating, rather than process improvement, to complete the work before the deadline; this was a technical project with a fixed due date.
In contrast, a 21 CFR 11 assessment and remediation program was an opportunity to upgrade and provide substantial business benefit by changing the business process to use electronic signatures and eliminate paper. However, not many laboratories took advantage of this approach and simply replaced noncompliant with technically compliant software.
Is the industry going to repeat the Part 11 behaviour?
Reading the various guidance documents (3, 5–9), you see the storm clouds on the horizon; tight and bureaucratic control of blank forms and discouraging use of hybrid systems. The message is clear-get rid of paper or control it rigorously. The cost of electronic management is steady or declining, but the cost of using paper records is rising. Consider not just the physical storage cost but also the time to access reports and trend data-paper’s management cost is considerable and highly labour intensive. Conversion to electronic records is the only option for the pharmaceutical industry.
An alternative view for data integrity remediation is seeing it as a second chance to get Part 11 right by looking at the intent rather than the letter of the regulation. Seen in this way, industry can both align with regulators and position themselves for productivity-and data integrity-improvements in their processes.
However, many organizations complain that that this will cost money. Yes, but what is the impact on the organization’s cash flow if every batch can be released a few days earlier? Do the sums and then put in your upgraded systems project proposals.
Summary
Metrics can be used to monitor for some potential integrity issues but not all. Care should be taken to ensure that metrics do not drive behaviours that compromise data integrity. To be sustainable, accurate, and timely, collection of metrics must be automated.
It is essential that metrics enable management monitoring of data integrity because this is a key part of success for an overall data governance and data integrity programme in an organization. However, not all metrics are equal, they need to be chosen carefully. Use longâterm data integrity remediation as an opportunity to also improve productivity in laboratory processes.
References
- US Food and Drug Administration, Guidance for Industry Submission of Quality Metrics Data, Revision 1 (FDA, Rockville, Maryland, USA, 2016).
- EudraLex, Volume 4 Good Manufacturing Practice (GMP) Guidelines, Chapter 6 Quality Control (European Commission, Brussels, Belgium, 2014).
- PIC/S, PI-041 Draft Good Practices for Data Management and Integrity in Regulated GMP / GDP Environments. Pharmaceutical Inspection Convention/Pharmaceutical Inspection Co-Operation Scheme, Geneva, Switzerland (2016).
- FDA Warning Letter Sun Pharmaceuticals, (Food and Drug Administration, Rockville, Maryland, USA, 2014).
- MHRA, GMP Data Integrity Definitions and Guidance for Industry 2nd Edition. Medicines and Healthcare Products Regulatory Agency, London, UK (2015).
- US Food and Drug Administration, Draft Guidance for Industry Data Integrity and Compliance with cGMP (Silver Spring, Maryland, USA, 2016).
- WHO, Technical Report Series No.996 Annex 5 Guidance on Good Data and Records Management Practices. World Health Organization, Geneva, Switzerland (2016).
- MHRA, GxP Data Integrity Definitions and Guidance for Industry, Draft version for consultation July 2016. Medicines and Healthcare Products and Regulatory Agency, London, UK, 2016.
- EMA, Questions and Answers: Good Manufacturing Practice: Data Integrity. 2016; Available from: http://www.ema.europa.eu/ema/index.jsp?curl=pages/regulation/general/gmp_q_a.jsp&mid=WC0b01ac058006e06c#section9.
Mark E. Newton is a laboratory informatics QA representative at Eli Lilly and Company, Indianapolis, Indiana, USA. He is also a co-lead of the ISPE/GAMP Data Integrity Interest Group.
“Questions of Quality” editor Bob McDowall is Director at R.D. McDowall Ltd., Bromley, Kent, UK. He is also a member of LCGC Europe’s editorial advisory board. Direct correspondence about this column should be addressed to the editorâin-chief, Alasdair Matheson, at alasdair.matheson@ubm.com

What Goes in a CDS IT Service Level Agreement?
Published: April 7th 2025 | Updated: April 7th 2025Protecting your network chromatography data system (CDS) data is critical and a service level agreement (SLA) with your IT provider is vital. What should be included? Are SLAs for in-house IT and SaaS (software as a service) similar?


