Peak Shapes and Their Measurements: The Need and the Concept Behind Total Peak Shape Analysis
LCGC Europe
Gaussian peak shapes in chromatography are indicative of a well-behaved system. Such peak shapes are highly desirable from the perspective of column packing technology. From an analyst’s point of view, Gaussian peaks provide improved sensitivity (lower detection limits) and allow ease of quantitation. In practice, one can obtain peaks that tail, front, or concurrently front and tail for reasons such as column packing issues, chemical and kinetic effects, and suboptimal high performance liquid chromatography (HPLC) system plumbing and detector settings. Here, we discuss a number of approaches for peak shape measurement that are available in modern chromatography software, along with their advantages and drawbacks. A new “total peak shape analysis” approach is suggested that facilitates detection and quantification of concurrent fronting and tailing in peaks. Several remediation approaches are proposed that can help chromatographers analyze and improve peak shapes.
M. Farooq Wahab1, Darshan C. Patel2, and Daniel W. Armstrong1, 1University of Texas at Arlington, Texas, USA, 2AbbVie Inc., North Chicago, Illinois, USA
Gaussian peak shapes in chromatography are indicative of a well-behaved system. Such peak shapes are highly desirable from the perspective of column packing technology. From an analyst’s point of view, Gaussian peaks provide improved sensitivity (lower detection limits) and allow ease of quantitation. In practice, one can obtain peaks that tail, front, or concurrently front and tail for reasons such as column packing issues, chemical and kinetic effects, and suboptimal high performance liquid chromatography (HPLC) system plumbing and detector settings. Here, we discuss a number of approaches for peak shape measurement that are available in modern chromatography software, along with their advantages and drawbacks. A new “total peak shape analysis” approach is suggested that facilitates detection and quantification of concurrent fronting and tailing in peaks. Several remediation approaches are proposed that can help chromatographers analyze and improve peak shapes.
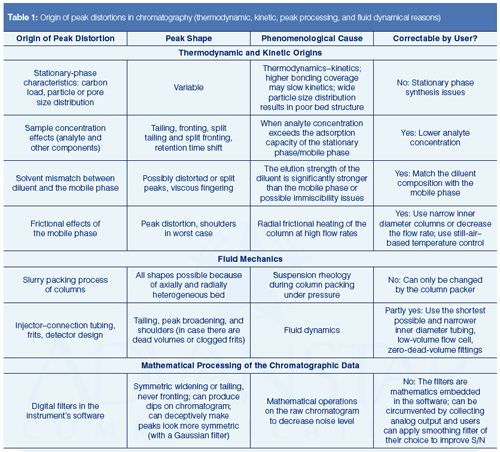
Why do separation scientists care about peak shapes so much? The analysis of peak shape is critical during the development and optimization of synthetic approaches of new stationary phases as well as the quality of packing for all stationary phases (1). To the end-user, Gaussian peaks are more amenable to integration than non-Gaussian shapes, provide higher detection sensitivity, and allow a higher number of peaks within a given run time-that is, increased peak capacity. Peak distortion may also indicate a closely eluted component. From an instrumentation designer’s perspective, obtaining a narrow dispersion of analyte peaks is an indication of a wellâbehaving instrument. Unfortunately, peak shapes encountered in practice are rarely ideal in the majority of the separation modes. The shape of the peak can be affected by factors such as the column packing, secondary interactions of the analyte with the stationary phase, the connection tubing from the injector to the detector inlet, the detector sampling rate, and the nature of the digital filter (mathematical elimination of noise) in the chromatographic software (2). These factors result in a different efficiency, retention time, and selectivity or lower overall resolution than expected for the particle size of a given support. Table 1 summarizes the origins of undesired peak shapes with their underlying causes.
How to Make an Initial Assessment of an Experimental Peak Shape
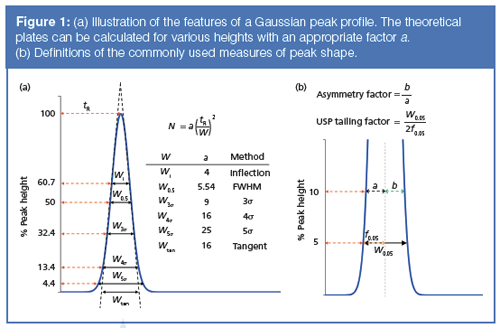
The simplest way to assess the quality of the chromatographic signal is to visually inspect the peak for mirror image symmetry and a measurement of its width W, which can be measured at a given height. These measurements allow the calculation of two chromatographic figures of merit: the theoretical plates (N) and the peak asymmetry. Like an engine’s horsepower, N indicates the “horsepower” of a chromatography column. A larger value of N indicates that the column can produce narrower peak widths and can separate more peaks in a given time window. The features of a typical peak obtained in chromatography are labelled in Figure 1 (3). Figure 1(a) shows how N can be calculated. Similarly, Figure 1(b) shows how peak shapes are measured at various heights using two popular quantities: the United States Pharmacopeia (USP) tailing factor and the asymmetry factor. If the users assume that peaks are visually Gaussian (the judgement depends on the user), the equation to calculate N is given by equation 1:

[1]
where tR is the retention time, and W is the width of a peak at given height. Because it is possible to measure W at various heights, the factor a is adjusted accordingly. Unfortunately, even for extremely high efficiency columns, perfect Gaussian peaks are rarely observed. Because we are interested in measuring the actual peak shapes, the method of moments is the most accurate measure of peak properties. It involves slightly tedious calculations, but several computer data systems (CDS) readily allow users to calculate moments as shown in Figure 2.

[2]
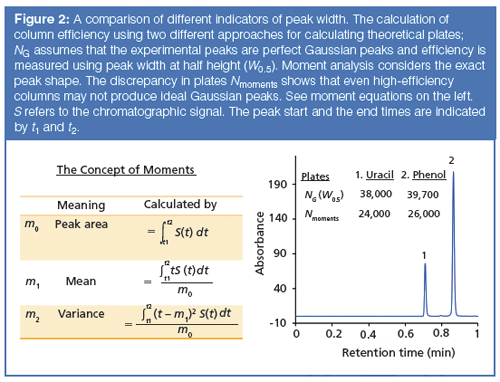
In equation 2, m1 is the centroid or centre of gravity of the peak, and m2 is the second moment or variance of distribution of the analyte in time. The definitions are provided in Figure 2. The definition of N described in equation 2 does not assume any peak shape, because the centroid and variance can be determined for any peak shape encountered in chromatography (that is, fronting, tailing, split, shouldering, horned, and so forth). The main drawback of moments is that they are very sensitive to peak start (t1) and peak end (t2), and noise in the signal S(t) (Figure 2). Secondly, moments also depend on the data sampling rate. Typically, the signal-to-noise ratio (S/N) should be 200 or above for obtaining reliable moment values (4). All the first three moments can be calculated in Microsoft Excel by estimation of the equations shown in Figure 2 (4). Slightly incorrect peak integration could lead to poor precision; therefore, the moment analysis for total shape analysis is too extensive and sensitive for routine work, despite their easy availability in modern data acquisition and analysis software.
Let us compare the width-based measurements of the two peaks obtained on a 15 × 0.46 cm, 2.7âµm dp C18 core–shell column. The manufacturer’s quality control test reports an exceptionally high plate number (39,000 per column). When tested, indeed the Gaussian efficiencies are 38,000 and 39,700 for uracil and phenol, respectively (equation 1). However, N values obtained from moment analysis are 24,000 and 26,000, respectively, as calculated by Agilent’s ChemStation software (equation 2). There is a surprising difference of more than 10,000 plates, proving the point that even the most efficient columns today do not produce pure Gaussian peaks. If the peaks were perfectly Gaussian, the plate numbers from equations 1 and 2 would match. Chromatographers are used to looking at large numbers for efficiency; most column manufacturers use the simplified calculation of efficiency since the method of moments often results in very low values that do not reflect favourably on a column’s performance. The efficiency only carries the information about the width of a peak, and nothing about the nature of its entire shape.
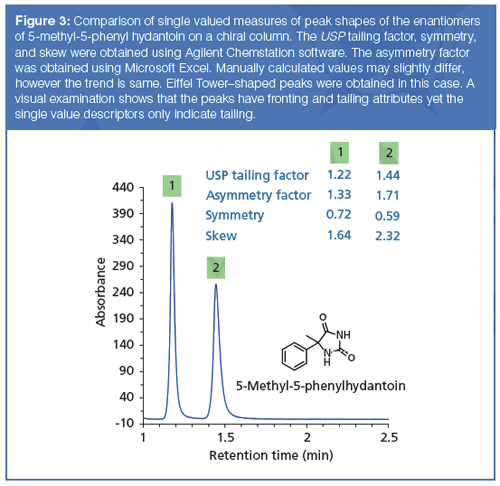
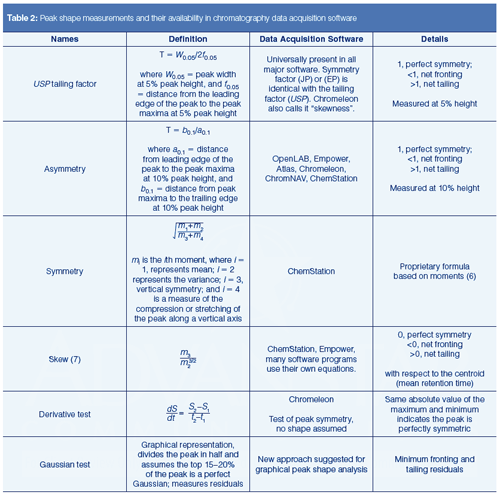
With chiral separations, even when the peaks may have very high efficiency, the peaks are often asymmetric. In the unusual case of β-blockers or compounds such as hydantoins on chiral columns, the peaks have a slight ascending fronting as well as a tailing. Both of these shapes can originate because of column packing or kinetic band broadening effects, or both. We have aptly named such peaks Eiffel Tower peaks because the top is mostly very narrow, yet the ascent and the descent are rather bent like the Eiffel Tower (Figure 3) (5). The Gaussian efficiencies of peaks 1 and 2 in Figure 3 are 10,000 and 6400, respectively; however, keep in mind that these peaks are not even visually Gaussian. The plates are vastly overestimated and the efficiency by moments tells us the actual efficiencies are 3300 and 1800 for peaks 1 and 2, respectively. These points again show that we need to come up with an improved measure to assess peak shapes. There are several ways to measure peak asymmetry, many of which are included in chromatography data acquisition software for reporting. The definitions of various peak shape measurements are shown in Table 2. Figure 3 shows that USP tailing factor of peak 1 is 1.22, the asymmetry factor is 1.33, the symmetry is 1.72, and the moment-based measure called skew is 1.64. All of these numbers tell us that the peaks are tailing in a net fashion. These methods assign a unique number to a given peak, an approach that may not present the full picture. Indeed, they only indicate the contributions to the asymmetry that are in excess. A careful examination of the chromatographic peaks in Figure 3 reveals that tailing is coupled with fronting, which is rarely detected and never quantified. The USP tailing (T) is the most common measurement and is required by the U.S. Food and Drug Administration (FDA). The FDA recommends a tailing factor of ≤2. A peak shape T of ~2 is visually very asymmetric and deformed.
The Concept of Total Peak Shape Analysis
How can we detect peak deformations throughout the entire peak rather than rely on a single value? Such an analysis for the whole of the peak is beneficial in troubleshooting the peak shape problems highlighted in Table 1. We developed two simple tests to study complete peak shapes graphically (5). Both methods are intuitive and can be used with Microsoft Excel. The first one is the derivative test and the second one is the Gaussian test.
The Derivative Test: Taking the derivative with respect to time of a given peak is the most straightforward approach to assess total symmetry and peak shapes. If S is the chromatographic signal, then the derivative is

[3]
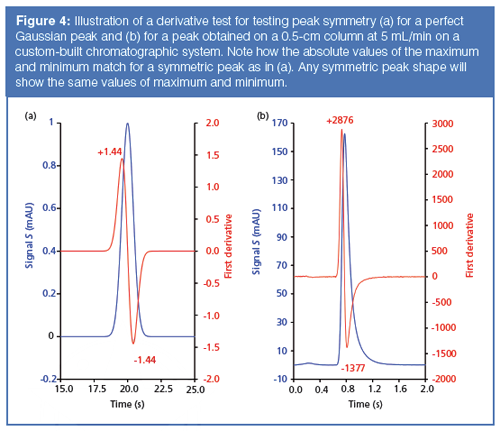
Equation 3 merely states that we find the difference between two consecutive signal values (S2 and S1) and divide it by the sampling interval. Like moment analysis, this peak shape test does not preassume any peak model. Thus any peak shape can be analyzed. The sampling interval can be determined as follows: If the data are sampled at 160 Hz (160 data points per second), the sampling interval is 1/160 s or 1/(60×160) min. The only requirements of the derivative test is to ensure a high sampling rate (80 Hz and above), to have low response time settings (< 0.1 s), and a high signalâtoânoise ratio. When time and the derivative are plotted on the same axis as the original chromatogram, the derivative intersects the x-axis at the same position as the maximum of the original peak (Figure 4). Figure 4(a) shows how the derivative of a pure Gaussian peak (ideal chromatography) would look. The maximum and minimum values are identical, which would be true for any symmetric peak. If a peak has a very slight tail as in Figure 4(b), then the left maximum has a larger absolute value than the right minimum. This tailing is coming from a very short column (0.5 cm × 0.46 cm). As indicated in Table 1, the tailing is originating from the column packing as well as from extracolumn effects. If there is concurrent fronting or tailing, then the absolute values will depend on which half of the peak is dominating, as we will show later. The gist of the derivative test is that if the absolute values of the maxima and minima of the first derivative of a peak do not match, the slope of the leading edge of the peak differs from the slope of the trailing edge and reveals the presence of asymmetry. For the derivative test, the excess magnitude of the positive end indicates tailing and the excess magnitude of the negative end suggests a fronting element to the peak. The derivative test is a very sensitive test to detect the peak asymmetry, and it does not rely on the user to choose peak start and end time, which makes it independent of integration errors.
The Gaussian Test: The Gaussian test is a graphical and quantitative approach for analyzing the total peak shape and its departure from an ideal Gaussian shape. It concurrently determines the extent of a peak’s deviation from a perfect Gaussian form on the leading and the trailing edge and allows detection and quantitation of fronting and tailing peaks. As discussed earlier, Table 2 compares what measurement methods are available in chromatographic software for analyzing experimental peaks. Ideal chromatography peaks typically follow the Gaussian peak profile G(t) and amplitude A can be modelled using equation 4:

[4]
The standard deviation or σ of a peak can be obtained at any peak height using equation 5:

[5]
If we know the experimental standard deviation and retention time, we can construct a complete Gaussian peak using equation 4. This method makes the critical assumption that even in the most distorted peaks, the upper regions of a peak (80% peak height or above) follow the Gaussian peak shape; the peak shape analysis is approached from the top in this method. The idea behind the Gaussian test is as follows:
- Normalize the experimental peak height to unity. This process simplifies the visualization and calculations.
- The top section of most chromatographic peaks is almost an ideal Gaussian shape-for example, the >80% height (Figure 1). To confirm this hypothesis, the standard deviation should be extracted at other heights (for example, 85%, 90%). The σ values should closely match.
- Extract the standard deviation of the experimental peak at a given height (>80% peak height) from equation 5, and determine the peak maximum (that is, the retention time).
- Plot a pure Gaussian peak, using equation 4 with the retention time and standard deviation extracted from the experimental peak. Graphically, superimpose the ideal peak on a real peak.
- Find the differences at each point of the pure Gaussian peak and the experimental peak. These values are called residuals. Plot the residuals on the same graph against retention time. The residuals show both if the peak fronts or if there is a shoulder, or if the peaks tail and how much they tail.
- Express the percentage of fronting residual and tailing residual as the fraction of the sum of all residuals.
Herein we assume that S/N is high, and the baseline is not drifting. We wish to emphasize here that this test is not simply a curve-fitting procedure, where the only goal is to minimize the residuals by the method of least squares. Although we fit the curve on the experimental peak, mathematical constraints are placed in this process (see steps 2 and 3). To make the technique easily accessible, a useful Excel template with prefilled formulas is available (5) that ultimately automates the derivative and the Gaussian test. In the Excel file, the user simply pastes the retention time as well as a chromatographic signal (absorbance, fluorescence, refractive index, and so forth) and allows Excel to perform the rest of the calculations.
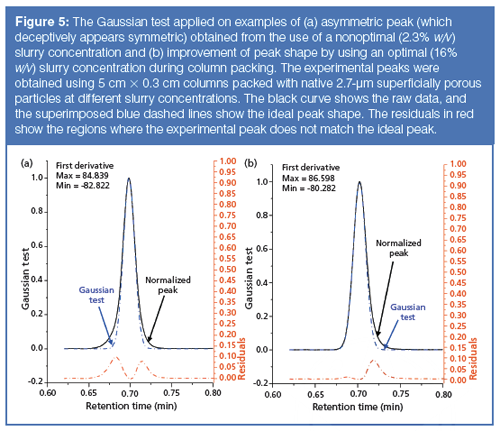
Figure 5 provides examples where we show the utility of this Gaussian test. During initial column packing experiments, a core–shell material was producing peak shapes that were seemingly Gaussian, but only deceptively symmetric. The column efficiency was acceptable (for a 5-cm, 2.7-µm column, ~8000–9000 plates). The USP tailing factor was 0.93 (Figure 5[a]), which can indicate a relatively symmetric peak shape with a net fronting; however, a visual examination showed that there is coupled fronting and tailing, which had to be eliminated experimentally by optimizing the packing conditions. Modern columns are packed as a slurry of particulates suspended in an appropriate solvent. The concentration of the slurry and the nature of the solvent affects the peak shape of the packed column. In Figure 5(a), the Gaussian test (steps 1 to 5) was performed on this initial packing condition with a low slurry concentration; the derivative test confirms the presence of peak distortion (maximum = 84.839 and minimum = −82.822). Only the full peak shape analysis identifies the problematic regions of the entire peak. The presence of residuals shows significant areas of fronting plus tailing elements despite an indication from the USP tailing factor that the peak only fronts. The contribution to peak distortion is 58% from fronting and 42% from tailing. In another set of conditions, the slurry concentration was increased for optimization. As shown in Figure 5(b), the fronting element has become negligible and the left side of the peak has nearly a perfect Gaussian character. The value of the derivative still detects asymmetry (maximum = 86.598, minimum = –80.282). The peak shape distortion from the Gaussian tests shows 10% contribution from fronting and 90% from tailing. Although a visual inspection may lead users to assume that the original peak shown in Figure 5(a) is desirable over the optimized condition shown in Figure 5(b) based on the USP tailing factor, the Gaussian test disproves this assumption by showing the problematic regions of the peak with concurrent fronting and tailing.
Indeed, where resolution from a closely eluted impurity or a low-level analyte eluted before the main peak is of concern, the peak shape shown in Figure 5(a) may conceal the smaller impurity despite its seemingly more symmetric peak shape. In such a case, despite a larger USP tailing factor, the peak shape shown in Figure 5(b) would be desired because it may facilitate improved resolution of the impurity; the main peak has practically no fronting. Note that since uracil is an early eluted analyte on a narrow-bore column, the persistent presence of tailing has its origins in extracolumn connections plus a nonoptimized slurry solvent.
Conclusions
An ideal Gaussian peak shows that the system (column and the instrument) are well-behaved. When a peak is asymmetric, single-valued descriptors of peak shapes such as USP tailing, asymmetry factor, symmetry, and skew can be inadequate because they do not give a complete picture of the overall peak shape. Researchers engaged in instrument design and stationaryâphase development need to analyze peak shapes during synthesis and column packing. The derivative test is based on the concept that if a peak is symmetric, their inflection points will be mirror images. The Gaussian test superimposes a Gaussian model on a normalized peak with its set of constraints and shows the problematic regions of the peak. The standard deviation is extracted from the upper section (>80% height) of the peak rather than the conventional half-height approach. This total peak shape analysis approach can uncover the concurrent fronting and tailing in peaks. The origin, underlying phenomenological cause, and possible remedies are highlighted.
References
- M.F. Wahab, D.C. Patel, R.M. Wimalasinghe, and D.W. Armstrong, Anal. Chem.89, 8177–8191 (2017).
- M.F. Wahab, P.K. Dasgupta, A.F. Kadjo, and D.W. Armstrong, Anal. Chim. Acta 907, 31–44 (2016).
- B.A. Bidlingmeyer and F.V. Warren, Anal. Chem.56, 1583A–1596A (1984).
- P.G. Stevenson, H. Gao, F. Gritti, and G. Guiochon, J. Sep. Sci.36, 279–287 (2013).
- M.F. Wahab, D.C. Patel, and D.W. Armstrong, J. Chromatogr. A1509, 163–170 (2017).
- Agilent Technologies, “Evaluating System Suitability CE, GC, LC and A/D ChemStation” Revisions: A.03.0x- A.08.0x.
- E. Grushka, J. Phys. Chem.76, 2586–2593 (1972).
M. Farooq Wahab is currently a research engineering scientist at the University of Texas at Arlington (Texas, USA). He received a postdoctoral fellowship with Professor Armstrong after completing his Ph.D. at the University of Alberta. His research interests include fundamentals of separation science, ultrahigh-efficiency phases, hydrophilic interaction chromatography, supercritical fluid chromatography, data processing, and subsecond separations in LC. For Excel template and correspondence contact: mwahab@ualberta.ca
Darshan C. Patel received his Ph.D. from the University of Texas at Arlington, where he developed new technologies for ultrahigh-throughput LC under the direction of Dr. Armstrong. In his current role, as a senior scientist at AbbVie Inc., in Process Research and Development, he focuses on the development of process analytical technologies for in-process sampling and automation.
Daniel W. Armstrong is the Welch Distinguished Professor of Chemistry at the University of Texas at Arlington. Professor Armstrong has received more than 30 national and international research and teaching awards. His current interest involves chiral recognition, macrocycle chemistry, synthesis and use of ionic liquids, separation science, and mass spectrometry. He has more than 600 publications, one book, and 30 patents. For correspondence and a copy of the Excel template email sec4dwa@uta.edu
David S. Bell is a manager in Separations Technology and Workflow Development at MilliporeSigma (formerly Sigma-Aldrich/Supelco). With a B.S. degree from SUNY Plattsburgh (New York, USA) and a Ph.D. in analytical chemistry from The Pennsylvania State University (Pennsylvania, USA), Dave spent the first decade of his career within the pharmaceutical industry performing analytical method development using various forms of chromatography and electrophoresis. During the past 20 years, working directly in the chromatography industry, Dave has focused his efforts on the design, development, and application of stationary phases for use in HPLC and hyphenated techniques. In his current role at MilliporeSigma, Dr. Bell’s main focus has been to research, publish, and present on the topic of molecular interactions that contribute to retention and selectivity in an array of chromatographic processes. Direct correspondence to: LCGCedit@ubm.com

Polysorbate Quantification and Degradation Analysis via LC and Charged Aerosol Detection
April 9th 2025Scientists from ThermoFisher Scientific published a review article in the Journal of Chromatography A that provided an overview of HPLC analysis using charged aerosol detection can help with polysorbate quantification.
Analyzing Vitamin K1 Levels in Vegetables Eaten by Warfarin Patients Using HPLC UV–vis
April 9th 2025Research conducted by the Universitas Padjadjaran (Sumedang, Indonesia) focused on the measurement of vitamin K1 in various vegetables (specifically lettuce, cabbage, napa cabbage, and spinach) that were ingested by patients using warfarin. High performance liquid chromatography (HPLC) equipped with an ultraviolet detector set at 245 nm was used as the analytical technique.
Removing Double-Stranded RNA Impurities Using Chromatography
April 8th 2025Researchers from Agency for Science, Technology and Research in Singapore recently published a review article exploring how chromatography can be used to remove double-stranded RNA impurities during mRNA therapeutics production.


