Current Trends in HPLC Column Usage
LCGC North America
In early 2007, a web-based HPLC columns survey was conducted. Current usage was compared to a 1997 survey.
In early 2007, a web-based HPLC columns survey was conducted. Current usage was compared to a 1997 survey. Some interesting trends were observed. Although reversed-phase chromatography maintained its dominance, techniques that grew in importance were chiral, HILIC, and biochromatography applications. Smaller 3.0-mm particles have gained in popularity while sub-2-mm columns are now getting attention. Column life has increased with guard columns being a major factor. Column buying trends were analyzed: average number of columns used per instrument per year remained at 5; price increases have stayed at the rate of inflation; a major shift in purchasing columns from general laboratory distributors. Column-to-column reproducibility is still the top factor in buying decisions. Future column interests include hybrids, sub-2-mm, and ultrahigh-pressure columns
Occasionally, LCGC surveys its readers to obtain a current profile of users of high performance liquid chromatography (HPLC). The last general survey on HPLC columns was conducted was in 1997 (1). In the past, I have used results from these surveys to chart trends in column technology and the practice of HPLC. In early 2007, a web-based survey was conducted and 221 respondents answered a series of questions on their mode and column usage. Although the number of respondents was reduced from earlier surveys (2–7), the number of respondents was statistically sufficient to allow comparisons to previous survey data.

Ronald E. Majors
To ensure that the results of the current survey were compatible with those of previous surveys, I used the same methodology to report the results. Because many of the questions allowed respondents to give more that one answer, in some cases, I normalized response totals. Normalizing the results to a base of 100% makes it easier to compare the results of previous surveys with those of the present survey and to identify trends in the use of HPLC columns, modes, and packings. Questions pertaining to mode usage, column life, particle sizes, purchasing considerations, and possible future needs were explored to understand selection criteria.
Instrumentation Used
To understand the current usage rate of instruments, a question was asked pertaining to the number and type of instruments used per respondent. Table I shows that the average response for each category of instrument. The numbers reported should not be construed that every respondent uses every type of instrument but serves to provide an idea of the relative number of the various types of systems in use. Later, I will look at the numbers of columns used by these instruments.

Table I: Types of HPLC instruments used by survey respondents
According to the survey results, a conventional HPLC instrument user is responsible for an average of 2.9 instruments. This number was derived from looking at the total number of instruments of the type identified by all respondents and then dividing this number of the total number of respondents. For example, some respondents reported that they have only one conventional HPLC system while others reported that they have four instruments for which they are responsible. Based upon the relative numbers of Table I for every one of these respondents that uses a conventional LC system, only 1 in 11 would possess a capillary or nanoLC system, 1 in 5 might have an instrument capable of working with microbore columns and 1 in 7 could have a preparative instrument in his or her laboratory.
Mode and Phase Usage
Most liquid chromatographers use more than one chromatographic mode to solve specific separation problems. The total number of techniques used by respondents relative to the number of respondents revealed that each used 2.5 modes on the average, slightly less than the results from the last survey (1). The normalized data in Table II compares the relative mode usage in 1997 and 2007. No surprise that the results again show that reversed-phase chromatography was the most popular mode; according to the raw data, over 92% of respondents use this mode with normal bonded phases a distant second.
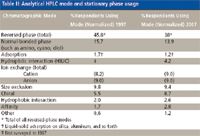
Table II: Analytical HPLC mode and stationary phase usage
Although the data in Table II shows that reversed-phase chromatography has dropped on a relative basis, this drop is not due to the decrease in popularity of this mode but rather from the increased use of other modes such as chiral chromatography, hydrophilic interaction chromatography (HILIC) and those modes popular for biomolecules (such as ion exchange, hydrophobic interaction and affinity chromatography). In fact, in 1997, HILIC did not even make the charts as it was relegated to a few peptide applications. HILIC is a separation technique for highly polar analytes that gets around some of the problems associated with reversed-phase chromatography such as low retention or phase collapse (dewetting). HILIC uses a polar stationary phase such as bare silica gel or polar bonded phase (for example, diol) and requires a high percentage of a nonpolar mobile phase, similar to the requirements for normal phase chromatography. However, unlike normal phase, which uses nonpolar solvents like hexane and methylene chloride and tries to exclude water from the mobile phase, HILIC requires some water in the mobile phase to maintain a stagnant enriched water layer on the packing surface into which analytes might selectively partition. In addition, water-miscible organic solvents are used. Under HILIC, polar analytes are well retained and are eluted in order of increasing hydrophilicity.
With regulatory bodies requiring evidence of enantiomeric purity, it is no surprise that use of chiral chromatography has increased by 60% in the last decade. Newer chiral columns appear to be more universal and some can be used in both the reversed-phase and polar organic modes. Supercritical fluid chromatography (SFC) also has seen renewed interest, especially for preparative separations. Columns applied to SFC are similar to those used in HPLC.
The use of normal bonded phases continues to see widespread application. This mode is favored over adsorption chromatography for the separation of geometric and positional isomers and cis–trans compounds and other separations using organic mobile phases where reversed-phase chromatography does not do a good job. The phases used in this mode such as diol, amino, and especially cyano are sometimes used with aqueous solvents. The survey did not solicit information about the uses of these stationary phases in aqueous versus organic mobile phases.
The use of ion-exchange chromatography showed a slight upward swing in usage and is back to its historical levels of the mid-to-late 1980s (1). Included in this usage is ion chromatography that is sometimes treated as a separate separation technique but in reality is ion-exchange chromatography because it employs the same separation principles and uses columns with ionic or ionizable functionalities. The increasing popularity of ion exchange can be somewhat attributed to the strong interest in proteomics where large number of tryptic peptides are fractionated by ion exchange before reversed-phase chromatography–MS separation and detection. Although ion-pair chromatography also separates ionic and ionizable compounds, it is generally lumped with reversed-phase chromatography because it employs the same packing materials. Many chromatographers familiar with reversed-phase chromatography prefer to use ion-pair chromatography for ionic and ionizable compounds because the columns are more familiar to them and the principles of reversed-phase chromatography can be generally applied in method development.
The data in Table III breaks the reversed phases into individual organic moieties and clearly shows that C18 (octadecylsilane) was most popular (the raw data showed that 92% of all users use this phase at some time) followed by C8 (octylsilane). The use of phenyl bonded phase has increased as users exploit its unique selectivity compared to alkyl phases. In recent years, the introduction of alkyl chains greater than C18, up to C30, has occurred. These long chain phases provide a greater degree of shape selectivity than a typical C18, have long proven superior for the separation of cis–trans carotenoid isomers, are resistant to phase collapse at low percentage of organic solvent in the mobile phase and have high loadability.

Table III: Stationary phases used in reversed-phase chromatography
In the current survey, the use of polymeric packings was examined. Only 13% of the respondents indicated that they were using polymeric columns for their HPLC work, down from 17% in 1997 (1). This is somewhat surprising because polymeric packings have improved and current column efficiencies have narrowed the gap compared to silica-based packings of the same particle size. Of those using polymeric columns, the mode breakdown is reversed phase (77%), ion exchange–ion chromatography (47%), and size-exclusion chromatography (50%), equally split between nonaqueous (gel permeation) and aqueous (gel filtration). The most popular non–size exclusion applications for polymeric columns are high pH (where traditional silica gel–based columns have solubilization problems), organic acids, proteins–peptides, inorganic ions, carbohydrates, and amino acids.
An open-ended question pertaining to the use of chiral columns in analytical HPLC revealed that columns based upon polysaccharide chemistry dominate the applications but macrocyclic antibiotic, protein-based (for example, α-glycoprotein), and Pirkle-type columns do command attention in certain application areas.
Particle Sizes in Analytical and Preparative LC
Since the beginning of HPLC in the early 1970s, the trend has been to use columns packed with smaller spherical particles. Although irregular microparticulate particles were the first to be introduced (8), they quickly gave way to spherical particles that could be packed more reproducibly, gave slightly lower pressure drop, and provided column efficiency needed at the time. For cost reasons, irregular particles are still sometimes employed in preparative chromatography but advantages of the spherical particles when reclaiming packing from packed beds is evident.
In the 1970s, 10-μm irregular particles were the norm because they were available commercially and with slurry packing column efficiency was quite good. However, studies had shown (9) that smaller particles gave better performance due to improved mass transfer but these smaller particles were not freely available until the early 1980s. Through occasional LCGC column surveys, I started tracking the use of particle sizes in the mid-1980s. Table IV provides data of the use of various particle sizes from 1985 until 2007 (current survey). By 1985, columns packed with 10-μm particles were already giving way to 5-μm particles that maintained their dominance through the 1990s and are still in widespread use today. There are many validated methods that have been developed on 5-μm particles and users do not want to take the time to revalidate their method unless there is a strong driving force to do so. Also, for many applications, a 25-cm column provides a sufficient number of theoretical plates to provide adequate resolution. The use of even smaller particles (3–4 μm) began in earnest in the mid-1990s and now, as indicated in Table IV, these particles have become widely used. With the reduction in particle size, column efficiency improved further allowing a reduction in column length. Shorter columns are now in vogue. Not only does a shorter column provide faster separations but also solvent use is reduced. Recently, the use of sub-2-μm particles has become fashionable in even shorter column lengths (10). Columns of 20–50 mm in length now provide plate counts formerly obtained on 15- and 25-cm columns packed with larger particles. In the next survey, it will be interesting to see if the trend on the increased use of small particles continues.

Table IV: Analytical HPLC particle size trends 1985â2007*
In comparing the use of preparative chromatography to analytical HPLC, about 1 in 4 respondents who do analytical work also use preparative chromatography. Not surprisingly, those that perform preparative separations tend to prefer larger particles as depicted in Table V. Some of the reasons for the preference of larger particles is cost, pressure drop at high flow rates and loadability. For the latter consideration, the higher efficiency of smaller particles can be lost when overloaded conditions are employed.
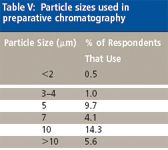
Table V: Particle sizes used in preparative chromatography
Column Purchase Patterns
Several questions in the survey related to the purchase and cost of analytical HPLC columns on a per-instrument basis. Most of the respondents purchase prepacked columns but a few purchase empty columns and bulk packings presumably to pack their own; still, a majority of respondents have no budget for empty or bulk packings. Another question later in the survey revealed that only 0.5% pack their own columns. After prepacked columns, the largest expenditure is for guard columns. One question was asked on how their budgets are allocated among prepacked columns, empty columns, column packings, and guard columns. The averages of all responses were 59%, 5.3%, 9.3%, and 26%, respectively, not that much different than 10 years ago (1). Based upon the question, about 73% of the chromatographers using prepacked columns also purchase guard columns.
The average annual purchase budget for prepacked analytical HPLC columns per instrument was approximately $2950, about 30% higher than the survey results of 10 years ago (1). Based upon a unit cost of $400, this amount would be equivalent to just over seven columns a year per instrument. Guard column budgets were about $1300 per year per instrument. For the average cost of a guard column of $80, this would amount to approximately 16 guard columns per year, not an unreasonable number. Again, this expenditure was just less than 30% higher than the 1997 survey (1). Guard columns extend the life of analytical columns; therefore, without these expenditures, users would have to allocate a higher percentage of their budget for prepacked columns.
Another question broke down the purchases of different dimensions of LC columns. Users were asked about their yearly purchases of conventional analytical columns (3.0–4.6 mm i.d.), microbore columns (2.0 mm i.d.), narrowbore columns (1.0 mm), and capillary columns (less than 1-mm i.d.). Table VI shows the column units used based upon a weighted average. For conventional HPLC column users (3.0–4.6 mm i.d.), an average of five columns per instrument per year are used. Even though the previous results showed that the respondents purchased seven columns per instrument per year, this number was based upon an average cost of $400 per column. Some columns such as chiral columns and size exclusion columns might cost double or triple that number so it is not surprising that there was a slight discrepancy in the purchase versus use numbers. In Table VI, other column types also are shown. The short, fast LC category could just as well fall into the conventional analytical sizes because many of these popular columns have 4.6-mm internal diameters. One would expect narrow bore and capillary columns to have lower usage based upon the smaller number of available instruments that accommodate these smaller internal diameter columns (see Table I).

Table VI: Types of analytical columns used by espondents
A question asked if the average price of an HPLC column had changed in the last three years and 58% of the respondents felt that column prices had stayed the same while 35% felt that prices had increased. The average perceived price increase for the latter group was 60% or about 16% a year increase. In reality, judging from the column budgets discussed previously, the increase in column prices per year over a 10-year window was less than 3% per year. Only 4% felt that column prices had decreased in the last three years.
One of the questions asked chromatographers from which source they prefer to purchase prepacked HPLC columns. According to the survey, Table VII shows that, compared with 1997 (1), the chromatography supply houses maintained their lead but their market share dropped since 1997. The biggest growth was for the general laboratory suppliers; in 1994 (7) they were a mere 7% of the market growing to 11.3% in 1997 (1). This year 30% of the users surveyed purchase their columns from this source. General laboratory distributors usually provide less technical assistance that the dedicated chromatography suppliers or instrument manufacturers but they promote themselves as one-stop shopping where users can get solvents, chemicals, laboratory glassware as well as HPLC columns. The general laboratory distributors sometimes provide additional services such as electronic ordering, local stocking, volume discounts, and on-site services. According to the present survey, the biggest decrease in column purchases was from the independent column manufacturers who saw a substantial drop in the share of the HPLC columns' market.

Table VII: Sources for HPLC column procurement
Table VIII lists the factors that respondents considered important when purchasing an HPLC column. Respondents were asked to name their top three factors that influenced their buying decision. The most important factor — ranked the same in earlier surveys — is column-to-column reproducibility. Nobody wants to develop a method only to find out that the column that they purchase later for the same application does not perform in the same manner. However, column reproducibility has definitely improved over the years driven by competitive pressure, quality initiatives such as ISO and 6-Sigma, and a better understanding of the manufacturing processes. The next three top factors were the same as in the 1997 survey (1) but their relative importance has changed. For example, column life has increased in its relative importance. Nowadays, users expect more injections per column than they did a decade ago and column life affects their buying decision. (Note: we will explore this factor in more detail in the next section). This year I included tailing factor which seems to be quite important in the pharmaceutical laboratory that deals with basic drugs that have a tendency to tail on some silica-based bonded phase columns.
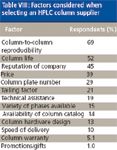
Table VIII: Factors considered when selecting an HPLC column supplier
Column Life
As mentioned earlier, column life is an important selection and operating parameter in HPLC. This survey specifically explored column life from two standpoints — lifetime in months and by the number of injections. Although some of the modern liquid chromatographs do track the number of injections, most chromatographers do not. Usually, one will install an HPLC column and keep it in the instrument performing one or more methods until the column shows a loss of resolution or shows significant tailing that might affect quantitation. They can track the months of usage in a logbook.

Table IX: Average analytical column lifetime
As can be observed in Table IX, since the earliest days column life continually has increased through the years. I first began asking about life in column surveys in 1984 and for a majority of respondents, columns lasted less than three months. Now only 15% of respondents have lifetimes of less than three months. If one looks carefully at the data of Table IX, nearly 20% of the respondents now experience lifetimes of at least a year and over 30% have columns that last over a year, higher than data reported in the 90s. About 20% of the users do not track column life at all.

Table X: Normalized percentage of respondents who reported on column life by the number of sample injections for analytical columns
When the question was asked about column life based upon the number of injections, a larger number (31%) of the respondents reported that they do not track their injections. Table X shows the normalized data of those who do monitor column life based upon the number of injections. Compared to Table IX, the results are not as clear in terms of the 1997 data and the 2007 data. Clearly, a significant larger number of respondents (37%) in 2007 indicated that they can achieve more than 1000 injections compared with 1997. However, some of the other levels of injection tracking have shown a decrease in the number of injections in the more recent study. When looking at those achieving 500 or more injections, there was a definite increase in the 2007 study.

Table XI: Number of sample injections before replacing guard column
Although the data is not shown, a large percentage of preparative column users do not track column life nor the number of total samples injected before discarding a column. Intuitively, one would think that preparative columns would have shorter lives because they tend to be used for dirty samples, at high flow rates, and higher sample loads than analytical columns. Surprisingly, respondents who use preparative columns reported that nearly 50% of them last longer than a year, similar to the results reported in 1997 (1). This greater life perhaps indicates that preparative columns are used less frequently than analytical columns and therefore tend to be stored and used at a later date when needed for preparative applications. Another possibility for longer lives would be that preparative columns are substantially more expensive than analytical columns and users might take better care of them. A third possibility is that the larger particles used in prep do not generate as high a backpressure as obtained with the smaller particle analytical columns. Higher backpressure tends to limit the column life because more stress is placed on the column materials.
Reducing Column Costs
Everybody is interested in reducing the operating costs in their laboratories. Approaches to reducing the costs of columns, supplies, solvents and other chemicals are of increasing importance for everyone from bench chemists to laboratory managers to purchasing agents. As was mentioned earlier, column lives have increased over the years. This life increase should imply that fewer columns need to be purchased per year. The increased life of columns is due to a number of factors: better manufacturing procedures; a better understanding of users on the limitations of bonded phase silica columns; newer bonded phases that withstand low and high pH; newer types of higher stability phases such as zirconia, silica–organic hybrids; and increased use of guard columns and in-line filters.
The use of guard columns has helped to decrease the cost of replacing the more expensive analytical columns. A question was asked about the frequency of change of guard columns. For those that use guard columns (73% of respondents), Table XI shows the results of the guard column usage survey with comparative data from 1997 (1). From the data, the number of respondents using guard column has increased since the 1997 survey. In addition, it can be deduced that guard columns are also lasting longer than a decade ago. For example, the percentage of respondents who get more than 250 injections from guard columns increased by 75%. Undoubtedly, the end result is an increase in the life of the analytical column also.
The use of polymeric columns is another potential savings. Polymeric columns have a wide range of pH stability (see earlier comments) and are especially useful at high pH values where traditional silica gel bonded columns have stability problems. Even so, there has been a slight decrease in the use of polymeric columns in this present study. Newer bidentate silica and hybrid silica–organic columns have allowed higher pH operation and might have taken some market share away in the reversed-phase mode.
Future Column Interests
The survey asked a question regarding future column interests. Table XII indicates that there is considerable interest in the newer hybrid columns that consist of both inorganic and organic character. These columns have the structural rigidity of the inorganic portion and the chemical stability of the organic portion. The sub-2-μm columns have struck the fancy of those who wish to decrease their analysis times by shortening the column length and to those who want to have greater plate count by using longer columns, albeit at the higher pressure. The third most popular topic for future consideration are those that will withstand higher pressures exceeding 1000 bar (~15,000 psi). Presumably, if the decrease in particle sizes for analytical separations continues such columns will become mainstream.
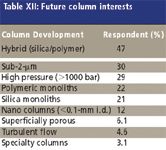
Table XII: Future column interests
Both silica and polymeric monoliths have caught the attention of some of the survey respondents. Such columns are characterized by lower pressure drop than current small particle columns. Column efficiency is similar to existing columns. Nanocolumns with diameters less than 100 μm currently are used for proteomics applications where the amount of sample is quite limited. Chip-based LC systems that also have extremely small column diameters could be another area of interest as the number of commercial product expands. Superficially porous particles have returned for applications involving high speed protein separations as well as small molecule separations. Turbulent flow chromatography is a technique where larger particles (~40 μm) packed into narrow tubes (1.0 mm i.d.) are run at very high linear velocities. Although turbulent flow Reynolds numbers are not achieved, the technique has found acceptance for the analysis of drugs in biological fluids. With the high flow rates used, proteins and other high molecular weight components do not have sufficient time to diffuse into packing pores and therefore are washed away while small drug molecules penetrate the pores and are separated by reversed-phase chromatography.
Conclusion
This survey, the first in a decade, has shown some changes over the time period. As expected, reversed-phase chromatography maintains its dominance with 92% of respondents using this technique with C18 and C8 being the most popular phases but phenyl seems to be growing. Some of the more specialized techniques have grown including HILIC, chiral, and biochromatography applications. The use of polymeric columns has decreased a little and find their applications in high-pH reversed-phase chromatography, ion-exchange and ion chromatography, and size-exclusion chromatography, both aqueous and nonaqueous.
The use of smaller particles is evident with 3.0–3.5-μm particles gaining in popularity with sub-2-μm columns now getting attention for high-throughput applications. These smaller particles are usually packed in shorter columns and run at higher flow rates.
Column purchasing questions revealed that column prices have increased around 30% in the last 10 years (3% increase per year, about the level of inflation in the United States) but the number of columns used per instrument has stayed about the same, an average of five per conventional analytical instrument per year. The general laboratory distributors have captured a bigger portion of the market mainly at the expense of the independent HPLC column producers. Column-to-column reproducibility is still the top factor in the buying decision.
Column life has continued to increase and the more frequent use of guard columns has helped. Future column interests include the hybrid (organic–inorganic polymers), sub-2-μm, and high-pressure packings to go with the newer ultrahigh pressure chromatographs coming onto the market.
References
(1) R.E. Majors, LCGC 15(11), 1008–1015 (1997).
(2) R.E. Majors, LCGC 2(9), 660–666 (1984).
(3) R.E. Majors, LCGC 3(9), 774–780 (1985).
(4) R.E. Majors, LCGC 6(4), 298–302 (1988).
(5) R.E. Majors, LCGC 7(6), 468–475 (1989).
(6) R.E. Majors, LCGC 9(10), 686–693 (1991).
(7) R.E. Majors, LCGC 12(12), 890–898 (1994).
(8) R.E. Majors, LCGC 12(9), 508–518 (1994).
(9) R.E. Majors, J.Chromatogr. Sci.11, 88–95 (1973).
(10) R.E. Majors, LCGC 23(12), 1248–1255 (2005).
Ronald E. Majors
"Column Watch" Editor Ronald E. Majors is business development manager, Consumables and Accessories Business Unit, Agilent Technologies, Wilmington, Delaware, and is a member of LCGC's editorial advisory board. Direct correspondence about this column to "Sample Prep Perspectives," LCGC, Woodbridge Corporate Plaza, 485 Route 1 South, Building F, First Floor, Iselin, NJ 08830, e-mail lcgcedit@lcgc-mag.com

Common Challenges in Nitrosamine Analysis: An LCGC International Peer Exchange
April 15th 2025A recent roundtable discussion featuring Aloka Srinivasan of Raaha, Mayank Bhanti of the United States Pharmacopeia (USP), and Amber Burch of Purisys discussed the challenges surrounding nitrosamine analysis in pharmaceuticals.


