The Current Status and Future of Two- and Multidimensional Liquid Chromatography in Pharmaceutical R&D and QC
LCGC Europe
This article will discuss the benefits of 2D-LC and multiple application areas in (bio)pharmaceutical analysis, and will highlight the challenges and future outlook.
Two-dimensional liquid chromatography (2D-LC) has recently seen major developments and attracted significant interest. The limited resolving power and insufficient chromatographic selectivity of conventional one-dimensional liquid chromatography (1D-LC) for more complex pharmaceutical products, alongside the introduction of modern commercial 2D-LC instruments means the technique is no longer considered a purely academic or specialist research tool. 2D-LC is now viewed as a powerful technique in the “analytical toolbox” and is being widely adopted in the analysis of both small molecules and more complex molecules, specifically biopharmaceuticals. This article will discuss the benefits of 2D-LC and multiple application areas in (bio)pharmaceutical analysis, and will highlight the challenges and future outlook.
Conventional one-dimensional liquid chromatography (1D-LC) is not always capable of effectively resolving complex samples. This limitation is not solely because of the lack of column efficiency, but is predominantly a result of insufficient chromatographic selectivity and the need to separate the analytes of interest by using orthogonal retention mechanisms. These limitations are one the main reasons two-dimensional liquid chromatography (2D-LC) is continuing to attract significant interest. 2D-LC greatly expands upon the capabilities of conventional 1D-LC by transferring fractions of the effluent leaving the first separation column to an additional separation process using a second separation system affording complementary selectivity (see Figure 1) (1). This results in considerably more resolving power than 1D-LC, and is particularly useful for the resolution of highly complex mixtures or closely related analytes, and it can also be used to swap solvents (mobile phases) offering additional benefits.
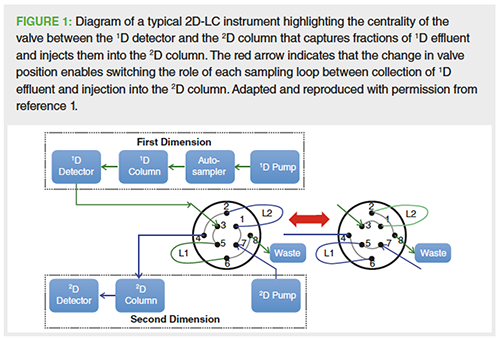
2D-LC was first introduced in the 1970s and Huber and co-workers expressed the opinion that “it represents one of the most powerful separation techniques and has a bright future, especially in routine analysis where optimal conditions are desired” (2). It was applied occasionally in pharmaceutical and biomedical analysis in the 1980s, and in the 1990s its use became wider spread, but was still mainly limited to the fields of polymer science, food science, and proteomics (1,3,4). These applications predominantly utilized the comprehensive on-line mode of 2D-LC, where effluent from the first separation dimension (1D) is sequentially transferred via a valve (modulator) to the second dimension (2D) over the course of the entire first separation time. It was widely applied to the analysis of samples that are not compatible with mass spectrometry (MS). In these scientific fields, customâdesigned 2D-LC instruments became indispensable analytical tools for tackling highly complex and difficult-to-separate mixtures, such as high-molecularâweight polymers, providing detailed characterization information, for example, molecular weight, charge, lipophilicity, shape,and branching. However, the use of these customized 2D-LC systems in the more regulated pharmaceutical industry was limited owing to the higher complexity, fundamental issues such as the compatibility of the 1D and 2D mobile phases/transfer fractions, “undersampling” problems resulting in loss of analyte resolution as a result of remixing those analytes in the sampling loop, and the requirement that the 2D separation must be very fast to accommodate the 1D sampling rate, for example, seconds to less than 2 min, using short columns and fast gradients. There were also other challenges, such as significantly higher instrument costs and training needs, lack of commercial instruments and integrated software, and the unproven performance, robustness, and regulatory acceptance. Therefore, the pharmaceutical industry continued to focus predominantly on the use of LC–MS and independent orthogonal techniques and modes, such as capillary zone electrophoresis (CZE), hydrophilic interaction liquid chromatography (HILIC), size-exclusion chromatography (SEC), and ion-exchange chromatography (IEC) to complement reversed-phase separations for the characterization of low- to medium-complexity products.
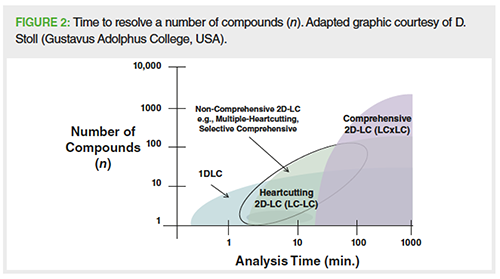
In the past decade or so substantial technical progress has been made and there are now multiple specifically designed commercial 2D-LC instruments with integrated software. Alongside this, major advances in equipment design in, for example, valves and modulators and the understanding of method development workflows by the groups of Carr and Stoll, and Schoenmakers, Gargano, Pirok, and co-workers means that the previous practical problems now appear to have solutions (1,4). The instruments are more robust and no longer considered research-only tools. This includes the development of nonâcomprehensive 2D-LC technologies, where only the fractions of the effluent of interest are transferred between the 1D and 2D, for example, the selected regions, peaks, or slices of peaks. This means the 2D is not time limited and therefore not peak capacity limited, and allows the use of longer 2D analysis times that afford higher peak capacities and resolving power geared towards the problem to be solved. Figure 2 compares 1D-LC and the comprehensive and non-comprehensive versions of 2D-LC, and the time to resolve a number of compounds (peak capacity and time). This indicates that 1D-LC is mainly suitable for low-medium complexity separations (<15–20 peaks) and 2D-LC modes afford more resolving power for complex separations by combining two different LC separation modes that offer complementary selectivities.
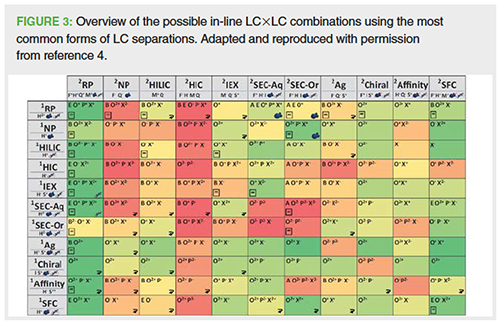
When developing 2D-LC methods there are many other practical considerations in addition to the goals and intended use of the separation method, the physicochemical properties of all the analytes of interest, and the desired peak capacity. A variety of combinations of 1st and 2nd dimension separation modes and retention mechanisms have been investigated by various groups, including Pirok and co-workers, and Stoll and Carr (1,4). They have produced various overviews on the combination of the most common LC separation modes, listing the advantages and disadvantages by evaluating chromatographic performance and suitability, such as applicability, orthogonality, solvent and MS compatibility, peak capacity and time, column re-equilibration time, and various other requirements. Coupling two different orthogonal reversed phase–reversed phase selectivities is proposed to be the most suitable combination owing to the high solvent compatibility, including MS, wider applicability, simplicity, and robustness (Figure 3). This is also observed in practice in our own laboratories and that of other groups and publications focused on small molecule analysis. The coupling of reversed-phase HILIC, reversed-phase IEC, and reversed-phase SEC (or vice versa) are also occasionally used (1,3,4).
The development and use of atâcolumn dilution and active solvent modulation (ASM) are effective commercial technical solutions to lower to solvent strength fractions being transferred between the 1D and 2D and thereby circumvent solvent incompatibility and differences in solvent strengths. Some instruments also facilitate the transfer of multiple fractions from the 1D using multiple heartâcutting (MHC) interfaces where the dual loop interface is replaced with selector valves equipped with multiple loops in a deck allowing “peak parking”, where the collected fractions can be analyzed later. These approaches simplify method development needs and workflows, for example, selection of mode, stationary phase, mobile phase and elutropic strength, or gradient ranges. These non-comprehensive modes typically offer sufficient resolving power for the goals of most pharmaceutical applications and are therefore finding wider spread use (see Figure 2) (1,3).
Small Molecule Applications
The versatility and many benefits of non-comprehensive 2D-LC means there are multiple potential applications in pharmaceutical analysis. 2D-LC is used extensively to increase peak capacity, and support process and product development and investigations, such as mass balance deficiencies on stability. A number of groups have used reversed phase–reversed phase 2D-LC to characterize pharmaceutical samples, specifically assessing the stability of drug substances and products during long-term and stressed stability studies, and investigating loss of active and mass balance deficiencies (3,5). Haidar-Ahmad et al. developed a reversed-phase LC–SEC 2D-LC method to simultaneous separate and quantify degradation products of a small molecule and large biomolecule in two different formulations as part of product development (5).
2D-LC is often used to support the development of stabilityâindicating methods as part of analytical method life cycle management and to ensure the loss in active pharmaceutical ingredient (API) is consistent with the formation and detection of the degradation products. 2D-LC is often used to confirm peak purity using two orthogonal reversed-phase stationary phases in the 1D and 2D. It is complementary to LC–MS and has additional benefits for non-ionizing analytes and isobaric components, for example, isomers. HaidarâAhmad et al. demonstrated the assessment of peak purity, where method performance suitability was confirmed (5). This employed MHC 2D-LC and the transfer of multiple fractions across the elution window of the main peak and all significant impurity and degradant peaks to a carefully selected second “orthogonal” column, based on a measure of “dissimilarity” in column characterization models and databases. The 2D-LC chromatograms of each fraction across the main peak were all single peaks, confirming the peak purity of the main peak. They also analyzed fractions across impurity peaks and showed that some peaks in the 2D eluted in a reverse order compared to the 1D. This reversal in elution order was due to orthogonal selectivity between the two dimensions. The fact that there appeared to be no coeluting peaks in the 1D method indicated good method performance and that it was suitable for its intended use.
Reversed phase–reversed phase MHC 2D-LC method development concepts generally follow the same principles as 1D method development and maximize retention and selectivity differences (orthogonal leverage), whilst trying to maintain compatibility of the 1D with the 2D and minimize the 1D transfer volume (6). Changes in the mobile-phase pH can impart large changes in selectivity (for ionizable compounds), and the stationary phase can have a very strong influence on the orthogonal leverage, as well as changing the solvent type. The 2D gradient range, shape, and temperature are less influential and are typically evaluated during the optimization stage. Accordingly, several groups utilize method development platforms employing mobile phase and column selection valves, which facilitate the automated screening of orthogonal columns and mobile phases to maximize selectivity differences in the second dimension (3).
Beyond the coupling of orthogonal reversed-phase selectivities, heart-cutting 2D-LC was also applied to several other LC modes. For example, in our laboratories the coupling of reversed-phase LC and HILIC (and vice versa) for the separation, quantification, and identification of degradation products coeluting with polar excipients. Other groups have performed the separation and quantification of polar excipients in protein formulation samples using SEC–HILIC 2D-LC, as well as combining chiral reverse phase and enantioselective columns for sequential quantitative achiral–chiral analysis (or vice versa) (3). For quantitative analysis of low-level impurities, the single complete heartâcutting of the whole peak is a preferred mode to ensure no sample loss and simpler data analysis and quantification.
2D-LC can be used to perform peak tracking and match the retention times for peaks of interest of two different LC methods. Examples include: comparing new and old methods, such as a compendial method, to justify its suitability, or comparing a drug substance method with the drug product method to clearly distinguish drug substance by-products from drug product degradant peaks. Another common example is the peak tracking of peaks of interest under different mobile phase conditions, either off-line or on-line. Such as the use of a nonvolatile, MS-incompatible buffer providing the desired chromatographic performance in the 1D coupled with an MS-compatible method in the 2D to provide MS structural information for identification purposes (5). MS is generally considered as a “3rd dimension” when added to 2D-LC to provide unambiguous peak tracking and more information on complex separations that may not be fully resolved chromatographically, such as biopharmaceuticals. 2D-LC–MS is more effective than conventional 1DâLC–MS to detect low-level impurities that coelute with or elute close to major peaks. It is an effective way to remove matrix interference, including reducing signal suppression caused by strongly ionizing components. Additionally, it can reduce sample preparation or purification work, and is also being explored for microâpreparative separations. Interestingly, it is often found that dilution of the 1D effluent with a weak solvent, such as water, prior to injection into the 2D has the beneficial effect of concentrating the analyte band on the head of the second column, causing an overall improvement in the peak height and sensitivity and MS spectral quality.
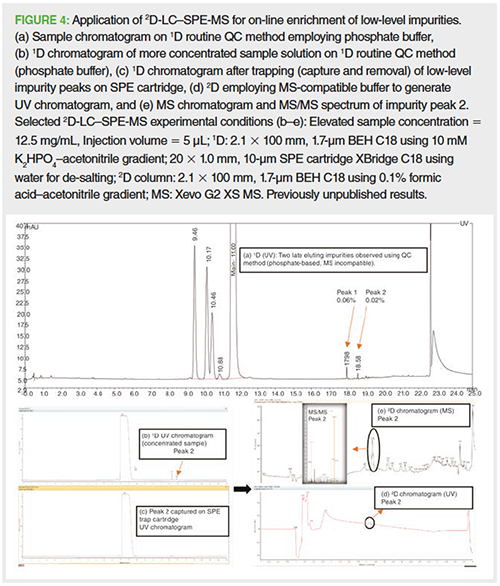
Similarly, the application of 2DâLC–solid-phase extraction (SPE)-MS for on-line enrichment of low-level impurities is a major application area and is shown in Figure 4. The use of 2D-LC–SPE-MS enables the use of a routine quality control (QC) method employing phosphate buffer in the 1D to achieve the desired chromatographic selectivity (Figures 4[a] and [b]). On exiting the 1D the fraction containing the low-level impurity of interest is diluted at-line with water and captured on an SPE trap column. This process is repeated multiple times, for example, five injections, to trap and enrich the trace peak. This process effectively removes sample matrix and nonvolatile mobile phase, and enriches the impurity (Figure 4[c]). The SPE trap column is then backflushed with an elution solvent into the 2D for retention and gradient separation employing a volatile mobile phase prior to UV and high resolution (HR)–MS/MS detection (Figures 4[d] and [e], respectively). 2D-LC–SPE-MS can provide improved MS structural information and impurity identification compared to 1D-LC–MS, 1D-LC–SPE-MS, or 2D-LC–MS.
2D-LC as a Valuable Analytical Tool for Therapeutic Protein Characterization and Analysis
The analytical characterization of monoclonal antibodies (mAbs) and related therapeutic proteins is extremely challenging because of the large size of these molecules (ca. 150 kDa) and their inherent heterogeneity (3). This structural complexity drives the use of stateâofâtheâart chromatography and MS and in this context, 2D-LC is a very attractive additional tool. 2DâLC–MS has perfectly integrated the analytical characterization landscape for therapeutic protein analysis by providing higher separation capabilities, complementary separation modes, and direct hyphenation of 1D-LC to MS. 2D-LC methodology has been widely applied throughout industry for the analytical characterization of therapeutic proteins, ranging from lowâmolecularâweight (LMW) species such as free drug identification and quantification from antibody–drug conjugate (ADC) samples via an SEC reversed-phase LC coupling, or the detection of host cell proteins (HCP) with reversed-phase LC–reversedâphase LC setup. It is regularly used to determine several critical quality attributes (CQAs) at the intact protein level, such as size, charge variants, or even CQAs related to intact ADCs (3).
2D-LC Hyphenated to MS Detection
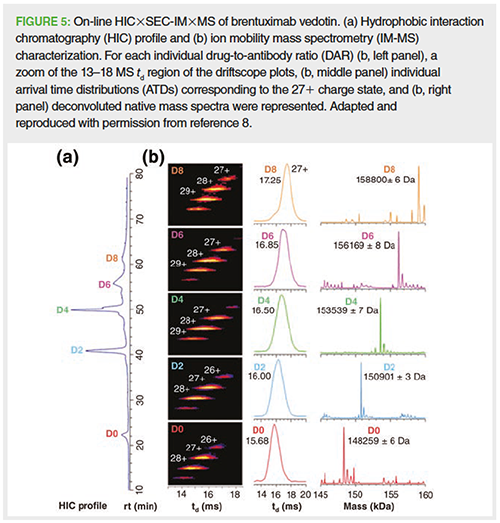
2D-LC separations have also been successfully hyphenated to MS detection for a deeper characterization of each separated species from therapeutic protein samples (3,7). For example, Sarrut et al. optimized a 2D separation for the characterization of the reference cysteine-linked ADC brentuximab vedotin (7). This coupling involved 1D-hydrophobic interaction chromatography (HIC), separating each drug-to-antibody ratio (DAR) species from the intact ADC, and 2D-reversedâphase LC, allowing a separation of each DAR fragment in denaturing and MS-compatible conditions for on-line MS detection of each subunit as an indirect identification of 1D-HIC peaks. This methodology is adequate for the indirect determination of the CQAs related to intact ADCs, such as the amount of unconjugated mAb, the drug load distribution, and the average drug-to-antibody ratio. In a similar study, Ehkirch et al. optimized the direct hyphenation of HIC to the MS counterpart in nondenaturing conditions by integrating a 2D-SEC column in ammonium acetate through HIC×SECânative MS coupling as depicted in Figure 5 (8). Indeed, the 1D-HIC conditions allowed the separation of each DAR species (Figure 5[a]) and the 2D-SEC was solely used for its sizeâbased separation capabilities, more precisely as a fast desalting step prior to native MS detection (Figure 5[b]), allowing a direct identification of each 1D-HIC peak in a full nondenaturing conditions setup. The main purpose of this HIC×SEC-native MS methodology was to maintain the structural integrity of the ADC, from HIC separation to native MS analysis for an on-line, direct, and straightforward characterization performed in nondenaturing conditions.
Towards Several LC Dimensions Prior to MS Detection: 4DâLC Hyphenated to MS
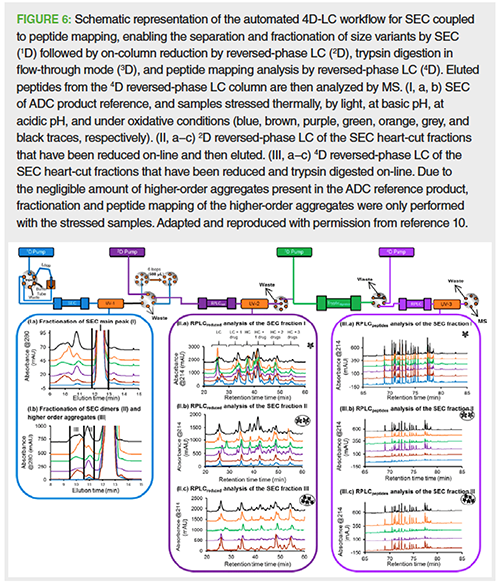
As therapeutic proteins become more and more complex, the need to obtain several separation dimensions prior to MS analysis is appealing. Consequently, major progress was achieved with the first and fully automated fourâdimensional (4D)-LC–MS system optimized by Gstöttner et al. for a deep characterization of mAb charge variants (9). For instance, a 1D-cationâexchange chromatography (CEC) separation was performed for charge variant separation and fractionation for subsequent 2D-reversedâphase LC trapping, reduction of mAb chains, and elution of charge variant. The on-line three-dimensional (3D)-trypsin cartridge allowed tryptic digestion of the reduced mAb chains and subsequent elution of the peptide mixture into the 4D-reversedâphase LC separation for peptide mapping employing MS detection of the peptides. This 4D-LC–MS/MS setup allowed, in a single run, the detection and location at the amino acid level of modifications, such as deamidation or oxidation and glycation in stressed and nonâstressed samples, therefore facilitating comprehensive charge variant characterization in an onâline and timeâsaving way. In the same trend, Goyon et al. reported more recently another 4DâLC–MS methodology using the previous described model and replacing the first dimension by a 1D-SEC separation for a SECâreductionâtryptic digestionâreversed-phase LC–MS/MS methodology (Figure 6) (10). Consequently, ADC size variants were separated and fractionated by 1D-SEC (Figure 6.I) and analyzed by 2D-reduced reversed-phase LC to determine the average DAR of the main species and aggregates (Figure 6.II). Subsequently, 3D-tryptic digestion and 4D-reversed-phase LC separation of the generated peptides for MS detection (Figure 6.III) were performed to identify and locate modifications such as deamidation or oxidation from stressed and non-stressed ADC size variants.
Oligonucleotides, A New Empowered Class of Human Therapeutics
A recently high profile class of therapeutics are oligonucleotide (ON)-based products that represent a promising approach in untreated diseases owing to their ability to be directed against their ribonucleic acid target. Their analytical characterization remains challenging, as it does for their associated impurities. Although multidimensional LC-based strategies have been used in numerous pharmaceutical industry applications, only a few examples are reported for oligonucleotide analysis. 2D-LC separations have been implemented in the analytical toolbox for such compounds, for example a HILIC × ion-pair (IP), IP × reversed-phase LC–MS coupling reported by Li et al. (11). This setup allowed the characterization of di- to deca- phosphodiester ONs, enhancing the chromatographic peak capacity whilst providing MS compatibility at the same time. Roussis et al. reported the versatility of a 2D-LC configuration hyphenated to MS for the characterization of phosphodiester and phospho ON impurities using as 1D anion-exchange chromatography (AEC), SEC, or IP-reversed-phase LC and 2D-IP-reversed-phase LC (12). Finally, a recent 2D-LC–MS combination was optimized by Koshel et al. for the characterization of fluoro-conjugated ON with IPâreversedâphase LC×IP-reversed-phase LC–MS using a different ion-pairing agent to achieve both orthogonal separation as well as to ensure MS compatibility (13). Haloacetic acids (HAA) ion-pairing agent was used in the 1D to maintain the best length-based separation and triethylamine-hexafluoroisopropanol (TEA-HFIP) was used in the 2D for subsequent MS detection.
Is 2D-LC Ready to be Implemented in the Regulatory QC Environment?
Multidimensional LC considerably facilitates the on-line characterization of therapeutic proteins such as mAbâbased products by providing enhanced separation capabilities. Furthermore, multidimensional LC can be hyphenated to MS for the subsequent identification of various species and CQAs. For biopharmaceuticals the 1D separation can use chromatographic techniques such as SEC, HIC, IEC, reversed phase, or HILIC, and the 2D can be employed as an on-line desalting step with reversed-phase LC (denaturing conditions) or SEC (nondenaturing conditions), and consequently provide MS compatibility. Nonetheless, the need for such 2D-LC–MS coupling has to carefully considered, as a straightforward 1D-LC–MS setup could be, in some cases, a more adequate choice for QC, allowing LC separation and MS identification at the same time with the use of volatile mobile phases. The automation of such multidimensional methods seems to be a real bottleneck, as well as developing systems that are easy to operate, which would facilitate the use of multidimensional strategies in regulatory environments. We believe that 2D-LC may be used in different biopharma environments, such as in-process control, including 2D-LC–MS process analytical technologies (PAT), or quality control, as an on-line 2D separation method could be less time-and resource-consuming compared with off-line 2D separation approaches.
A few groups have employed nonâcomprehensive 2D-LC in smallâmolecule QC-type applications and environments (3,14,15), mainly using 2D-LC for the separation and quantification of low-level impurities that coelute with the main peak in the 1D. Single complete heart-cutting of the whole peak in the 1D dimension is the preferred separation mode for quantification because there is no sample loss and data analysis is simpler. Several groups have “validated” such methods, for example, achiral–achiral or achiral–chiral, assessing method attributes such as sensitivity, linearity, accuracy, and precision to demonstrate that they can meet ICH Q2 expectations for impurity analysis (3,15). Venkatramani et al. demonstrated the power of 2DâLC in detailed quantitative analysis of structurally similar, coeluting impurities from key linker drug intermediate used in ADCs (15). High-resolution sampling (HRS) 2D-LC was used as this avoids sample losses commonly seen in MHC. The overall purity of the sample was determined from the product of 1D and 2D purity (LC Purity = %peak area of main component in 1D × %peak area of main component in 2D). They demonstrated that the method was validatable and also showed that effective peak focusing can lead to an order of magnitude enhancement in secondary column sensitivity. They also proposed that 2D-LC–MS is ready to transition to real pharmaceutical QC laboratories. Other groups have used 2D-LC as supportive regulatory information, confirming peak purity as part of the method life cycle, for example, specificity and peak purity confirmation as part of method validation.
However, for small molecules in general, 2D-LC is still not truly considered a routine QC technique. This is mainly because 2D-LC is not as simple as conventional 1D-LC, it requires special equipment, software, and expertise that are not present in a critical mass to allow analytical method transfer and routine use. To date, robustness and transferability are not well demonstrated. In addition, the benefits of 2D-LC in small molecule QC analysis are significantly less than in biopharma, as molecular complexity is lower and typically one or two independent chromatographic techniques can provide the necessary specificity and performance. Here it is important not to misuse 2D-LC where there is limited benefit and introduce unnecessary complexity and cost in the QC laboratory. For example, two independent methods, or dual methods in parallel, can be optimized for specific analytes and method performance characteristics and will typically offer improved precision, accuracy, and robustness compared with an integrated 2D-LC method. Independent methods are still easier to transfer, and typically offer more flexibility in the laboratory and more regulatory flexibility.
Conclusions
In recent years significant growth has occurred in the use of 2D-LC technologies in support of (bio)pharmaceutical analysis. The selectivity and specificity provided by 2D-LC enables the monitoring of product quality, leading to advances in process and product characterization and understanding. As the (bio)pharmaceutical industries transition towards more complex processes and products, the implementation of versatile and powerful tools such as 2D-LC and 2D-LC–MS will be a core component to the overall analytical control strategy, including impurity detection and identification, and for the assessment of method performance. 2D-LC is now considered a core technology in the analytical toolbox and is here to stay. There will be an increased trend to use non-comprehensive modes of 2D-LC in R&D and also mainstream (bio)pharmaceutical QC, specifically for the analysis of complex products, or where multi-attribute monitoring is needed, and this can be performed with a single onâline 2D or multidimensional LC system.
Continued advances in technology, workflows, and software are still needed to support routine 2D-LC implementation within development and in QC environments. These needs include: more platform-based 2D-LC tools with intuitive, easy-to-use hardware and software to enable non-experts to directly apply established methods or provide a simple starting point for method development; 2D-LC–MS software control and data processing and reporting via a single, integrated chromatography data system (CDS); simple, generic method development concepts covering more chromatographic space, ideally with method development software wizards and more automation; further training on the fundamentals of 2D chromatography and the development of industrial expertise and the knowledge base to facilitate the development, implementation, and transfer of methods. More scientists should share “real” validation, transfer, and robustness experiences to give more confidence and demonstrate its suitability for use in a regulated QC environment. Further development of other complementary chromatographic modes, for example, 2D-supercritical fluid chromatography (SFC)–LC and the development of new instrument capabilities and formats based on microfluidics, as well as 3D-printed devices, could further improve applicability and workflows.
Acknowledgements
The authors would like to thank Reinhard Pell, Dorina Kotoni, and Angelique Nitsche (all Novartis), Imad Haidar Ahmad (Merck, USA), Alexandre Goyon (Genentech, USA), Valentina D’Atri and Davy Guillarme (University of Geneva, Switzerland), Dwight Stoll (Gustavus Adolphus College, USA), and Sarah Cianferani (University of Strasbourg, France) for fruitful discussions, and providing examples and related graphics and figures.
References
- D.R. Stoll and P.W. Carr, Anal. Chem. 89, 519–531 (2017).
- J.F.K. Huber, in 75 Years of Chromatography, A Historical Dialogue, Journal of Chromatography Library, L.S. Ettre and A Zlatkis, Eds. 17, 159–166 (1979).
- V. D’Atri, S. Fekete, A. Clarke, J-L. Veuthey, and D. Guillarme, Anal. Chem.91(1), 210–239 (2019).
- B.W.J. Pirok, A.F.G. Gargano, and P.J. Schoenmakers, J. Sep Sci.41, 68–98 (2018).
- I.A. Haidar Ahmad, A. Blasko, A. Clarke. and S. Fakih, Chromatographia 81, 401–418 (2018).
- J.W. Dolan, LCGC Europe30, 250–255 (2017).
- M. Sarrut, S. Fekete, M.C. Janin-Bussat, O. Colas, D. Guillarme, A. Beck, and S. Heinisch, J. Chromatogr. B1032, 91–102 (2016).
- A. Ehkirch, V. D’Atri, F. Rouviere, O. HernandezâAlba, A. Goyon, O. Colas, M. Sarrut, A. Beck, D. Guillarme, S. Heinisch, and S. Cianferani, Anal. Chem.90, 1578–1586 (2018).
- C. Gstöttner, D. Klemm, M. Haberger, A. Bathke, H. Wegele, C. Bell, and R. Kopf, Anal. Chem.90(3), 2119–2125 (2018).
- A. Goyon, M. Kim, L. Dai, C. Cornell, F. Jacobson, D. Guillarme, and C. Stella, Anal. Chem. 91(23), 14896–14903 (2019).
- Q. Li, F. Lynen , J. Wang, H. Li, G. Xu, and P. Sandra, J. Chromatogr. A1255, 237–243 (2012).
- G.S. Roussis, I. Cedillo, and C. Rentel, Anal. Biochem. 556, 45–52 (2018).
- B. Koshel, R. Birdsall, and W. Chen, J. Chromatogr. B1137, 121906 (2020).
- S.H. Yang, J. Wang, and K. Zhang, J. Chromatogr. A1492, 89–97 (2017).
- C.J. Venkatramani, S.R. Huang, M. Al-Sayah, I. Patel, and L. Wigman, J. Chromatogr. A1521(27), 63–72 (2017).
Adrian Clarke is the editor of “Pharmaceutical Perspectives”. He is the analytical network leader in Technical R&D at Novartis Pharma, in Basel, Switzerland. He is responsible for identifying the function’s strategic direction and technological needs in analytical chemistry. His main interests are liquid-phase separations (LC, 2D-LC, SFC), GC, method development strategies, and also analytical control and regulatory strategies. He has authored many peerâreviewed articles and presented at multiple conferences on his research activities in separation sciences and pharmaceutical analysis. He is also a member of LCGC Europe’s editorial advisory board. Direct correspondence about this column should be addressed to the editorâinâchief, Alasdair Matheson, at amatheson@mmhgroup.com
Anthony Ehkirch is an analytical chemist in the Early Talent Program in Chemical and Analytical Development at Novartis Pharma, in Basel, Switzerland. He currently supports new modality projects such as analysis of oligonucleotides or monoclonal antibody-based products by using liquid chromatography and mass spectrometry. He received his D.Phil. in analytical chemistry from the University of Strasbourg, France.


