Coupling Columns and Multidimensional Configurations to Increase Peak Capacity in Liquid Chromatography
LCGC Europe
An overview is presented of possible pathways to enhance peak capacity in liquid chromatography (LC). The peak capacity in a chromatographic separation is directly related to the plate number and thus to column length and particle size. Serial coupled columns can be used to obtain long effective column lengths, reaching over 100000 theoretical plates and peak capacities up to 900. Some theoretical considerations are made on column dimensions and particle size and examples are given of high resolution "GC-like" separations in LC using state-of-the-art LC hardware. Recent developments in LC hardware have also enhanced the applicability of two-dimensional LC–LC and comprehensive LCÃ-LC. Both techniques are extremely powerful to unravel complex samples.
During the past few years, much attention has been paid to the speed of analysis to increase sample throughput. Fast or high-speed gas chromatography (GC) and liquid chromatography (LC) have become straightforward using state-of-the-art hardware. Applying short narrow bore open tubular columns in capillary GC and short columns packed with small (sub 2 µm) particles in LC respectively, both in combination with increased mobile phase linear velocity, analysis times can be reduced by a factor of 3–10, while the resolution is maintained compared with conventional methods. Many applications demonstrate the applicability of fast GC and fast LC for separations in different areas.
In a number of application areas, however, highly complex samples are encountered and for these applications the highest possible peak capacityis needed. Typical examples in liquid chromatography include screening of environmental samples, detailed polyphenol analysis in food analysis, structure characterization of impurities and metabolites in drug discovery and peptide separations in metabolomics. For such applications, analysis time is often of second importance, while the total number of peaks that can be separated is of the utmost importance.
In chromatography, the quality of a separation is expressed by the resolution Rs of a critical pair, which depends on the efficiency of the separation column (expressed as plate number N), the relative retention (expressed as selectivity α) and the residence time in the stationary phase (expressed as retention factor k):

While in capillary GC, very high efficiencies are easy to obtain (for example, a 30 m × 0.25 mm i.d. column, coated with a 0.25 µm film of an apolar stationary phase results in 120000 plates), plate numbers in LC are often only in the order of 10000. In contrast, both the mobile and the stationary phase can be optimized in LC to obtain optimum selectivity achieving the necessary resolution through these parameters.
For very complex samples, however, selectivity optimization is not sufficient as only the relative position of the solutes will alter while the total number of solutes that can be separated in one run remains constant.
The total number of solutes that can be separated in a single run (one single injection) is given by the peak capacity Pc. As derived by Giddings,1 the peak capacity in the first instance is a function of the plate number.

In gradient analyses, the peak capacity is calculated from the gradient time and average peak width, the latter being related to N.2,3
For the analysis of very complex samples, the plate number is thus the best measure to determine peak capacity and to predict the probability of solute resolution. In LC, the plate number can be increased in two ways: either the length of the column (L) can be increased, or the particle size of the packing material (dp) can be reduced:

Both pathways are, however, limited because of an increase of pressure drop over the column. The pressure drop across a packed column in LC depends on the linear mobile phase velocity (u0), the length of the column (L), the mobile phase viscosity (η), the column resistance factor (φ) and the particle size (dp):

From these equations, it is clear that an increase in column length will result in a proportional increase in plate number and a proportional increase in pressure drop. A decrease in particle size also leads to a proportional increase in plate number, however, in combination with a quadratic increase in pressure drop. Decreasing the particle size in LC should, therefore, in the first instance be considered as an efficient way to achieve the same resolution for a given application in a shorter analysis time (using a shorter column). Columns packed with sub 2 µm particles have been commercially available since 2000.4
On conventional LC equipment with a 400 bar pressure limit, the maximum length of these columns is practically limited to 5 cm. Using increased column temperature (60–80 °C), the viscosity of the mobile phase can be reduced and longer columns can be used. Recently, hardware has been introduced allowing LC at pressures up to 1000 bar. At such pressures, columns packed with sub 2 µm material and with lengths up to 15 cm can be used at room temperature. By applying elevated temperature (40 °C), even total column lengths up to 45 cm (coupling 2.1 mm i.d. × 1.7 µm Acquity BEH C18 columns) have been used, resulting in an effective plate number of 75000 in a 60 min analysis time (at a flow-rate of 0.17 mL/min corresponding to 1000 bar).5
However, it has been demonstrated using kinetic or "Poppe-plots" that this efficiency is more or less the theoretical and practical limit using sub 2 µm material. Further increase of column length leads to an exponential increase of analysis time (within the pressure limits of state-of-the-art LC hardware) without further increase in efficiency (plate number). At this point, long columns (>1 m column length) packed with conventional 3–5 µm packing material and operated at temperatures of 60–80 °C become more interesting from a plate number per analysis time point of view.3,5,6 It has been demonstrated that plate numbers up to 200000 could be obtained using a total column length of 2 m (8 × 25 cm column).3 Using serial coupled columns, it was found that plate number and pressure drop increase proportionally with column length, as predicted by theory.
Examples demonstrating both pathways to increase plate number will be presented. For the analysis of very complex samples, a single dimensional separation can, however, not guarantee complete separation and two-dimensional and comprehensive two-dimensional separation techniques can provide an answer. In liquid chromatography, two-dimensional separations have already been used for many years. A overview of coupled column LC techniques is given in reference 7. Initially two-dimensional LC was used in the "heart-cutting" mode, whereby only a specific fraction of the first dimension separation is transferred to the second dimension column, or in the "enrichment/purification" mode, whereby only a short pre-column is used in the first dimension. The role of the pre-column is to enrich solutes from a large volume injection (or from a sample stream), while only limited separation is obtained. Consequently, the solutes are transferred (often in backflush mode) to the analytical column for further separation.
The principle of comprehensive LC (LC×LC) has been known for a long time, but only recently received full attention.8,9 In LC×LC, all fractions from a first dimension separation are transferred to a second dimension column for further separation.
By using orthogonal (non-correlated) separation mechanisms, the peak capacity of the separation can be drastically increased. For truly comprehensive LC×LC, whereby the separation on the first dimension column is preserved, the peak capacity of the LC×LC separation is the product of the individual peak capacities of the two dimensions.1 Moreover, in LC several modes are available including reversed-phase LC (RPLC), normal phase LC (NPLC), ion exchange LC (IEC) and size exclusion chromatography (SEC), both in aqueous and non-aqueous mode.
Consequently, IEC-RPLC,10,11 , SEC–RPLC,12 NPLC–SEC,13 and NPLC–RPLC,14–16 combinations are possible.
An excellent overview of comprehensive LC in biomedical and pharmaceutical analysis is given by Dixon et al.17
Generally, two-position six port or ten port valves are used for 2D-LC or LC×LC. Problems with solute focusing at the beginning of the second dimension column and compatibility of the mobile phases used in the first and second dimension separation could be bypassed by using a low flow-rate in the first dimension (narrow to microbore column) in combination with a fast separation on a standard bore column operated at high flow-rate in the second dimension. Several valve configurations can be used (see reference 17). Two configurations are discussed for an NPLC–RPLC separation of a citrus oil extract and the obtained peak capacities are compared.
Experimental
All experiments were performed on Agilent 1100 or 1200 series HPLC configurations. The Agilent HT (high throughput) configuration, consisting of two binary pumps, a well-plate autosampler, a column oven compartment equipped with a two position 10-port valve and a diode array detector (DAD) detector (80 Hz) was used as basic equipment.
For column coupling, a Polaratherm 9000 column oven (SelerityTechnologies, Salt Lake City, Utah, USA) was used. The column oven allows isothermal and temperature programmed operation and includes pre-column mobile phase heating and post-column cooling. The oven volume is large enough to allow the installation of up to eight 25 cm columns.
For the comprehensive LC×LC experiments, initially the standard Agilent 1200HT configuration was used. For further optimization of LC×LC, an additional binary pump and DAD detector (80 Hz) was installed.16 Switching of the fractions to the second dimension was done using two synchronized two-position 10-port valves. Final experimental conditions for comprehensive LC×LC were
Dimension 1 (NPLC): Thermo Betasil Diol column (25 cm × 1 mm i.d. × 5 µm); flow-rate: 30 µL/min; mobile phase: A. hexane/ethylacetate (9/1), B. ethylacetate; gradient: 0–4 min: 0% B; 50–90 min: 60% B.
Dimension 2 (RPLC): Zorbax SB C18 column (5 cm × 4.6 mm i.d. × 3.5 µm); flow-rate: 4 mL/min; mobile phase: A. water, B. acetonitrile; gradient: 0–0.05 min: 0% B; 0.25 min: 45% B; 1.10 min: 80% B; 1.30 min: 90% B; 1.35–1.5 min: 100% B; 1.51–1.9 min: 0%; detection: 315 nm; data acquisition @ 80 Hz.
Decreasing Particle Size
Initially, only short (3–5 cm) columns packed with sub 2 µm particles were commercially available. These columns are mainly used for fast LC, providing similar plate numbers as classical 10–15 cm columns packed with 3 to 5 µm particles. Recently longer columns (up to 15 cm) packed with 1.7–1.8 µm material were introduced. A 15 cm column packed with 1.7–1.8 µm particles results in effective plate numbers in the order of 30000, typically some 25% below the theoretical values.5 These columns, however, represent the highest possible plate numbers achievable on a single column.
A typical application using a 15 cm × 4.6 mm i.d. column packed with 1.8 µm Zorbax Stablebond C18 material is shown in Figure 1. A mixture of pesticides (triazines + phenylurea pesticides) was analysed. Typically a 25–30 cm column is used in combination with a slow gradient, resulting in optimized resolution, but with an analysis time in the order of 60–80 min.18 Using the sub 2 µm column, operated at 500 bar (initially) and 80 °C, the same resolution is obtained in 12 min.
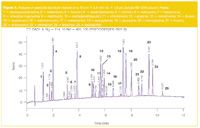
Figure 1
A second application is the analysis of flavanoids and psoralens (furocoumarins) in citrus and orange oils. The chromatogram obtained on a 15 cm × 4.6 mm i.d. column packed with 1.8 µm Zorbax Stablebond SB-C18 material is shown in Figure 2. A linear gradient from 40% to 100% acetonitrile in water in 20 min was used. The column was thermostated at 80 °C and operated at 2 mL/min. A very complex and detailed chromatogram is obtained. The average peak width of individual peaks at 4σ was 0.12 min. The calculated peak capacity for the 20 min gradient was 168 (calculation based on Equation 2).
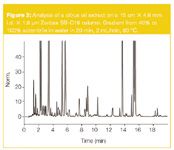
Figure 2
Increasing Column Length
Serial coupled columns offer high plate numbers in LC. In combination with elevated column temperatures to reduce the column back pressure, plate numbers of 100000– 200000 can be reached. This is, for instance, demonstrated by the analysis of a mixture of pharmaceutical compounds, structurally related impurities and degradation compounds. The mixture was analysed on a series of four 25 cm × 4.6 mm i.d. × 5 µm particle size Zorbax SB-C18 columns at 80 °C (total column length = 1 m). The chromatogram on the coupled column set is compared in Figure 3 to a chromatogram obtained on a single 25 cm column, operated at 30 °C. The difference in resolution is obvious. From the main peak, eluting at 16.9 min on the single column (upper trace), we can see that two additional impurities are separated (one before and one after the main peak) using the high efficiency column set (bottom trace). This application clearly demonstrates that high efficiency LC using coupled columns can be very beneficial for the screening of impurities in drug substances.
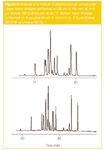
Figure 3
Another application on a set of serial coupled columns, shown in Figure 4, concerns the analysis of xanthines in wine. The analysis was performed on a set of four columns of 15 cm L x 4.6 mm i.d. × 3.5 µm Zorbax SB-C18. The column set was operated at 80 °C. A gradient from 50–80% acetonitrile in water was used (gradient time: 25 min). More than 80 peaks were resolved in this separation.
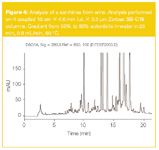
Figure 4
Extremely high resolutions could be obtained using a column set of 8 columns of 25 cm × 2.1 mm i.d. packed with 5 µm particles of Zorbax 300SB-C18 material. A length of 2 m packed with 5 µm particles should generate 200000 plates and indeed this was experimentally obtained. Figure 5 shows the isocratic analysis of a phenone standard mixture and the peaks show efficiencies ranging from 201000–209000.
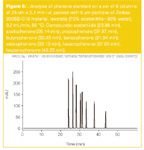
Figure 5
This column set-up has been used for the analysis of pharmaceuticals (small molecules) and for serum proteins via tryptic digestion (biomarker study).19 For this last application, the peak capacity was as high as 900 as measured from the analysis of a standard peptide mixture (Proteomix), containing five peptides, and α-cyano-4-hydroxy-cinnamic acid (Figure 6). A linear gradient from 2–70% acetonitrile (+0.1% TFA) in water (+0.1 % TFA) in 500 min at a flow-rate of 0.2 mL/min and a column temperature of 60 °C were used. Details of the study will be published elsewhere.20
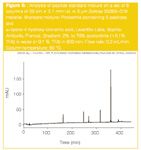
Figure 6
Multidimensional HPLC
A typical application of multidimensional LC in an "enrichment/clean-up" mode is the determination of phthalate mono-esters in urine. The mono-alkylesters of phthalic acid are primary metabolites and can be used to measure exposure to phthalates. The analysis of these compounds was done using the LC configuration shown in Figure 7. A urine sample was treated by enzymatic hydrolysis and diluted with buffer (1/1). From this sample, 100 µL was injected onto a pre-column (Waters Oasis HLB, 2 cm × 2.1 mm i.d.). The sample was eluted through the pre-column in isocratic mode (pump 1) with 10% methanol – 90% 50 mM ammonium acetate in water. The effluent of the pre-column was monitored and a typical UV chromatogram is shown in Figure 7.
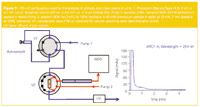
Figure 7
At the beginning of the chromatogram, a large peak of very polar solutes is detected. After the elution of this fraction (3 min), the two-position 10-port valve (installed in the column oven compartment) is switched and the pre-column is back-flushed at 1 mL/min using a gradient from 30–100% methanol in 50 mM ammonium acetate in water in 13 min (followed by 7 min isocratic at 100% methanol)(pump 2). The analytes are separated on the analytical column (25 cm × 4.6 mm i.d., 5 µm Zorbax CN) and detected by MS using (+) electrospray ionization (ESI) and selected ion monitoring (SIM) mode. A chromatogram obtained on a urine sample spiked with mono-ethylhexylphthalate (MEHP), mono-isononylphthalate (MiNP) and mono-isodecylphthalate at the 25 ppb level is shown in Figure 8. Ring 13 C4-MEHP was used as internal standard. MEHP is the primary metabolite of bis(2-ethylhexylphthalate). MiNP and MiDP are the metabolites of di-isononylphthalate and di-isodecylphthalate respectively.
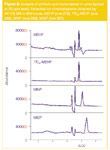
Figure 8
These chemicals are not present as single chemical identities, but are isomeric mixtures of respectively C9- and C10-diesters of phthalic acid. For that reason, the peaks of MiNP and MiDP are broader since they correspond to an alkyl isomer distribution. The chromatogram clearly demonstrates that concentrations in the low ppb level can be monitored and that matrix interference is minimized because of selective removal in the pre-column.
Comprehensive LC×LC
Comprehensive LC×LC was applied for the detailed analysis of mixtures of pharmaceuticals and citrus oil extracts.15 Initially a two-position 10-port switching valve configuration was used as illustrated in Figure 9. The effluent of the first dimension column was consecutively eluted into sample loop 1 and 2 (both 30 µL volume). In parallel, the sample loops are consecutively eluted with flow from pump 2 and injected into the analytical column. Using this mode, successful NPLC×RPLC operation was possible. For a citrus oil extract, a peak capacity of 450 was obtained as a result of a peak capacity of 46 and 15 in the first and second dimension respectively. The obtained peak capacity was calculated using the method described by Liu et al.21
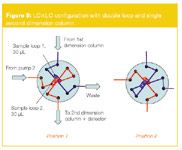
Figure 9
The main disadvantage of this configuration is the considerable loss of "separation space" that results from the time needed for column equilibration. The time needed to fill one 30 µL sample loop at a flow of 30 µL/min is 1 min. However, this time is not completely available for the second dimension separation, since the second dimension column should be reconditioned as well during this time. For this reason, a novel configuration, using two parallel second dimension columns was proposed.16
The configuration is shown in Figure 10. In contrast to the conventional loop interface, this set-up enables an analysis and reconditioning time of two minutes. The identical sample loops are again filled consecutively during 1 min time-frames. The sample loops are then injected in one of the RPLC columns using one of the RP pumps, while the analysis on the second RPLC column can be continued, followed by reconditioning of this column (using the other RP pump). The obtained separation for a citrus oil extract is shown in Figure 11. By projecting the dots on either the X- or Y-axis, it is clear that in either NPLC or RPLC important overlap is obtained. The LC×LC separation results in high resolution.
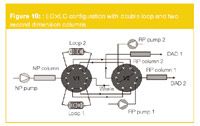
Figure 10
In comparison to the initial configuration, the gradient time in the second dimension could largely be increased and the total peak capacity was 1150, more than double of the peak capacity obtained with the original configuration.
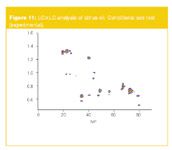
Figure 11
Conclusions
Peak capacity in LC can be increased to more than 100 using a 15 cm column packed with sub 2 µm particles. Extremely high peak capacities up to 900 could be obtained on a serial coupled column packed with 5 µm particles and operated at elevated temperatures. For complex samples, two-dimensional LC–LC and comprehensive LC×LC are extremely powerful to obtain high resolution. Using a novel configuration applying two parallel second dimension columns, a peak capacity over 1000 could be obtained.
Acknowledgements
Isabelle François and Pat Sandra thank the Institute for the Promotion of Innovation through Science and Technology in Flanders (IWT) and ICI for financial support. Agilent Technologies is thanked for the loan of equipment and columns.
References
1. J.C. Giddings in Multidimensional Chromatography, Techniques and Applications, H. Cortes, Ed. (Chromatographic Science series Vol 50, Marcel Dekker Inc, New York, USA,1990), pp 1–27.
2. U.W. Neue, J. Chromatogr. A, 1079, 153–161 (2005).
3. F. Lestremau et al., J. Chromatogr. A, 1109, 191–196 (2006).
4. J.J. Kirkland, J. Chromatogr. Sci., 38, 534–544 (2000).
5. A. de Villiers et al., J. Chromatogr. A, 1127, 60–69 (2006).
6. F. Lestremau et al., J. Chromatogr. A, 1138, 120–131 (2006).
7. C. Corradini in Multidimensional Chromatography, L. Mondello, A.C. Lewis and K. Bartle, Eds, (John Wiley & Sons Ltd, 2002), pp 109–134.
8. F. Erni and R.W. Frei, J. Chromatogr., 149, 561–569 (1978).
9. M.M. Bushey and J.W. Jorgenson, Anal. Chem., 62, 161–167 (1990).
10. L.A. Holland and J.W. Jorgenson, Anal. Chem., 67, 3275 (1995).
11. K. Wagner et al., J. Chromatogr., 893, 293–305 (2000)
12. G.J. Opitech, J.W. Jorgenson and R.J. Anderegg, Anal. Chem., 69, 2283–2291 (1997).
13. A. van der Horst and P.J. Schoenmakers, J. Chromatogr., 1000, 693–709 (2003).
14. P. Dugo et al., Anal. Chem., 76, 4353 (2004).
15. I. François, A. de Villiers and P. Sandra, J. Sep Sci., 29, 492 (2006)
16. I. François et al., paper presented at 29th ISCC, Riva del Garda, Italy, May 29–June 2, 2006.
17. S.P. Dixon, I.D. Pitfield and D. Perrett, Biomed. Chromatogr., 20, 508–529 (2006).
18. International Standard ISO 11264, first version 2005-05-01, Soil Quality — Determination of Herbicides — Method using HPLC with UV detection — ISO Geneva (www.iso.org)
19. P. Sandra, paper presented at HPLC 2007, June 17–23, 2006, San Francisco, California, USA.
20. P. Sandra and G. Vanhoenacker, J. Sep. Sci., submitted for publication
21. Z. Liu, D.G. Patterson and M.L. Lee, Anal. Chem., 67, 3840–3845 (1995).
Frank David,1,2 Gerd Vanhoenacker,2 Bart Tienpont,2 Isabelle François1 and Pat Sandra1,2
1 Laboratory of Organic Chemistry, University of Gent, Gent, Belgium
2 Research Institute for Chromatography, Kortrijk, Belgium
Pat Sandra is professor at the University of Gent and director of the Research Institute for Chromatography (RIC).
Frank David is visiting professor at the University of Gent and R&D manager at RIC.
Gerd Vanhoenacker and Bart Tienpont are researchers at RIC.
Isabelle François is a PhD student at the University of Gent.

Polysorbate Quantification and Degradation Analysis via LC and Charged Aerosol Detection
April 9th 2025Scientists from ThermoFisher Scientific published a review article in the Journal of Chromatography A that provided an overview of HPLC analysis using charged aerosol detection can help with polysorbate quantification.
Removing Double-Stranded RNA Impurities Using Chromatography
April 8th 2025Researchers from Agency for Science, Technology and Research in Singapore recently published a review article exploring how chromatography can be used to remove double-stranded RNA impurities during mRNA therapeutics production.


