Chromatography Fundamentals, Part V: Theoretical Plates: Significance, Properties, and Uses
LCGC North America
The number of theoretical plates forms the basis of chromatographic theory, and is a key parameter used in all modes of chromatography for measuring column efficiency. Fortunately, it’s easy to measure.
Plates are generated during the elution of solutes through a chromatographic column and contain a wealth of information about the separation process, mainly peak dispersion. It is an easily measured quantity used to probe column properties.
We had previously shown in part IV of this series (1) that the plate concept originated from fractional distillation and was later used to interpret results obtained from countercurrent distribution (CCD) extractions. At about the same time that CCD was being developed, A. J. P. Martin (1910-2002) and R. L. M. Synge (1914-1996) formulated a theory of chromatography using the theoretical plate concept (2,3). These researchers went on to win the Nobel Prize in Chemistry in 1952 for the invention of partition chromatography.
In this article, we will focus on the development of theoretical plates and peak broadening, and arrive at relationships that are applicable to liquid chromatographic (LC) separations. The more important relationships from distillation and CCD will once again be reviewed for the benefit of the reader.
Background Information
Fractional Distillation
The concept of theoretical plates was first introduced with respect to fractional distillation, which required an accounting of the separation efficiency of different lengths and designed distillation columns (1). It was assumed that the distillation process occurs in stages along the length of a distillation column, the location of which varies during the distillation process. At each stage, equilibrium is reached between the vapor and liquid phases, and separation occurs between high- and low-vapor-pressure components. The number of theoretical plates is proportional to column length, and depends upon column design. It should be emphasized that distillation is not a chromatographic process, but a countercurrent process of rising vapor in contact with descending distillate droplets.
To compare distillation efficiencies among columns of different lengths, column length, L, is divided by plates, N, to give the height equivalent of a theoretical plate, HETP, or simply plate height H:

Although distillation is a complex process, each plate can be viewed as a virtual platform on which vapor-liquid equilibrium occurs.
CCD Extractions
A cleverly designed automated CCD extraction apparatus, comprised of multiple two-compartment transfer tubes, was invented by Craig and Post (2). Craig tubes consist of upper and lower compartments, filled respectively with two immiscible solvents (1,2). The first tube contains sample dissolved in either the upper or lower immiscible liquid phase. After each extraction, the upper phases are simultaneously transferred to adjacent tubes, contents mixed, and the process repeated until all transfers are completed. The amount of solute that is equilibrated between the two phases depends on the distribution coefficient of the solute, K, and relative volumes of the two phases (1,3).
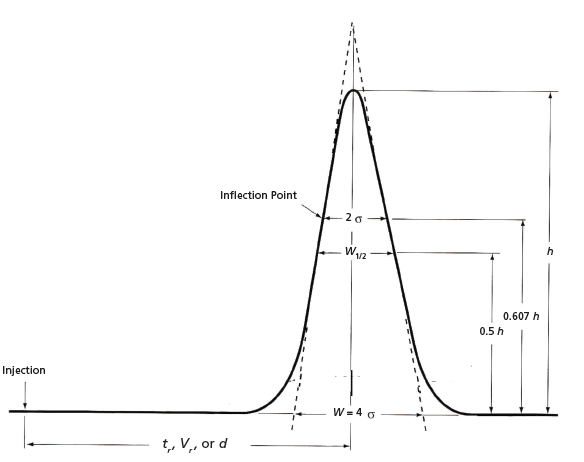
Figure 1: Gaussian chromatographic peak indicating different methods of measuring theoretical plates. Refer to Table I and equations 6, 12 to 15.
Distribution profiles of solutes are constructed manually by plotting solute concentration, c, against the number of transfers, r, or tube location. If we assume a Gaussian distribution (see Figure 1), the number of theoretical plates of a CCD run can be approximated using

with a standard deviation defined by

where p and q are the respective solute fractions in the two immiscible phases at equilibrium. (By convention, p is the solute fraction in the upper compartment or mobile phase and q is the solute fraction in the lower compartment or stationary phase). We can now see that the chromatographic theory, including peak broadening, is beginning to take shape.
Martin and Synge's Contributions to LC Theories
Martin and Synge sought to improve upon CCD extractions with a paradigm shift by inventing partition chromatography, a technique that uses a liquid stationary phase. Their experiments consisted of using LC columns packed with an adsorbent coated with an immiscible liquid phase. (In addition, paper chromatography was also introduced by these Nobel laureates.)
They made the following assumptions, which are universally valid for chromatographic techniques (4,5):
1. Separation is uniform throughout a chromatographic column.
2. A column can be divided into equal lengths, stages, or segments.
3. Within each stage, there is sufficient time for equilibrium to be reached, as solutes partition between mobile and stationary phases.
4. Solutes are sufficiently dilute so that their retention characteristics, i.e., thermodynamic properties, are independent of one another.
5. When applied to LC (or GC), each stage approximates one theoretical plate.
6. The number of theoretical plates generated by a solute can be calculated by representing each peak as a Gaussian distribution.
7. Each theoretical plate is considered to be a discrete site (a nano-size separatory funnel, if you wish), in which solutes distribute between two phases.
8. After equilibrium, solute is carried by the mobile phase to the next theoretical plate and the process repeated until components emerge from the column with characteristic retention times and peak widths, as described by a Gaussian distribution.
Martin and Synge published two experimental methods for determining the number of theoretical plates of an LC peak (4).
Method 1
A Gaussian distribution was used to describe solute concentration as a function of retention time t, where tr is peak maximum, σ is the standard deviation, and x = t - tr:

Based on this equation, the following relationship was derived:

Here l is the distance from the point of injection to the peak maximum, h is peak height, and A is peak area.
Equation 5 can now be converted to the iconic plate equation, where l is set equal to retention time, tr, and area and height are transformed into peak width in units of time (4–11):

Click here to view full-size graphic
Provided that the peak is a Gaussian distribution, equations 5 and 6 are equivalent.
Method 2
The second approach used was to compare LC to CCD extractions. Since r is equal to one transfer in a CCD analysis, or by definition, r = n, equation 3 can be written as

We know that n is a single plate, i.e., n = N, thus equation 7a, becomes

As previously shown (1), after r transfers, the CCD tube that contains the maximum concentration of solute, µ, is given by

Since µ ∝tr and from equation 2 we know that r ∝N, equation 8 can be recast as

Taking the ratio of equations 9 and 7b, we obtain

Squaring numerator and denominator,

Letting time be the unit of measurement, wt=4σt, we obtain the expected result,

which is identical to equation 6. This classical equation not only allowed separation efficiency to be compared among columns, but also was key for optimizing LC experimental parameters, as described below.
Theoretical Plate Representations
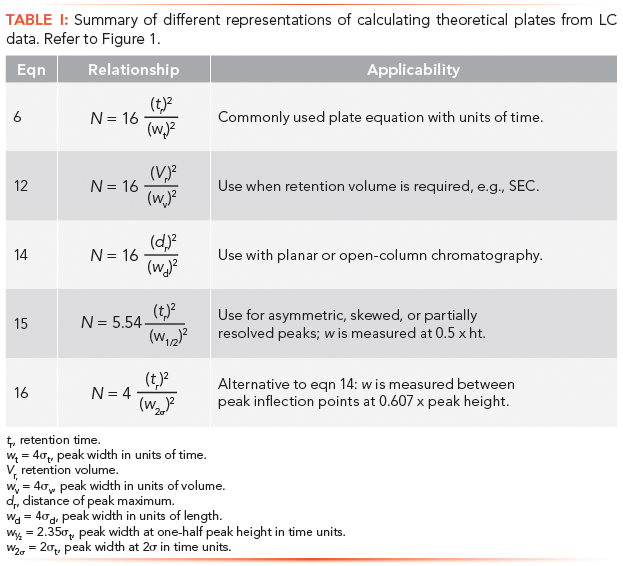
Retention and peak width in equation 6 can be adjusted to accommodate the types of measurements being made. Thus these values can be expressed in terms of volume, by multiplying each term by flow rate, F:

For researchers who still rely on strip-chart recorders, or for estimating plates from TLC or open columns (3), the following equation can be used:

where dr is either the peak maximum distance on the strip chart or the migration distance of a solute band or TLC spot, and wd is the baseline width. Equations 5, 6, 13, and 14 are similar, if not identical; however, plate calculations from planar chromatography and open-column LC are estimates, since solute zones are usually not Gaussian. (Before online computers, peak widths were calculated manually by drawing tangents to the two slopes of a peak, as seen in Figure 1.)
Occasionally, baseline widths may be problematic to measure reliably because of noise, drift, peak asymmetry, or the presence of partially resolved peaks. A common procedure to avoid these difficulties is to measure peak widths higher up the peak, as illustrated in Figure 1. Thus, at one-half peak height, equation 15 is used:

We can move still higher up the peak and measure width between inflection points, i.e., 2σ, as depicted in Figure 1, and equation 16:

Since equations 6, 15, and 16 may give different results depending on peak shape and overlapping peaks, measurements should be consistent for a given analysis. These equations are summarized in Table I.
Theoretical Plate Properties
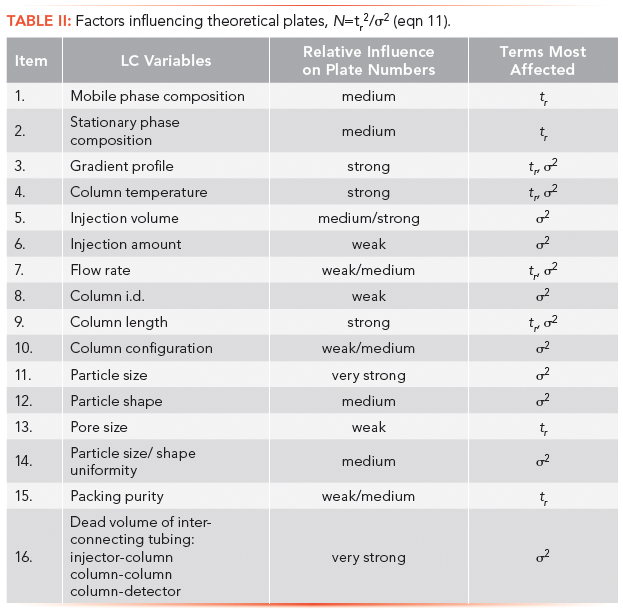
Table II lists LC experimental parameters and their qualitative effects on the number of theoretical plates, as shown in the last column. In spite of the complexity of some of these relationships, correlations have been established most notably with injection volume, flow rate, column length, particle size, and dead volume. Except for column length, which is given in the next section, these relationships will be covered in subsequent tutorials.
Column Length
Column length, L, is an integral part of plate theory, since tr ∝ L. Furthermore, the number of transfers, r, with respect to CCD, is analogous to column length. Therefore, from equation 3, σ = √rpq, we obtain σ ∝ √L and equation 11 becomes:

Equation 17 indicates that sufficiently long columns can be used to generate enough plates to pull apart neighboring peaks. However, there are three critical limitations: back pressure, analysis time, and detectability. Column pressure and analysis time are both directly proportional to length, and an acceptable column length can be readily predicted from a single measurement using any convenient column length.
As column length increases, peaks broaden with a corresponding decreased detector response, defined by equation 4. Decreased detector response, however, will also affect signal-to-noise ratio, limiting detection of trace or minor components.
Plate Height
An essential relationship derived from theoretical plates is plate height or height equivalent of a theoretical plate, HETP (see equation 1). Martin and Synge referred to it as plate "thickness", in which the "thicker" or wider the plate, the lower the separation efficiency. They proposed that plate thickness corresponded to the depth of the stationary phase and reasoned correctly that column efficiency could be improved by decreasing this layer or increasing the rate of transfer of solute molecules during partitioning.
Equation 1 can also be expressed differently by letting N = L2/σ2:

Plate height now becomes peak variance per unit column length, a relationship used for studying column and packing properties that govern peak broadening, as discussed in part VI.
Chromatographic Resolution
Another critical relationship is the resolution, Rs, between adjacent peaks,

where Δx is the distance between two peak maxima, and σ is the average standard deviation of two adjacent peaks, which we assume are Gaussian. A value of ≥ 1.5 is required for baseline resolution of two peaks of equal areas.
Resolution can be related to column length by considering the behavior of peaks during elution. As two adjacent peaks travel through a column, peak maxima move apart, according to

Peak dispersion or width, however, also increases, but not as fast. The relationship between peak width and column length becomes apparent by rearranging equation 18:

Since H is constant for a given column,
We can move still higher up the peak and measure width between inflection points, i.e., 2σ, as depicted in Figure 1, and equation 16:

Since equations 6, 15, and 16 may give different results depending on peak shape and overlapping peaks, measurements should be consistent for a given analysis. These equations are summarized in Table I.

Click here to view full-size graphic
Theoretical Plate Properties
Table II lists LC experimental parameters and their qualitative effects on the number of theoretical plates, as shown in the last column. In spite of the complexity of some of these relationships, correlations have been established most notably with injection volume, flow rate, column length, particle size, and dead volume. Except for column length, which is given in the next section, these relationships will be covered in subsequent tutorials.

Column Length
Column length, L, is an integral part of plate theory, since tr ∝ L. Furthermore, the number of transfers, r, with respect to CCD, is analogous to column length. Therefore, from equation 3, σ = √rpq, we obtain σ ∝ √L and equation 11 becomes:

Equation 17 indicates that sufficiently long columns can be used to generate enough plates to pull apart neighboring peaks. However, there are three critical limitations: back pressure, analysis time, and detectability. Column pressure and analysis time are both directly proportional to length, and an acceptable column length can be readily predicted from a single measurement using any convenient column length.
As column length increases, peaks broaden with a corresponding decreased detector response, defined by equation 4. Decreased detector response, however, will also affect signal-to-noise ratio, limiting detection of trace or minor components.
Plate Height
An essential relationship derived from theoretical plates is plate height or height equivalent of a theoretical plate, HETP (see equation 1). Martin and Synge referred to it as plate "thickness", in which the "thicker" or wider the plate, the lower the separation efficiency. They proposed that plate thickness corresponded to the depth of the stationary phase and reasoned correctly that column efficiency could be improved by decreasing this layer or increasing the rate of transfer of solute molecules during partitioning.
Equation 1 can also be expressed differently by letting N = L2/σ2:

Plate height now becomes peak variance per unit column length, a relationship used for studying column and packing properties that govern peak broadening, as discussed in part VI.
Chromatographic Resolution
Another critical relationship is the resolution, Rs, between adjacent peaks,

where Δx is the distance between two peak maxima, and σ is the average standard deviation of two adjacent peaks, which we assume are Gaussian. A value of ≥ 1.5 is required for baseline resolution of two peaks of equal areas.
Resolution can be related to column length by considering the behavior of peaks during elution. As two adjacent peaks travel through a column, peak maxima move apart, according to

Peak dispersion or width, however, also increases, but not as fast. The relationship between peak width and column length becomes apparent by rearranging equation 18:

Since H is constant for a given column,

the resolution equation now can be expressed as

Based on this relationship, resolution will increase by only 40%, each time column length is doubled. Furthermore, if we wanted to double resolution, column length would have to be increased by a factor of four. The resolution equation will be examined in more detail in a subsequent article of this series.
Theoretical Plates: Range and Limitations
It is instructive to estimate the minimum plate count of low-resolution chromatographic methods, like paper, thin-layer, or open-column chromatography. We can assume a worst-case scenario in which a solute tails from the point of application to its final resting place. If we let x be the distance from sample application to the middle of a sample spot (splotch) or tailed band, then σ ≈ ½x. The approximate plate count is N = x2/σ2 ≈ 4. Indeed, the typical plate count of open columns seldom exceed 102. Even with these extraordinarily low plate counts, by modern standards, these methods were highly praised for their separation abilities.
Modern, high efficiency columns, by comparison, can typically range between 104 to less than 105 plates per column, depending, of course, on column length. In theory, there is no upper plate limit, since we can always construct longer columns.
Suppliers sometimes advertise columns based of plates per meter, which can be misleading since actual column lengths are significantly shorter. In order to compare columns, it is best to choose columns based on actual plates per column length; for column comparisons, plate height is preferred, which is independent of column length.
Recall that LC plate theory was developed by assuming Gaussian peak distributions: for non-Gaussian peaks, such as skewed or tailed shapes, the plate concept is no longer applicable, and plate counts are usually underestimated, unless peak width is measured at 50% or 60.7% of peak height (equations 15 and 16). Furthermore, plate theory is also based on the assumption that chromatographic conditions remain constant throughout the analysis and that equilibrium has been reached.
When gradient elution or temperature programming is applied, equilibrium may not be attained. In addition, retention times are dictated by the gradient profile. As a result, strongly retained peaks can remain stationary during part of the gradient and elute at considerably long times with compressed peak widths, producing artificially high plate counts. Under these conditions, the physical significance of theoretical plates is lost.
Theoretical Plates: Applications
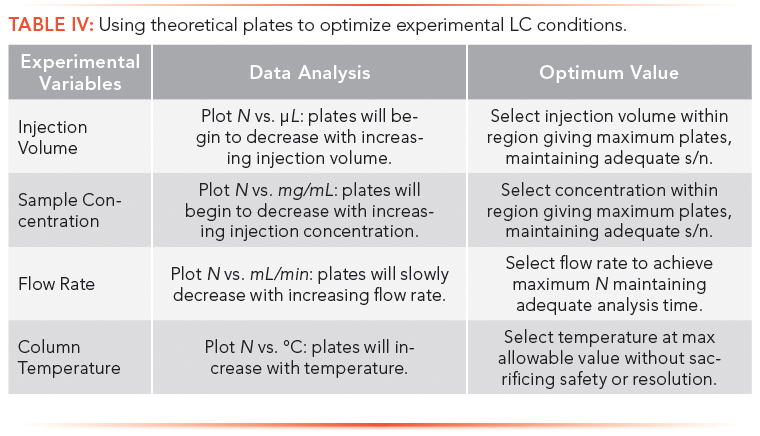
Theoretical plate measurements of unretained solutes are typically used in the development and maintenance of LC methods, as described below and summarized in Tables III and IV. Unretained solutes reflect the uniformity of the packed bed, packing particle size, mobile phase hydrodynamics, solute diffusion coefficient in the mobile phase, and extracolumn effects. In addition to these effects, retained solutes also probe stationary phase characteristics, such as its thickness and homogeneity, and the diffusion coefficients of solutes within the stationary phase. In this section, only unretained solutes are considered for column evaluation, since they will produce higher plate counts than retained components, thus are more sensitive probes.
Most LC peaks have profiles that deviate from Gaussian distributions and are not strictly symmetrical; consequently, there will be errors associated with baseline width measurements. In view of this imprecision, only two significant figures are justified for reporting plate counts.
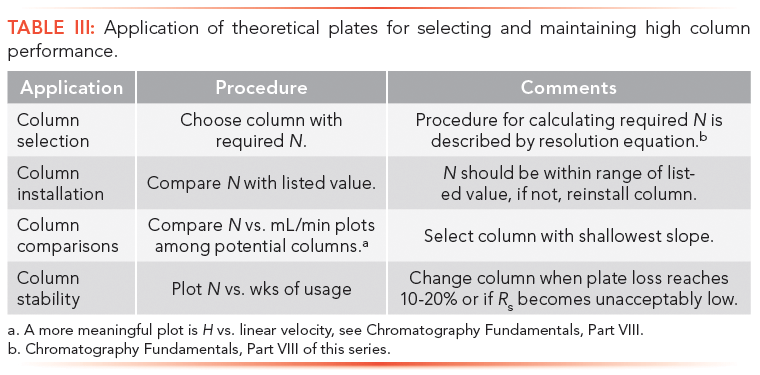
A summary of theoretical plate applications is outlined below and in Tables III and IV.
Getting Started with Plates
Based on preliminary analytical runs, the required number of plates to effect a separation are estimated; this procedure will be described in part VII. With this value, an appropriate column of required plates can be selected.
After a new column is installed, the plate number is checked against the supplier's value to ensure that the column was correctly plumbed into the LC system.
Experimental parameters, such as injection volume, solute concentration, flow rate, and column temperature, are then optimized for maximum plate count.
Column performance typically will deteriorate with time, as a result of buildup of particulates or contaminants, disruption of packing uniformity, dissolution of silica packing, loss of bonded phase, or surface oxidation. Column fidelity is ascertained by monitoring separation attributes, such as plate count, solute retention time, and resolution on a routine basis.
Conclusions
The number of theoretical plates, which forms the basis of chromatographic theory, is a key parameter used in all modes of chromatography for measuring column efficiency. It is simply the ratio of retention squared to peak variance, a relationship first realized by Martin and Synge.
When column length is normalized with respect to plate number, we obtain a new parameter, the plate height, which is a measure of the amount of peak broadening that occurs when solute travels through a defined length of column. Solute emerges as a Gaussian distribution carrying information regarding solute and column characteristics, as well as experimental conditions.
Plate number and height are used to develop and optimize chromatographic methods, details of which will be presented in subsequent articles of this series on the fundamentals of chromatography.
Our next tutorial will review the properties of the Gaussian distribution with emphasis on peak variance and its effect on chromatographic resolution.
References
(1) H.G. Barth, LCGC North Am. 36(8), 532–535 (2018).
(2) E.W. Berg, Physical and Chemical Methods of Separation (McGraw-Hill, NY, 1963).
(3) H.G. Barth, LCGC North Am. 36(3), 200-203 (2018).
(4) R J. Magee, Selected Readings in Chromatography (Pergamon Press, Oxford, UK, 1970).
(5) A.J.P. Martin and R.L.M. Synge, Biochem. J., 35, 1359 (1941).
(6) R.L. Grob, Chpt. 2, In: R.L. Grob, Ed., Modern Practice of Gas Chromatography, 2nd ed. (Wiley-Interscience, New York, 1985), pp. 49–114.
(7) S.G. Weber and P.W. Carr, Chpt. 1, In: P.R. Brown and R.A. Hartwick, Eds., High Performance Liquid Chromatography (Wiley-Interscience, New York, 1989), pp. 1–115.
(8) J.C. Giddings, Unified Separation Theory (Wiley-Interscience, New York, 1991).
(9) B.L. Karger, L.R. Snyder, and C. Horvath, An Introduction to Separation Science (Wiley-Interscience, New York, 1973).
(10) P.A. Bristow, Liquid Chromatography in Practice (Handforth, Cheshire, UK, 1976).
(11) L.R. Snyder, J.J. Kirkland, and J.W. Dolan, Introduction to Modern Liquid Chromatography (Wiley, New York, 3rd ed., 2010).
Howard G. Barth is with Analytical Chemistry Consultants, Ltd. in Wilmington, Delaware. Direct correspondence to: howardbarth@mail.com

New Method Explored for the Detection of CECs in Crops Irrigated with Contaminated Water
April 30th 2025This new study presents a validated QuEChERS–LC-MS/MS method for detecting eight persistent, mobile, and toxic substances in escarole, tomatoes, and tomato leaves irrigated with contaminated water.
Accelerating Monoclonal Antibody Quality Control: The Role of LC–MS in Upstream Bioprocessing
This study highlights the promising potential of LC–MS as a powerful tool for mAb quality control within the context of upstream processing.
University of Tasmania Researchers Explore Haloacetic Acid Determiniation in Water with capLC–MS
April 29th 2025Haloacetic acid detection has become important when analyzing drinking and swimming pool water. University of Tasmania researchers have begun applying capillary liquid chromatography as a means of detecting these substances.

.png&w=3840&q=75)

.png&w=3840&q=75)


.png&w=3840&q=75)


.png&w=3840&q=75)


