Chemical Fingerprinting of Mobile Volatile Organic Compounds in Soil by Dynamic Headspace–Thermal Desorption−Gas Chromatography−Mass Spectrometry
LCGC Europe
The chemical analysis of organic compounds in environmental samples is often targeted on predetermined analytes. A major shortcoming of this approach is that it invariably excludes a vast number of compounds of unknown relevance. Nontargeted chemical fingerprinting analysis addresses this problem by including all compounds that generate a relevant signal from a specific analytical platform and so more information about the samples can be obtained. A DHS−TD−GC−MS method for the fingerprinting analysis of mobile VOCs in soil is described and tested in this article. The analysis parameters, sorbent tube, purge volume, trapping temperature, drying of sorbent tube, and oven temperature were optimized through qualitative and semiquantitative analysis. The DHS−TD–GC−MS fingerprints of soil samples from three sites with spruce, oak, or beech were investigated by pixel-based analysis, a nontargeted data analysis method.
Photo Credit: ranjith ravindran/Shutterstock.com

Peter Christensen, Majbrit Dela Cruz, Giorgio Tomasi, Nikoline J. Nielsen, Ole K. Borggaard, and Jan H. Christensen, University of Copenhagen, Copenhagen, Denmark
The chemical analysis of organic compounds in environmental samples is often targeted on predetermined analytes. A major shortcoming of this approach is that it invariably excludes a vast number of compounds of unknown relevance. Nontargeted chemical fingerprinting analysis addresses this problem by including all compounds that generate a relevant signal from a specific analytical platform and so more information about the samples can be obtained. A dynamic headspace–thermal desorption–gas chromatography–mass spectrometry (DHS−TD−GC−MS) method for the fingerprinting analysis of mobile volatile organic compounds (VOCs) in soil is described and tested in this article. The analysis parameters, sorbent tube, purge volume, trapping temperature, drying of sorbent tube, and oven temperature were optimized through qualitative and semiquantitative analysis. The DHS−TD–GC−MS fingerprints of soil samples from three sites with spruce, oak, or beech were investigated by pixel-based analysis, a nontargeted data analysis method.
Environmental samples contain thousands of organic compounds in complex mixtures (1), but the chemical analysis of organic compounds in environmental samples is typically targeted at a few chemical constituents that are already known and are expected to be present (2,3,4). In contrast, chemical fingerprinting aims to analyze all compounds from a complex mixture, which can be monitored with the selected analytical platform. The concept of chemical fingerprinting was first used in the 1970s for oil hydrocarbon fingerprinting to determine the source and weathering of crude oil and refined petroleum products (5). Since then, oil hydrocarbon fingerprinting has developed extensively and modern methods can now be used to monitor more than 1000 compounds in one single analysis (6). In the 1990s, fingerprinting methods were used for metabolomics and proteomics studies (7,8), and are now also used for plant and air matrices (9,10,11). Although the overall aim of chemical fingerprinting is to obtain a complete representation of a sample (for example, the whole metabolome of a cell), no single analytical technique exists that can fulfill this aim. Analytical techniques such as gas chromatography (GC) with mass spectrometry (MS) detection and liquid chromatography (LC) with MS detection are complementary methods that can be used with varying sensitivity to monitor compounds with different physical and chemical properties (for example, volatility and polarity). Each of these methods can be tuned to address different chemical windows by the choice of chromatographic mode or ionization source. Within soil science, substances in soil that can evaporate into the atmosphere, leach to surface and sub-surface water, or can be taken up by living organisms are of great interest for environmental, human health, and food perspectives (12). Several extraction techniques have been developed to transfer VOCs from various matrices to a GC system (13,14). Most of these techniques can be grouped into solvent extraction, solidâphase extraction (SPE), gas extraction, and passive extraction (14). The U.S. Environmental Protection Agency Method 5035 for soil and waste samples recommends solvent extraction with methanol or polyethylene glycol for samples with high VOC concentration and gas extraction by purge-and-trap for VOC concentrations of less than 200 μg/kg (15). Purge-andâtrap is able to automatically extract, concentrate, and transfer analytes to a GC system with little loss to the surroundings, and this is especially useful when working with trace amounts of VOCs (16,17). Dynamic headspace (DHS) is an alternative to purge-andâtrap. In DHS the headspace above the sample, such as a soil slurry, is purged with inert gas during shaking or stirring and the VOCs are trapped on a sorbent tube. The sorbent tube is transferred to a thermal desorption unit (TDU), which is then heated for desorption (thermal desorption [TD]) of the VOCs and an inert gas carries the VOCs to the GC inlet. In this step, the direction of the gas flow thorough the desorption tube is reversed compared to the gas flow in the trapping phase. At the GC inlet the VOCs are focused, either cryogenically or by a sorbent before transfer to the GC column. By using DHS, the VOCs are dynamically removed from the sample, which mimics natural conditions better than batch extraction (18). The aim of this study was to develop and test a method for chemical fingerprinting of the mobile fraction of VOCs in soil using DHS–TD−GC−MS. Several parameters were optimized with a focus on optimal transfer of VOCs, while also reducing transfer of water. Following method optimization, soil samples representing three vegetation types were analyzed and a pixel-based chemometric approach was used to compare them to search for specific markers for land use.
Materials and Methods
Standards and Chemicals: EPA VOC Mix 6, EPA Appendix IX Volatiles Calibration Mix, and calcium chloride hexahydrate were supplied by Sigma Aldrich Denmark A/S. D8-Naphthalene (Cambridge Isotope Labs., inc.) was obtained from VWR International A/S. Stock solutions and dilutions of mixtures were prepared in methanol (HPLCâgrade, Rathburn Chemicals Ltd.) supplied by Mikrolab Aarhus A/S. Purified water was produced by a Millipore Milli Q Plus system.
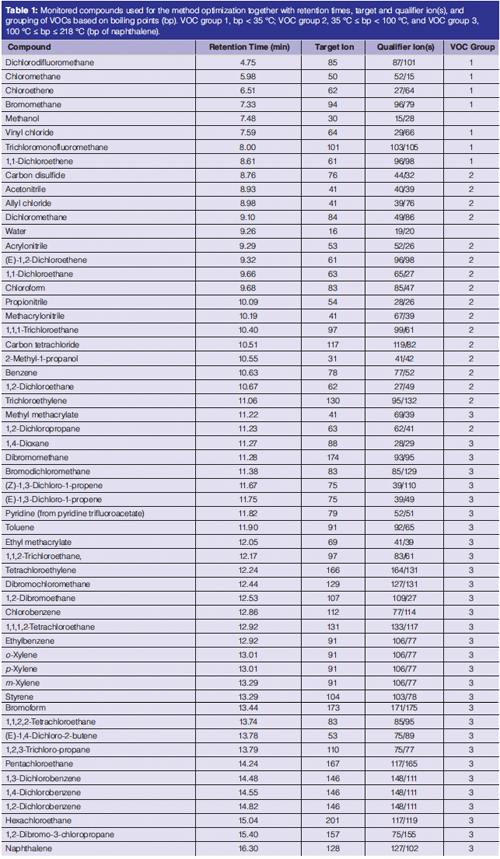
Artificial Sample for Method Optimization: A test mix of EPA VOC Mix 6 and EPA Appendix IX Volatiles Calibration Mix was prepared by adding 10 µL of each mix to 180 µL of methanol to reach a final concentration of 100 ppm for each VOC. An artificial sample was then prepared in headspace vials (20 mL) containing 5 g of Ottawa sand and 10 mL of milli-Q water spiked with 1.0 µL of the test mix. Compounds, retention times, target and qualifier ions, and VOC group for the test mix are listed in Table 1.
Soil Samples: Soil samples were collected from three closely spaced forest sites in Vestskoven in Denmark during March 2017. According to the American Soil Taxonomy system, the soils at the three sites were classified as Typic Hapludalfs, which are important, productive, mainly temperate area soils (19). Each site represents a different vegetation type: beech (Fagus sylvatica), Norway spruce (Picea abies), and oak (Quercus robur), which were planted on former farmland in the early 1960s. At each site, the top 30 cm was removed from an area of 0.5 × 0.5 m and approximately 500 g of soil from the sides of the hole at a depth of 10−20 cm were transferred to 1 L blue cap bottles. Six samples were collected from each site and transferred to the laboratory. Each bottle was filled to the neck with 0.01 M CaCl2 and shaken for 1 h in a bottomâover-end rotator at 10 rpm. From each sample, 10 mL of slurry were transferred to 20 mL amber headspace vials, avoiding plant debris floating on the top. Quality control (QC) samples were prepared by mixing 350 mL from one beech sample, 350 mL from one oak sample, and 450 mL from one spruce sample. The QC mix was shaken and 10 mL was transferred to each of six amber headspace vials. Six controls were also prepared in the same way as the soil samples but without adding soil.
Apparatus: The sample handling was performed by a MultiPurpose MPS2 autosampler equipped with a DHS station and agitator (Gerstel GmbH & Co. KG). The GC system was a 7890A with a 5973N MS (Agilent Technologies).
Analytical Method: One µL of deuterated internal standard solution (68 µg/mL d8-naphthalene in methanol) was added to each sample and was then shaken at 1500 rpm for 3 min in the DHS station. The DHS extraction was performed with a N2 purge flow of 50 mL/min for 10 min at 20 °C and analytes were trapped on sorbent tubes packed with Carbopack B + C and Carbosieve SIII (Gerstel GmbH & Co. KG) at 70 °C.
For transfer of analytes to the GC system, the sorbent tube was moved to the TDU, which was in solvent vent mode. Initially the total He flow rate was 53.5 mL/min, the septum purge flow rate was 0 mL/min (fixed), and the desorption flow rate was hence 53.5 mL/min. The TDU purge flow rate was 3 mL/min (fixed), the TDU split flow rate was 50 mL/min, and the column flow rate was 0.5 mL/min.
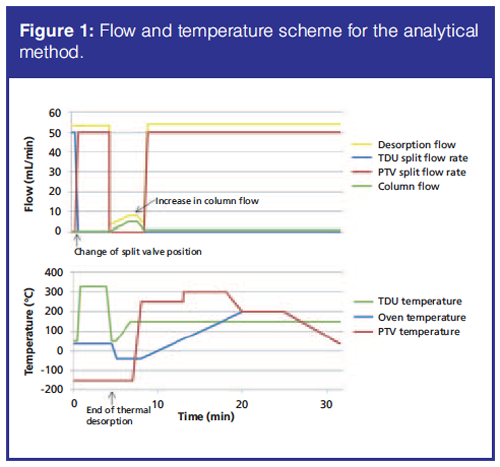
At 0.50 min (after the sorbent tube was moved to the TDU) the TDU split flow was changed to the PTV (Programmable Temperature Vaporizing) inlet split flow and kept at 50 mL/min (Figure 1). The pressure in the PTV inlet was 0.772 psi. The temperature of the TDU was held at 50 °C for 0.50 min, ramped to 330 °C at 720 °C/min, and held for 3 min (Figure 1). The analytes were cryo-focused in the liner in the PTV at -150 °C during the thermal desorption step. To avoid excessive use of liquid nitrogen, oven cooling was initiated after the thermal desorption step. The oven programme was hence started at 35 °C, decreased to - 40 °C at 120 °C/min, held for 2.875 min, increased to 200 °C at 20 °C/min, held for 5 min, and decreased to 35 °C at 25 °C/min (Figure 1). The oven reached - 40 °C but it was not possible to keep a rate of -120 °C/min. The hold time of 2.875 min was set to ensure that the -40 °C was reached. Transfer of analytes to the GC system can be improved by increasing the column flow rate before the PTV is heated. This was achieved with a column flow program starting at 0.5 mL/min, ramped to 5 mL/min at 1.95 mL/min per min, held for 1 min, and decreased to 1.1 mL/min at 5 mL/min per min (Figure 1). At the end of the flow program, the temperature program of the PTV was initiated. Here the temperature was increased by 12 °C/s to 250 °C, held for 5 min, increased by 10 °C/s to 300 °C, and held for 5 min.
The MS transfer line, ion source, and quadrupole temperatures were 230 °C, 230 °C, and 150 °C, respectively. Samples were analyzed in scan mode with a scan range of 10−300 massâtoâcharge ratio (m/z). A 30 m × 0.25 mm, 1.4-µm VF-624ms column (Agilent J&W) was used.
Optimization Steps: Several parameters were optimized for the final method: type of sorbent tube, purge volumes, trapping temperature, drying of the sorbent tube, and initial oven temperature (Table 2).

The optimization steps for sorbent tube, trapping temperature, drying of the sorbent tube, and oven temperature were performed with a 30 m × 0.15 mm, 0.85-μm VF-624ms column (Varian) and modified methods compared to the final method described above were used.
For the optimization of the purge volume, the flow was kept constant at 50 mL/min and time was set to reach the designated purge volumes. To evaluate the sorbent tubes, the DHS extractions were performed with a purge flow of 25 mL/min for 8 min. The trapping temperature was 40 °C for the Tenax-based tubes (Table 2, tubes 2 and 3) and 50 °C for the Carbopack tubes (Table 2 − tubes 1, 4 and 5).
Data Analysis: For each optimization step, peaks were integrated and divided into their respective VOC group (Table 1). Evaluation of the parameters was based on the area of the VOCs and the area of the water peak (m/z 16). Overloading of the MS system occurred for m/z 17 and m/z 18 and therefore m/z 16 was the preferred choice for determination of the area of the water peak.
The total ion chromatograms (TICs) obtained from DHS–TD–GC–MS analysis of the soil extracts were investigated using a pixel-based chemometric approach where entire sections of chromatograms are analyzed without peak extraction (20). Mass-to-charge ratios below 35 as well as m/z 44 were removed from the TIC to exclude water, oxygen, nitrogen, and carbon dioxide. Baselines were removed by piece-wise linear subtraction of the lower part of a convex hull of each chromatogram (21) and samples were aligned using correlation optimized warping (COW) (22); the optimCOW procedure devised by Skov et al. (23) was used to find the optimal warping parameters. The scans before 9.25 min were excluded prior to alignment because the large irregular shifts in the early part of the chromatogram could not be satisfactorily aligned. The TICs were subsequently normalized to Euclidean norm, thus removing information on analytical changes in signal intensity and concentration (21,24). The data were analyzed by principal component analysis (PCA), which was fitted according to a weighted least squares criterion using the inverse of the relative standard deviation of the QC samples as weights (25,26).
Results and Discussion
Optimization: One of the major challenges when analyzing VOCs in water samples and water suspensions on DHS−TD−GC−MS is to trap and isolate a large fraction of the VOCs and still eliminate water. Water can lead to chromatographic problems, such as poor peak shapes and split peaks, as well as retention time shifts as a result of solvent flooding (27). High amounts of water can also lead to carryover, higher detection limits, and poor reproducibility during the rapid heating of the inlet because of sample expansion beyond the capacity of the liner volume. Type of sorbent tube, purge volume, temperature during trapping, drying of the sorbent tube, and initial oven temperature were optimized to reduce the amount of water transferred from the sample while still obtaining high extraction efficiency and transfer of the VOCs from the sorbent tube to the GC column. The method targeted compounds with boiling points up to 218 °C. However, compounds with different boiling points were not necessarily affected the same way during extraction, trapping, transfer, and analysis. Therefore, the optimization parameters were evaluated based on a division of the VOCs into three groups. VOC group 1 included compounds with boiling points below 35 °C. These can easily volatilize at the sampling site and can be difficult to sample. VOC group 2 included compounds with boiling points between 35 °C and 100 °C. These are still very volatile, but are easier to sample compared to VOC group 1. VOC group 3 included compounds with boiling points between 100 °C and 218 °C. These are less likely to volatilize during sampling, but are also harder to extract with DHS than VOC groups 1 and 2 because they have a lower vapour pressure.
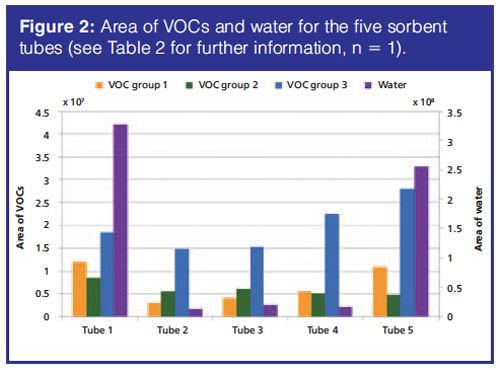
The most suitable sorbent tube traps all VOCs and is able to release them again during thermal desorption in the TDU, but does not trap any water and does not affect the VOC composition. Five sorbent tubes were tested for the trapping of VOCs. VOCs with boiling points below 100 °C (VOC groups 1 and 2) are likely be found at lower concentrations in soil samples than VOCs with boiling points above 100 °C as a result of volatilization in the field. Tube 1 was selected for the final analytical method because it provided the most efficient trapping of these low-boiling point VOCs and was the only sorbent tube that was able to trap the most volatile compound, dichlorodifluoromethane (Figure 2).
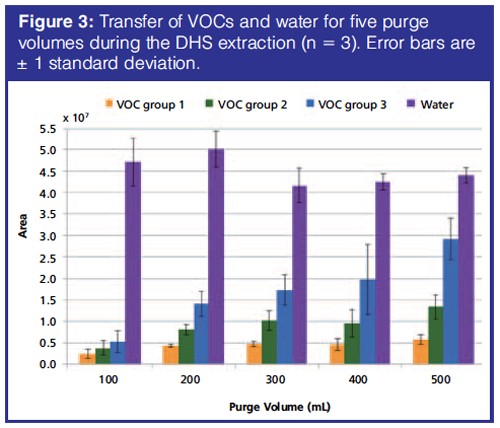
The purge volume for extraction should ensure highest possible transfer of VOCs, but not at the expense of also transferring a lot of water. Initial screening indicated that purge volumes of 30−400 mL during the DHS extraction were optimal and therefore purge volumes between 100−500 mL were tested in triplicates. The amount of water transferred to the sorption tube was relatively stable for the evaluated purge volumes (Figure 3). Transfer of VOCs largely increased with increasing purge volume, with VOC group 3 more affected than VOC groups 1 and 2. The optimal purge volume for all VOC groups was at 500 mL (Figure 3) and not at 300−400 mL as was found in the initial screening tests.
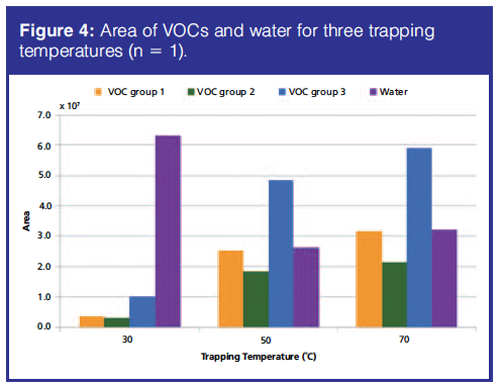
By increasing the trapping temperature, trapping of water can be limited. Trapping temperatures of 30 °C, 50 °C, and 70 °C were tested once. At trapping temperatures of 50 °C and 70 °C, trapping of water was reduced by approximately 50% compared to a trapping temperature of 30 °C (Figure 4). VOCs were trapped the least at 30 °C and slightly better at 70 °C than at 50 °C (Figure 4). The trapping temperature of 70 °C was therefore chosen.
Another way to remove water is by drying the sorption tubes in either the DHS station or in the TDU. Drying in the DHS station was performed with a N2 flow through the tube (from the bottom and up), in the same way as the headspace was purged during the trapping. In the TDU, the drying was performed with a He flow from the top of the sorption tube to the bottom. The removal of water and VOCs was tested with a drying temperature of 70 °C, a flow of 35 mL/min in the TDU and DHS station, and with flow volumes in the range of 0−225 mL. Drying did not improve the VOC–water ratio and was therefore not implemented in the analytical method.
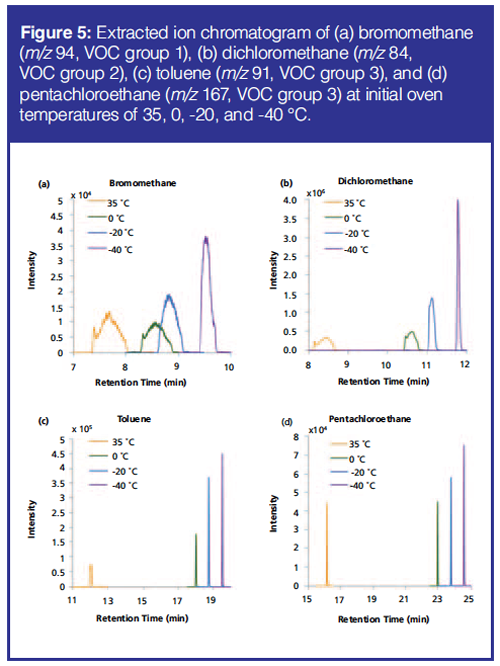
For the successful transfer of VOCs to the GC system, initial oven temperatures were also evaluated. The oven was cooled to initial temperatures of -40 °C, -20 °C, 0 °C, and 35 °C by the use of liquid nitrogen (except for 35 °C). The initial temperature of - 40 °C gave the highest and narrowest peaks (Figure 5); this was further improved for the final method using the same column as before with a larger inner diameter (0.25 mm instead of 0.15 mm) and film thickness (1.4 µm instead of 0.85 µm) leading to improved focusing on the column. The effect of the initial oven temperature was not seen for the very late-eluting compounds (Figure 5).
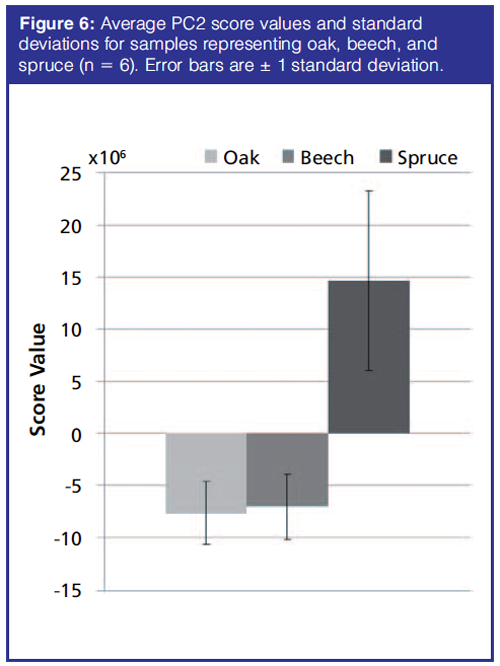
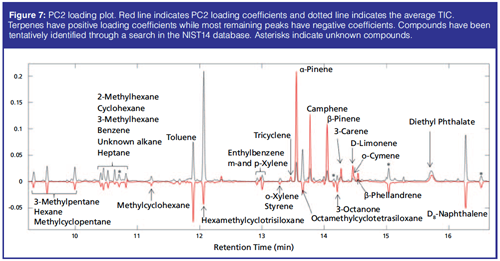
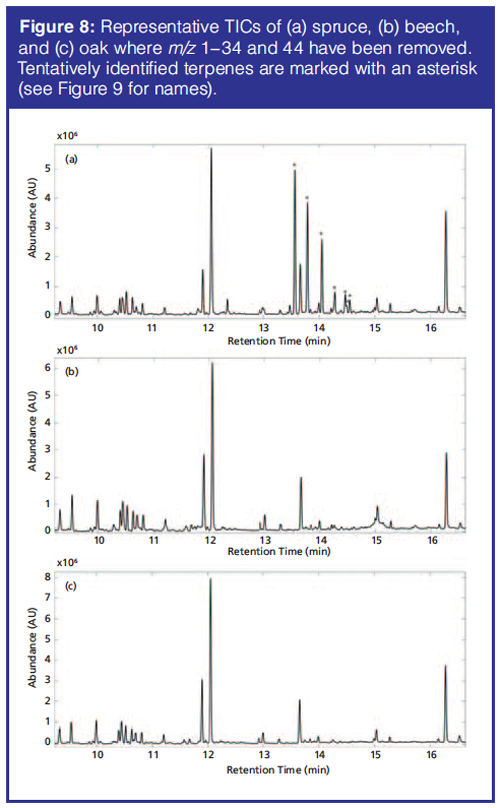
Soil Samples: The PCA of the preprocessed TICs showed a clear separation of spruce samples from the remaining samples along principal component (PC) 2. PC1 described variations in hexamethylcyclotrisiloxane, octamethylcyclotrisiloxane, and diethyl phthalate. Spruce samples have positive PC2 score values while beech and oak samples have large negative PC2 scores (Figure 6). The separation in the PCA score plot can be explained from the corresponding loading plot (Figure 7). The positive scores indicate that the spruce samples contain relatively more (with respect to the average sample, which has score 0 by definition) of the compounds whose peaks have positive PC2 loading coefficients and relatively less of those with negative coefficients. For beech and oak samples the opposite is the case. Representative TICs of soil extracts from spruce, beech, and oak forest show that the TICs of soil extracts from spruce forest contain a number of peaks with positive PC2 loading coefficients that are not present in soil extracts from the beech and oak forests (Figure 8). The peaks with the largest PC2 loading coefficients were tentatively identified via a search in the NIST14 database. The majority of peaks with positive PC2 loading coefficients were terpenes, while peaks with negative PC2 loading coefficients were peaks that could also be found in the blank samples, such as d8-naphthalene and hexamethylcyclotrisiloxane (Figure 7). The terpenes tentatively identified were α-pinene, β-pinene, camphene, 3-carene, D-limonene, o-cymene, and β-phellandrene.
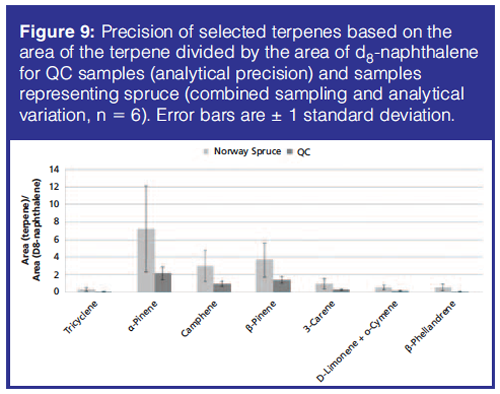
In Figure 9 the precision of the terpenes is given based on the relative peak areas of the terpenes with respect to d8-naphthalene for the quality control (QC) samples and the samples representing spruce. The samples representing beech and oak did not contain any of the terpenes. The precision of samples representing spruce was influenced by sample heterogeneity, as well as sampling and analytical variations. The QC samples were used to determine the analytical precision (repeatability) of the analytical method because these samples are analytical replicates. The repeatability calculated as relative standard deviations of the d8-naphthalene standardized peak areas of terpenes in the QC samples was on average 27.5% (range 22.2–32.4%) and the sampling and analytical variation was on average 59.4% (range 46.1–68.1%) when calculated based on soil samples representing spruce. This means that the sampling variation can be estimated to an average value of 52.7%. These results demonstrate that the analytical uncertainty is acceptable and only contributes a little to the total uncertainty (59.4%).
With an unknown chemical profile of soil samples the benefit of calculating recoveries for the compounds in the test mixture is limited because these are not necessarily the compounds that are detected in the soil samples. All compounds in the test mix were detected at a level of 10 ng/mL in the artificial samples. The signal-to-noise ratio (S/N) was calculated for bromomethane, dichloromethane, toluene, pentachloroethane, and naphthalene as representatives of the three VOC groups. The S/N was in the range of 1300–6000 for the selected compounds in the test mix, which indicates that detection limits for these compounds are in the range of 5–23 ng/L.
The method was optimized to allow for nontargeted fingerprinting of soil samples. The method optimization was therefore based on peak areas and the chemometric analysis was performed on TICs. Thus only qualitative and semiquantitative data were presented. The nontargeted approach included all compounds that were detected compared to a targeted approach where only known constituents are analyzed. This provides improved information about the samples, and in this case, explains why soil samples from a spruce forest are different from soil samples from beech and oak forests. This could potentially lead to identification of new biomarkers for land use. For full quantitative analysis, it would be necessary to run standards and obtain better estimates of detection limits and limit of quantifications and recoveries specifically for the terpenes detected in the nontargeted fingerprinting to improve their applicability as a biomarker for land use.
Conclusion
A DHS−TD−GC−MS method was successfully optimized through qualitative and semiquantitative analysis and applied to soil samples representing spruce, oak, and beech. Nontargeted chemical fingerprinting analysis of the TICs of soil sample extracts showed that soil samples representing spruce differed from soil samples representing beech and oak because of the presence of terpenes. The optimized method was successfully used for the comparison of VOCs in soil samples from the three forest areas and for detection of terpenes as potential biomarkers for land use. The fingerprinting approach could be useful in other areas of research, such as metabolomics and petroleomics, and is not limited to environmental samples.
Acknowledgement
The authors acknowledge the Water Research Initiative at the University of Copenhagen for funding the PhD project of Peter Christensen.
References
- Z.Y. Zhang and J. Pawliszyn, Journal of High Resolution Chromatography16, 689–692 (1993).
- S.E. Reichenbach, X. Tian, C. Cordero, and Q.P. Tao, Journal of Chromatography A1226, 140–148 (2012).
- S.W. Simpkins, J.W. Bedard, S.R. Groskreutz, M.M. Swenson, T.E. Liskutin, and D.R. Stoll, Journal of Chromatography A1217, 7648–7660 (2010).
- Y. Watabe, T. Kubo, T. Nishikawa, T. Fujita, K. Kaya, and K. Hosoya, Journal of Chromatography A1120, 252–259 (2006).
- J.S. Mattson, C.S. Mattson, M.J. Spencer, and S.A. Starks, Analytical Chemistry49, 297–302 (1977).
- Z.D. Wang, M. Fingas, S. Blenkinsopp, G. Sergy, M. Landriault, L. Sigouin, J. Foght, K. Semple, and D.W.S. Westlake, Journal of Chromatography A809, 89–107 (1998).
- J.K. Nicholson, J.C. Lindon, and E. Holmes, Xenobiotica29, 1181–1189 (1999).
- D.R. Stoll, X.L. Wang, and P.W. Carr, Analytical Chemistry80, 268–278 (2008).
- M. Cirlini, C. Dall’Asta, A. Silvanini, D. Beghe, A. Fabbri, G. Galaverna, and T. Ganino, Food Chemistry134, 662–668 (2012).
- J. Degenhardt, T.G. Kollner, and J. Gershenzon, Phytochemistry70, 1621–1637 (2009).
- O.O. Kuntasal, D. Karman, D. Wang, S.G. Tuncel, and G. Tuncel, Journal of Chromatography A1099, 43–54 (2005).
- C.G. Pinto, S.H. Martin, J.L.P. Pavon, and B.M. Cordero, Analytica Chimica Acta 689, 129–136 (2011).
- K. Demeestere, J. Dewulf, B. De Witte, and H. Van Langenhove, Journal of Chromatography A1153, 130–144 (2007).
- N. Jakubowska, B. Zygmunt, Z. Polkowska, B. Zabiegala, and J. Namiesnik, Journal of Chromatography A1216, 422–441 (2009).
- U.S. Environmental Protection Agency, Method 5035: Closed
- system purge-and-trap extraction for volatile organics in soil and waste samples (U.S. Environmental Protection Agency, 1–24, 1996).
- M. Rosell, S. Lacorte, and D. Barcelo, Journal of Chromatography A1132, 28–38 (2006).
- U.S. Environmental Protection Agency, Method 5030: Purge-and-trap for aqueous samples (U.S. Environmental Protection Agency, 1–28, 2003).
- P.S. Fedotov, W. Kordel, M. Miro, W.J.G.M. Peijnenburg, R. Wennrich, and P.M. Huang, Critical Reviews in Environmental Science and Technology42, 1117–1171 (2012).
- Soil Survey Staff, Soil Taxonomy, A Basic System of Soil Classification for Making and Interpreting Soil Surveys (2nd Edition, Agriculture Handbook No 436, United State Department of Agriculture, Washington, 1999).
- J.H. Christensen, G. Tomasi, and A.B. Hansen, Environmental Science & Technology39, 255–260 (2005).
- J.H. Christensen, G. Tomasi, A.D. Scofield, and M.D.G. Meniconi, Environmental Pollution158, 3290–3297 (2010).
- N.P.V. Nielsen, J.M. Carstensen, and J. Smedsgaard, Journal of Chromatography A805, 17–35 (1998).
- T. Skov, F. van den Berg, G. Tomasi, and R. Bro, Journal of Chemometrics20, 484–497 (2006).
- F.D.C. Gallotta and J.H. Christensen, Journal of Chromatography A1235, 149–158 (2012).
- J.H. Christensen and G. Tomasi, Journal of Chromatography A1169, 1–22 (2007).
- H.A.L. Kiers, Psychometrika 62, 251–266 (1997).
- K. Grob Jr., Journal of Chromatography 213, 3–14 (1981).
Peter Christensen is laboratory manager at the University of Copenhagen, Denmark. He works with sample preparation and chromatographic separation in combination with mass spectrometry.
Majbrit Dela Cruz is research coordinator at the University of Copenhagen. She has a Ph.D. in horticulture where she used the fingerprinting approach for analysis of plant-mediated removal of volatile organic compounds.
Giorgio Tomasi is assistant professor at the University of Copenhagen. He develops chemometric tools and analyzes big data.
Nikoline J. Nielsen is assistant professor at University of Copenhagen. She works with chromatographic separation and mass spectrometry together with chemometric data analysis.
Ole K. Borggaard has been a professor in soil chemistry and pedology at the University of Copenhagen for more than 20 years. He is now retired but still attached to the university as professor emeritus.
Jan H. Christensen is a professor of environmental analytical chemistry. He is leader of the analytical chemistry group at the University of Copenhagen and heads the research centre for advanced analytical chemistry. He works on all aspects of contaminant fingerprinting, petroleomics, and metabolomics.

New Method Explored for the Detection of CECs in Crops Irrigated with Contaminated Water
April 30th 2025This new study presents a validated QuEChERS–LC-MS/MS method for detecting eight persistent, mobile, and toxic substances in escarole, tomatoes, and tomato leaves irrigated with contaminated water.
University of Tasmania Researchers Explore Haloacetic Acid Determiniation in Water with capLC–MS
April 29th 2025Haloacetic acid detection has become important when analyzing drinking and swimming pool water. University of Tasmania researchers have begun applying capillary liquid chromatography as a means of detecting these substances.

.png&w=3840&q=75)

.png&w=3840&q=75)


.png&w=3840&q=75)


.png&w=3840&q=75)


