But My Peaks Are Not Gaussian! Part III: Physicochemical Causes of Peak Tailing
Although symmetric peaks with Gaussian shapes are predicted by models of the chromatographic process, “perfect peaks” are not observed often outside of textbooks. Several physicochemical phenomena can lead to asymmetric peak shapes, including analyte adsorption to different types of sites within the stationary phase and overload tailing, which may involve a variety of factors. Understanding these phenomena can help identify whether the cause of asymmetry is most likely to have a physical or chemical origin, which in turn dictates which troubleshooting steps to start with when dealing with poor peak shapes.
In the first two parts of this series of "LC Troubleshooting" articles, I've written about basic concepts in peak asymmetry (1) and physical problems that can lead to fronting or tailing peaks (2). Although there are many ways things can go wrong in a purely physical sense that will lead to asymmetric peaks, addressing these problems, or even preventing them altogether, is generally more straightforward than dealing with causes of asymmetry that have chemical components. As a separation science community, we understand a lot about chemical causes of peak asymmetry, but there are some observations for which we don’t have clear explanations, and this is an open area of research in both academic and industrial laboratories. For this third part of this series, I’ve asked Professor David McCalley to join me to address some causes of peak asymmetry that have chemical components, discussing both the aspects we understand, and those where there is less clarity. David has studied chemical causes of poor peak shape in both reversed-phase and HILIC separations, and is one of the world’s foremost experts on the topic.
Dwight Stoll
A large majority of the literature describing studies of physicochemical causes of peak asymmetry in liquid chromatography (LC) has been focused on reversed-phase (RP) columns prepared with stationary phases built upon silica-based substrates. This focus on RP columns does not mean these problems are not important for other separation modes, or stationary phases built upon other substrates. However, the primary focus of this installment is on RP separation conditions and stationary phases involving silica particles because of their predominant use in LC.
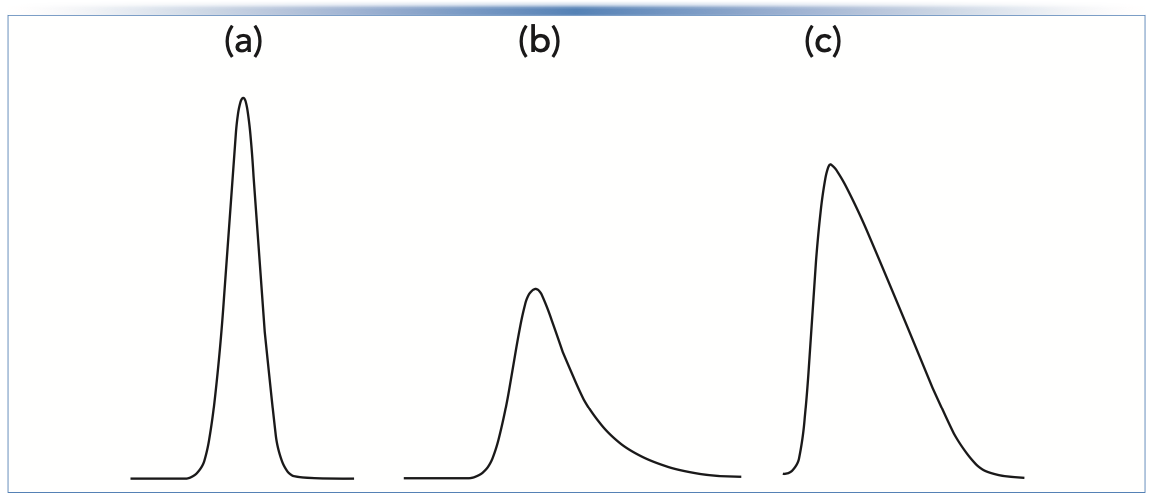
In Part 1 of this series, we focused mainly on the type of peak tailing we refer to as exponential tailing, which is where the observed peak shape exhibits a kind of mixture of Gaussian and exponential distribution shapes that can be modeled nicely using a convolution of the two distributions. Some physicochemical causes of peak tailing lead to this type of exponential tailing. However, other causes lead to a different type of peak shape, which is referred to here as overload tailing. This shape is also sometimes referred to as a “shark fin” or “sailboat.” A comparison of the two shapes is shown in Figure 1. The distinct character of these peak shapes can be quite helpful for diagnosing the cause of peak tailing in many cases.
In Part I, we discussed two metrics used to quantify the extent of peak asymmetry—the asymmetry factor (As), and the tailing factor (TF). The apparent column efficiency (that is, plate number N) can also be used to quantify the effect that peak asymmetry has on making the peak broader. This is also illustrated in Figure 1. In the case of gradient elution separations, the peak capacity—roughly a measure of how many compounds could be separated in a given analysis if the peaks are neatly arranged side-by-side without any wasted space or peak overlap—can also be used to quantify the deterioration in separation in performance because of peak asymmetry.
FIGURE 1: Illustration of the difference between (b) “exponential tailing” and (c) “overload tailing”. The peaks in (a) and (b) were calculated using the Gaussian and exponentially modified Gaussian distributions, respectively. The peak in (c) is a portion of an experimental chromatogram. The plate numbers (N; estimated at half-height) provide a quantitative sense for the effect of tailing that makes peaks broader, and are given as follows: (a) Gaussian N = 10,000; (b) exponential tailing, N = 2,800; and (c) overload tailing, N =1,700.
Exponential Tailing: Causes and Remedies
The exponential type of peak tailing illustrated in Figure 1 is most commonly observed when working with the protonated and positively charged form (BH+) of amine-containing analytes, and silica-based stationary phases for RPLC. Although this particular situation has been discussed several times in prior “LC Troubleshooting” articles (3,4), it is useful to briefly review the main points again because the chromatographic behavior and remedies for this cause of peak tailing are different from other causes. In other words, one has to properly diagnose the cause of the tailing before selecting a remedy that is appropriate. Most silica-based stationary phases for RPLC are prepared by covalently bonding an organosilane carrying the stationary phase ligand (such as C18) to silanol groups at the surface of the silica particle. In spite of advances in methods over the years to convert as many of the surface silanols to siloxanes carrying the stationary phase ligand as possible, it is practically very difficult to convert all of them, which means that after the bonding step, a significant population of unreacted, free silanols will remain. There may also be another population of unreacted silanols inaccessible to analytes that do not take part in retention or tailing processes. Silanol groups are Bronsted acids and can donate a proton to the mobile phase to produce an anionic Si O- group. A typical pKa for this dissociation reaction is approximately five, but can be greatly affected by the type of silanol group (for example, the local bonding of isolated, geminal, or vicinal silanols) and the purity of the bulk silica. Most notably, metal impurities in the silica can significantly depress the pKa, leading to substantial ionization of silanol groups in mobile phases buffered as low as pH 3 or less. Readers interested in learning more about the chemistry of silica substrates can find additional material in the literature (5). Analytes that both have some lipophilic character and a positive charge (for example, an ionized amine, BH+) can then interact with the stationary phase in very different ways. The electrostatic interaction between BH+ and Si O- will be energetically strong, but in most cases the surface concentration of accessible Si O- sites will be low compared to the concentration of lipophilic ligands that give the material its RP character. On the other hand, the dispersive interaction between the lipophilic parts of the analyte and the stationary phase ligand is energetically relatively weak. These differences in interaction strengths and site concentrations can lead to exponential tailing like that shown in Figure 1.
The depression of silanol pKa by metal impurities in the silica is most serious with older “Type A” silicas. Modern manufacturing methods used to make purer “Type B” silicas have reduced the seriousness of the problem with modern RPLC columns, however the mitigation of this problem has been accompanied by a loss of diversity in the selectivity of C18 phases. In other words, as the silica substrates used for making RPLC phases have become purer, the selectivities of the resulting phases have also become more homogeneous (6).
An important characteristic of exponential tailing caused by the interaction of cationic analytes with anionic silanol sites is that the peak shape may improve as more analyte mass is injected. When a very low mass of analyte is injected, the anionic silanol sites play a major role in the observed retention of the analyte. However, as more mass is injected, these sites become saturated, and the less energetic but more abundant lipophilic interaction sites play a more important role in determining the peak shape, which appears to improve. In cases where the observed tailing appears to be the exponential type, and the analyte is likely positively charged in the mobile phase, decreasing the mobile phase may help improve the peak shape. The extent to which it must be decreased to make a difference will depend on the silica type. With Type B silicas going down to pH 3 is often sufficient, but with Type A silicas further decreasing to pH 2 may help.
Overload Tailing: Causes and Remedies
The type of peak tailing referred to as overload tailing—also illustrated in Figure 1—is characterized by behavior quite different from exponential tailing. Whereas with exponential tailing better peaks are observed when more mass is injected, with overload tailing better peaks are observed when less mass is injected. And whereas with exponential tailing injecting more mass generally causes the peak height to increase without significantly changing the retention time at the peak apex, with overload tailing injecting more mass usually leads to a significant decrease in retention time measured at the peak apex, and the peak shapes themselves are distinctive with a “shark fin” like appearance. It is important to recognize that both exponential and overload tailing may occur together for a specific solute in a given separation, with the resulting peak shape being a mixture of those shown in Figures 1a and 1b.
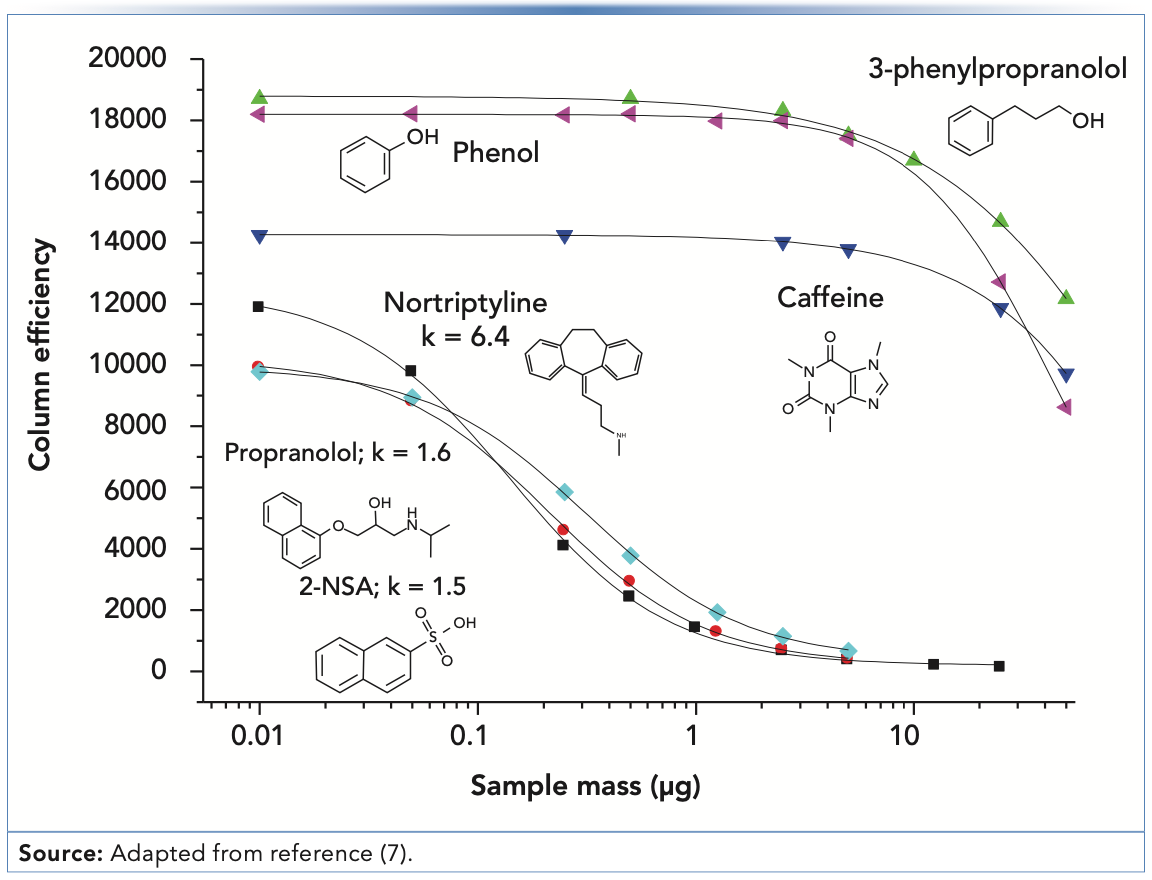
Figure 2a shows that the peak shape for propranolol—a drug molecule with a strongly basic secondary amine functional group (pKa for the protonated form is approximately 9)—is not too bad when 0.05 μg are injected, but just doubling the mass injected to 0.10 μg leads to a significant shift of the peak apex to the left, and a clear appearance of the characteristic “shark fin” peak shape. A useful way of quantifying the deterioration in the peak shape with increasing injected analyte mass is to plot the apparent plate number (N) vs. the injected mass, as shown in Figure 3. Here, we see that the decrease in plate number is less than 10% for propranolol when moving from 0.01 to 0.05 μg injected mass. However, injecting any more mass results in dramatic losses in efficiency, and when 3 μg is injected, only about 10% of the original efficiency remains (that is, 90% has been lost). Similar results were obtained with the protonated base nortriptyline. On the other hand, injecting increasing masses of the non-ionogenic compounds caffeine, 3-phenylpropanol, and phenol over the range of 0.01 to 3 μg does not result in decreased efficiencies; measurable losses in the plate number are not observed until approximately 7 μg are injected (7). Up to this point, these results appear to be consistent with a mechanism similar to that described above that involves two different sites of interaction between the analyte and stationary phase, characterized by very different interaction energies; indeed, such an overloading mechanism was proposed by Guiochon in a comprehensive series of papers (8), although the physical identity of these sites was not exactly specified. However, the same type of phenomenon observed with propranolol is also observed experimentally with the strongly acidic analyte 2-naphthalenesulphonic acid—as shown in Figure 2b—which is deprotonated and anionic at most pH values in the mobile phase. The mechanism described above where the anionic silanol site plays a central role in the tailing peak shapes observed for cationic amine-containing analytes cannot easily be used to explain the observation of overload tailing for the sulfonic acid, nor the similarities in overloading behavior obtained when organic polymer columns were used instead of silica-octadecylsilyl (ODS). A different mechanism has been proposed that involves mutual repulsion (or partial ionic exclusion from the stationary phase pores) of analytes of the same charge that leads to peak broadening and the types of peaks shapes shown in Figure 2 (9). The central idea is that the first analyte molecules that adsorb to the stationary phase create a kind of island of immobilized charge. In the absence of a significant concentration of buffer ions in the mobile phase, additional analytes of the same charge traveling downstream from the column inlet are repelled by the analyte ions already adsorbed to the stationary phase, and will continue traveling downstream until they encounter a stationary phase zone that does not already have analyte ions bound. This event broadens the peak and gives rise to the peak shapes shown in Figure 2. This type of mechanism can be used to explain results observed for both cationic and anionic analytes, and stationary phases based either on silica substrates or other materials.
FIGURE 2: Chromatograms that show the classical overload tailing behavior for both (a) a strongly basic analyte (propranolol), and (b) a strongly acidic analyte (naphthalenesulphonic acid), both of which are ionized in the mobile phase under the conditions of the experiment. As more analyte mass is injected, the peak apex moves to shorter times. Chromatographic conditions: column, Waters Xterra MS (150 mm x 4.6 mm i.d., 3.5-μm); flow rate, 1.0 mL/min.; mobile phase, 28:72 acetonitrile:water, with 20 mM formic acid in both solvent reservoirs (pH 2.7); temperature, 30 °C.
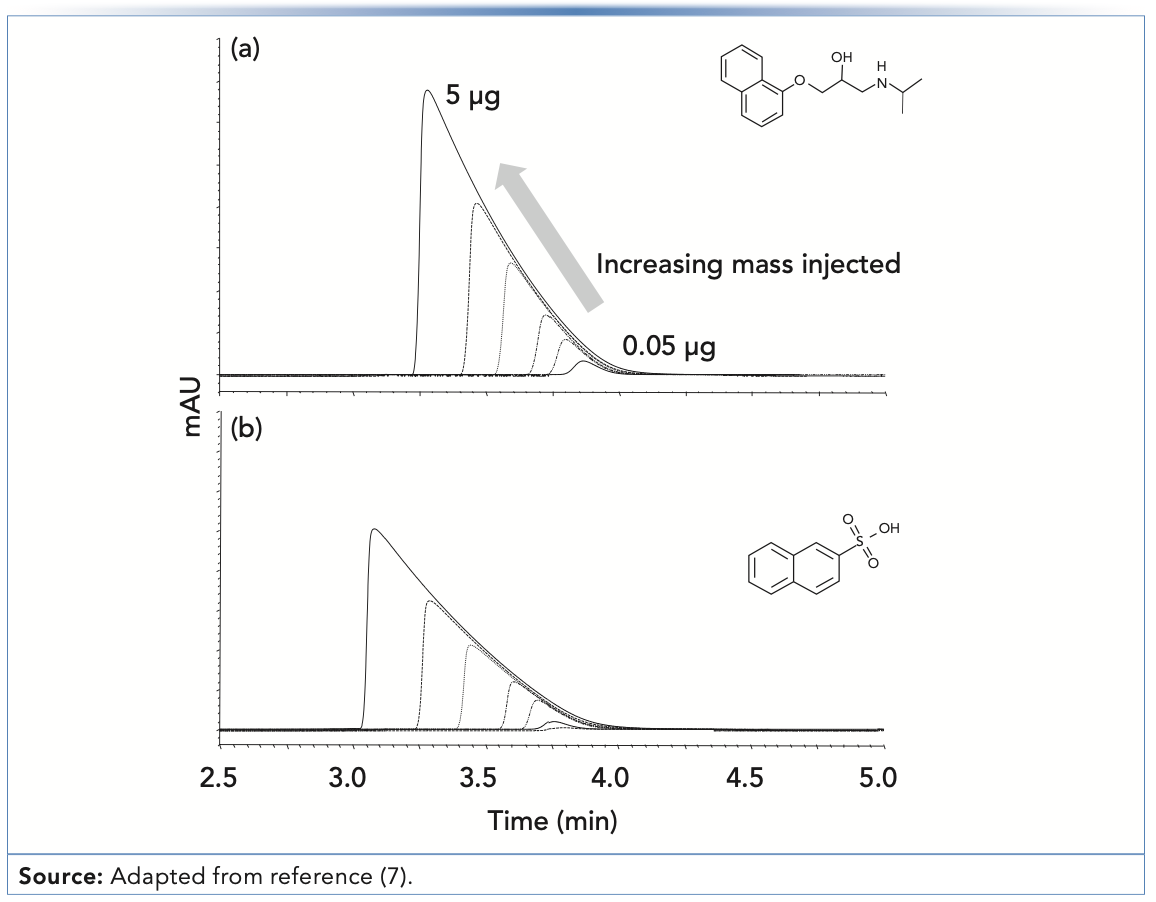
FIGURE 3: Dependence of the apparent column efficiency (N) on the mass of analyte injected for strongly basic (propranolol, nortriptyline), strongly acidic (2-naphthalene sulphonic acid) and neutral (caffeine, 3-phenylpropanol, phenol) compounds. The efficiency deteriorates much more quickly with increasing mass injected for the ionizable compounds than with the neutral compounds. Conditions are the same as those described for Figure 2.
Further study of the conditions that lead to overload tailing has also revealed some potential remedies to the problem. If the mutual repulsion mechanism described above is correct, then we would expect that loss of efficiency would occur as the injected mass is increased when a greater fraction of the analyte is ionized. This idea can be examined by varying the effect of mobile phase pH on peak shape over a range that will lead to variation in the fraction of the analyte that is ionized. It was indeed shown that much smaller overload effects for the basic drug amitriptyline were obtained at high pH where it is mostly uncharged compared with low pH where it is mostly charged (10). This suggests that adjusting the mobile phase pH can be a powerful tool for managing overload tailing when it is observed. There are limitations to this approach—most silica-based columns are not very stable above a pH of 8 (5), and not all analytes will change their ionization state in response to change in pH (for example, sulphonates and phosphates are almost always anionic, and quaternary amines will always be cationic).
In addition to using the mobile phase pH as a tool to manage overload tailing, adjusting the composition of the mobile phase buffer can also be very effective. From the concept of the mutual repulsion mechanism, we would also expect that increasing the ionic strength of the mobile phase buffer should improve peak shape in cases where overload tailing is observed, because the buffer ions can shield analyte ions entering the column from those already adsorbed to the stationary phase. The results in Figure 4 and Table I provide some evidence for this effect. Figure 4 shows a comparison of peak shapes obtained for a mixture of basic peptides in mobile phases containing either 20 mM formic acid (FA) or 8 mM trifluoroacetic acid (TFA). In this case the concentration was adjusted so that the pH of the two mobile phases would be about the same, thereby eliminating pH as a variable in the experiment. From the chromatograms we can clearly see that the peak shapes are qualitatively much better in the TFA mobile phase, and that they overload much more quickly in the FA mobile phase compared to the TFA mobile phase. These effects are quantified in Table I for both the FA and TFA mobile phases, as well as two other mobile phases—one with ammonia added to FA to increase the ionic strength as ammonia is protonated to give ammonium ions, and another with potassium chloride added to FA. Here we see that—using peak asymmetry as a metric—simply adding ammonia to the FA mobile phase improves the peak significantly (compare As of 1.5 to As of 1.9), and that the benefit increases as the mass of peptide injected increases (compare As of 1.7 positively charged in the mobile to As of 3.5). Adding potassium chloride the FA mobile phase improves the peak shape further, to the point where the performance is practically indistinguishable from the TFA mobile phase. Whereas plate number or efficiency is a convenient measure of the change in peak width under isocratic conditions, peak capacity can be used as a similarly convenient measure of changes in peak width when gradient elution is used. By this metric as well, the biggest change is observed when additional strength is added to the FA mobile phase, especially when a larger mass of peptide is injected.
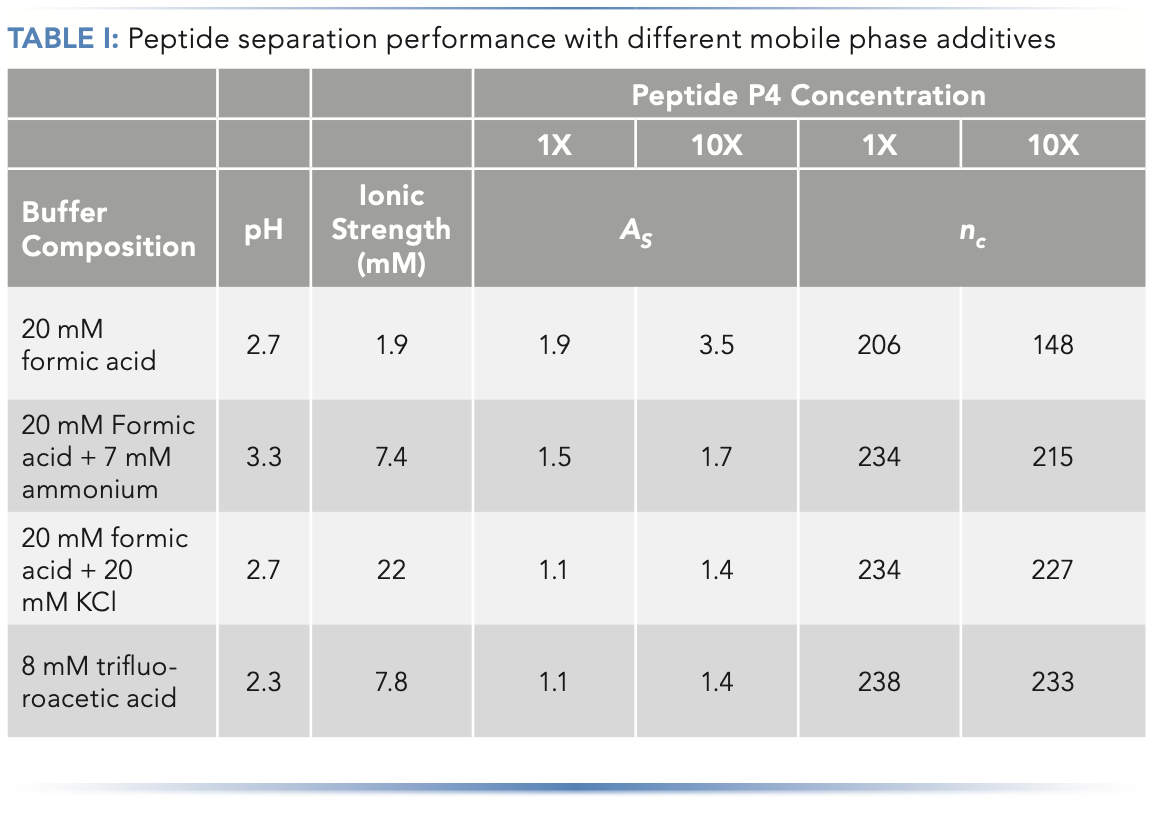
FIGURE 4: Comparison of peptide peak shapes obtained with mobile phases containing either (a) 20 mM formic acid, or (b) 8 mM trifluoroacetic acid. Chromatographic conditions: column, 250 mm x 4.6 mm i.d. Discovery C18; flow rate, 1.0 mL/min.; gradient elution from 5 to 42.5 %B in 30 min.; Both (a) (water) and (b) (acetonotrile) solvents contain acid at the concentration indicated. The basic peptide standard mixture (Alberta Peptide Institute; Edmonton, Ontario, Canada) was either injected as-is, or diluted 10-fold.
These results teach us that increasing the ionic strength of the mobile phase can be a powerful tool for mitigating overload tailing for ionogenic compounds. The simplest means for doing this without changing the mobile phase pH, which can affect retention and selectivity, is to add an inorganic salt such as potassium chloride. Unfortunately, adding inorganic salt is not desirable when using certain detectors such as mass spectrometry (MS) or light scattering, because these additives are not volatile and will lead to contamination of the detector. Some salts may also be corrosive towards LC systems built from stainless steel parts. When using these detectors, use of additives such as ammonium formate or ammonium acetate is preferred, though this is more complicated because such additions will also affect the mobile phase pH.
Summary
In this installment of "LC Troubleshooting," we discussed two major physicochemical causes of peak tailing in RPLC, and some potential remedies for them. These problems often manifest with different chromatographic behaviors, which can be useful for identifying which of them is a major problem when troubleshooting poor peak shapes. When exponential tailing is observed for basic compounds (such that they are protonated and positively charged in the mobile phase), increasing the injected mass of analyte may improve the peak shape, with little effect on the retention time. In some cases, decreasing the mobile phase pH (to pH 3 for Type B silicas, or pH 2 for Type A silicas) may improve the peak shape. When overload tailing is observed (for either anionic or cationic analytes), peaks will have a distinctive "shark fin" shape, and increasing the injected mass of the analyte will usually cause a significant shift in the peak apex to shorter times. In this case, adjusting the mobile phase pH to decrease the fraction of analyte that is ionized in the mobile phase may decrease the degree of overloading, and improve the peak shape (that is, increasing the pH for bases, and decreasing the pH for acids). Finally, increasing the ionic strength of the mobile phase buffer may also help through the addition of inorganic salts or MS-friendly salts such as ammonium formate or acetate.
References
(1) D.R. Stoll, LCGC N. Am. 39, 353–362 (2021).
(2) D.R. Stoll, LCGC N. Am. 39, 409–413 (2021).
(3) J. Dolan, LCGC N. Am. 21, 612–616 (2003).
(4) J. Dolan, LCGC N. Am. 7, 476–482 (1989).
(5) U.D. Neue, HPLC Columns: Theory, Technology, and Practice (Wiley-VCH, New York, 1997).
(6) L.R. Snyder, J.W. Dolan, D.H. Marchand, and P.W. Carr, The hydrophobic-subtraction model of reversed-phase column selectivity, in Advances in Chromatography (CRC Press, Boca Raton, 2012), pp. 297–376.
(7) D.V. McCalley, Anal. Chem. 78, 2532–2538 (2006). https://doi.org/10.1021/ac052098b.
(8) F. Gritti and G. Guiochon, Anal. Chem. 77, 1020–1030 (2005). https://doi.org/10.1021/ac040163w.
(9) I. Hägglund and J. Ståhlberg, Journal of Chromatography A. 761, 3–11 (1997). https://doi.org/10.1016/S0021-9673(96)00845-X.
(10) D.V. McCalley, Journal of Chromatography A. 1217, 858–880 (2010). https://doi.org/10.1016/j.chroma.2009.11.068.
(11) D.V. McCalley, Journal of Chromatography A. 1038, 77–84 (2004). https://doi.org/10.1016/j.chroma.2004.03.038.
About the Co-Author
David McCalley is Professor of Bioanalytical Science at the University of the West of England, U.K. In 2021, 2019, 2015 and 2013, he was named one of the world’s 100 most influential analytical scientists by ‘Analytical Science’ magazine. He was awarded the Silver Jubilee medal of the Chromatographic Society in 2008. In the past five years, he has given invited lectures in Cannes, Cambridge MA, Princeton, Geneva, Helsinki, Cork, Paris, Prague, Balaton and Sandefjord. His research aims to elucidate separation effects in LC such as influence of pressure and temperature on retention and efficiency, mixed mechanisms for strongly basic compounds, performance of superficially porous packings, and overloading effects in RP and HILIC.

About the Column Editor
Dwight R. Stoll is the editor of “LC Troubleshooting.” Stoll is a professor and the co-chair of chemistry at Gustavus Adolphus College in St. Peter, Minnesota. His primary research focus is on the development of 2D-LC for both targeted and untargeted analyses. He has authored or coauthored more than 75 peer-reviewed publications and four book chapters in separation science and more than 100 conference presentations. He is also a member of LCGC’s editorial advisory board. Direct correspondence to: LCGCedit@mmhgroup.com


Polysorbate Quantification and Degradation Analysis via LC and Charged Aerosol Detection
April 9th 2025Scientists from ThermoFisher Scientific published a review article in the Journal of Chromatography A that provided an overview of HPLC analysis using charged aerosol detection can help with polysorbate quantification.
Removing Double-Stranded RNA Impurities Using Chromatography
April 8th 2025Researchers from Agency for Science, Technology and Research in Singapore recently published a review article exploring how chromatography can be used to remove double-stranded RNA impurities during mRNA therapeutics production.


