Broad Peaks
A problem that is encountered occasionally in liquid chromatography (LC) separations is the presence of unusually broad peaks in the chromatogram. This problem is seen most often in isocratic separations, but it can occur with gradients as well. This month's instalment of "LC Troubleshooting" will cover some techniques to help determine the reason these wide peaks are seen.
A problem that is encountered occasionally in liquid chromatography (LC) separations is the presence of unusually broad peaks in the chromatogram. This problem is seen most often in isocratic separations, but it can occur with gradients as well. This month's instalment of "LC Troubleshooting" will cover some techniques to help determine the reason these wide peaks are seen.
Not What You Want to See
The chromatogram of Figure 1 is a good example of the type of chromatogram that one does not want to see for a routine method. The chromatogram in this instance should have two sharp peaks, with retention times of approximately 1 and 3 min. The broad peak between 1 and 2 min does not belong in the normal chromatographic profile. Experienced workers will immediately suspect that the peak comes from a previous injection. This is because, as a first approximation, all peaks in a given region of the chromatogram should be approximately the same width, whether the separation is isocratic or gradient.

Figure 1: An unexpectedly broad peak in a chromatogram. Reprinted from reference 1 with permission.
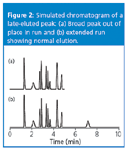
The common way to verify that the peak is from a prior injection is to extend the run time and see if the peak appears with a retention time that generates a normal peak width. This is illustrated in the simulated isocratic run of Figure 2. In Figure 2(a), we see that all peaks except the one at approximately 2 min have peak widths that increase in a regular fashion as retention time increases, just as suspected. However, the broad peak at 2 min is an anomaly for this run. A simple way to verify that the peak comes from a previous run is shown in Figure 2(b). Here the run is extended from the normal 5 min run time to 10 min. Now we see that the peak at 2 min also appears at approximately 7 min. The 2 min peak is from the prior run, whereas the 7 min peak comes from the present injection. We can tell this because the peak width of the 7 min peak fits the pattern of gradually increased widths as retention time increases.

Figure 2: Simulated chromatogram of a late-eluted peak: (a) Broad peak out of place in run and (b) extended run showing normal elution.
Estimating Retention
This approach of extending the run time is straightforward and worked well for the hypothetical sample of Figure 2, but how long should one wait for the peak to be eluted? That is, is it possible to make a guess about the retention time of a late-eluted peak so that the run time can be extended sufficiently to allow its elution? There is a trick that I use occasionally for this purpose with isocratic separations. This approach is based upon an assumption that all peaks in an isocratic chromatogram have approximately the same plate number N. Recall that the plate number is defined as

where tR is the retention time of the peak and w is the baseline peak width obtained by drawing tangents to the sides of the peak and measuring the distance between the tangents where they intersect the extended baseline. If we assume that all peaks have the same plate number, we can estimate the true retention time from a rearranged form of Equation 1

All we need to do now is determine N for a normal peak and w for the peak in question so that we can use Equation 2 to estimate the retention time. Let's try this for the run of Figure 1. Measurements on chromatograms such as this are difficult but can be simplified by enlarging the chromatogram either with a photocopier or with the data system software if you have an electronic copy. I expanded the chromatogram of Figure 1 and estimated that the normal peak eluted at 2.86 min has a baseline peak width of approximately 0.10 min. Sloping baselines and partially merged peaks, as in the present situation, require a best guess at the baseline. I skimmed the peak from the low point at approximately 2 min to the baseline after the peak. Using these values and Equation 1, I estimated N ≈ 13000 for this peak. Similarly, I estimated the peak width of the broad peak to be approximately 0.73 min. With the help of Equation 2, this gives us tR ≈ 20.8 min. It appears from Figure 1 that the run time was 4.5 min. This means that the broad peak did not come from the previous injection but from five injections earlier (20.8 min tR ≈ 4 × 4.5 min + 2 min). Thus, if one were to let the run continue, the broad peak would be expected to appear at 1.6, 6.1 (1.6 + 4.5), 10.6, 15.1, 19.6 and 24.5 min before the baseline stabilized completely. The discrepancy between the calculated retention time (20.8 min) and that determined by its elution in each run at 4.5 min intervals (19.6 or 24.5 min) highlights the approximate nature of this approach in estimating retention. However, it does give us a good place to start.
Possible Fixes
How would one contend with such a peak in a normal sample? Extending each run to 25 min would not be practical if very many samples needed to be analysed. A more efficient approach would be to make a step change in the mobile phase strength as soon as the peak at 2.8 min was eluted to flush the late peak from the column. A step flush with a return to starting conditions and re-equilibration might double the retention time, which would be better than 25 min per run. Or one might be able to adjust the run time slightly so the late peak was eluted in a region away from the two peaks of interest.
These suggestions could probably be done without requiring revalidation of the method. If validation issues were not a concern, some method modifications would be expected to provide more satisfactory results. We know that with a reversed-phase method, the late peak is much more non-polar than the two analytes of interest. Sample clean-up with the use of solid-phase extraction or liquid–liquid extraction should be able to remove an interference easily with such a strong difference in polarity from the desired compounds.
But Where Did It Go?
If we were to allow the chromatogram of Figure 1 to run out, however, we would not see the peak repeating itself at later retention times. Oops, what did we do wrong? Well, first of all we made the assumption that the method was reversed phase — it was a normal-phase method on a bare silica column with a 0.5% dioxane in heptane mobile phase and an injection of 100 μL of sample dissolved in dioxane. It is easy to assume that all chromatograms are reversed phase, but it is not always the situation. Remember to read the fine print! In the case of Figure 1, the problem is caused by injection of too large a volume of sample in a solvent that is much stronger than the mobile phase. This has the effect of "flushing" a portion of the sample downstream as the injection solvent becomes diluted in the mobile phase.
Too Much of Too Strong a Solvent
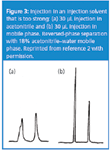
We can see the same type of problem in reversed-phase separations, as seen in Figure 3. In Figure 3(a), a 30 μL injection of sample was made onto a reversed-phase column with a mobile phase of 18% acetonitrile in water. This can be compared with the expected separation of Figure 3(b), where an injection of 30 μL was made using the mobile phase as the injection solvent. Note that in Figure 3(a), both peaks were eluted slightly earlier and they are split or broadened when compared with the run of Figure 3(b). I like to illustrate this process on a large scale, where I think of the column as a large pipe, perhaps 50 cm in diameter and the injection in a soccer-ball sized volume. If the injection solvent is stronger than the mobile phase [as in Figure 3(a)], the molecules in the middle of the injection bolus move through the column as if the injection solvent were the mobile phase, so they move faster than normal. As the outside edges of the injection bolus are diluted with mobile phase, the molecules in that part of the injection slow down as they encounter weaker solvent. Thus, the net effect is that the sample moves more quickly than normal though the column until the injection solvent is diluted fully into the mobile phase. This results in shorter retention times and often distorted peak shapes, as in Figure 3(a).

Figure 3: Injection in an injection solvent that is too strong: (a) 30 μL injection in acetonitrile and (b) 30 μL injection in mobile phase. Reversed-phase separation with 18% acetonitrileâÂÂwater mobile phase. Reprinted from reference 2 with permission.
The solution to the problem of too much of too strong an injection solvent is to either use a smaller volume injection or a weaker injection solvent or both. This generates three possibilities that we can look at: injection in the mobile phase, in a solvent weaker than the mobile phase, or stronger than the mobile phase.
If the injection solvent is the same strength as the mobile phase, you can get by with injection of approximately 15% of the peak volume for the first peak of interest. I estimated the peak width for the first peak of Figure 3(b) to be 0.18 min; if the flow-rate was 1 mL/min, this would translate into 180 μL. 15% of 180 μL is 27 μL; the 30 μL injection looks correct, so this estimate looks reasonable.
For an injection solvent weaker than the mobile phase, a much larger injection volume often can be used. In reversed-phase separation of small molecules, retention increases approximately threefold for each 10% reduction in mobile phase organic solvent concentration. This means that an injection solvent 10–20% (or more) weaker than the mobile phase will generate longer retention times of the analyte molecules until the injection solvent gets diluted out. As a first approximation, once the injection solvent strength is 20% or more weaker than the mobile phase, the sample can be thought of as sticking at the head of the column until the normal mobile phase comes along to elute it. This process of on-column concentration can be a useful technique to enable injection of a large volume of a dilute sample without excessive peak broadening.
The final option is injection in a solvent stronger than the mobile phase, as was the case of Figures 1 and 3(a). One must be very careful in such situations, generally keeping the injection volume no more than 10–20 μL, or peak splitting and distortion will occur.
You should note that none of these guidelines are hard-and-fast rules, rather, they are a place to start. In each instance, if I were concerned about peak splitting or broadening because of the injection, I would inject the target volume and then make additional injections at 2.5 times the target volume. For example, if I desired to inject 50 μL in mobile phase, I would try 25-, 50- and 100 μL injections. If I observed a twofold safety margin for my desired injection volume, I would continue. However, if the 25 μL injection looked better shaped than the 50 μL one, and the 100 μL injection was broader, I would suspect that 50 μL was too large an injection. Next I would try 10-, 25- and 50μL volumes to see if 25 μL was acceptable.
Summary
We have looked at two of many possibilities for sources of unexpectedly broad peaks in chromatograms. The example of a late-eluted peak from a previous injection is a simple one to check by extending the run time until the peak is eluted at its normal position in the chromatogram. Once the problem peak's retention time is determined, one can add a step-flush to the run, change clean-up techniques, or make another modification of the method to correct the problem. Broad peaks can also result from injection of too much of too strong an injection solvent. Reduction of the sample volume or solvent strength often will correct injection solvent problems.
"LC Troubleshooting" editor John W. Dolan is vice-president of BASi Northwest Laboratory of McMinnville, Oregon, USA; a training consultant for Rheodyne LLC, the LC Resources Training Group, of Walnut Creek, California, USA; and a member of the Editorial Advisory Board of LCGC Europe. Direct correspondence about this column to "LC Troubleshooting," LCGC Europe, Advanstar House, Park West, Sealand Road, Chester, CH1 4RN, UK.
Readers can also direct questions to the online Chromatography Forum at http://www.chromforum.com
References
1. J.W. Dolan and L.R. Snyder, Troubleshooting LC Systems (Humana Press, Totowa, New Jersey, 1989) p. 396.
2. T.–L. Ng and S. Ng, J. Chromatogr., 329, 13 (1985).

Extracting Estrogenic Hormones Using Rotating Disk and Modified Clays
April 14th 2025University of Caldas and University of Chile researchers extracted estrogenic hormones from wastewater samples using rotating disk sorption extraction. After extraction, the concentrated analytes were measured using liquid chromatography coupled with photodiode array detection (HPLC-PDA).
Polysorbate Quantification and Degradation Analysis via LC and Charged Aerosol Detection
April 9th 2025Scientists from ThermoFisher Scientific published a review article in the Journal of Chromatography A that provided an overview of HPLC analysis using charged aerosol detection can help with polysorbate quantification.


