Bioanalysis Using Dried Blood Spots: The Biggest Advancement in Bioanalysis Since LC–MS-MS?
Special Issues
A discussion on the analytical challenges that both liquid chromatography and mass spectrometry face as well as some potential solutions to these issues.
It has been stated that dried blood spots (DBSs) represent the biggest step change in bioanalysis and drug metabolism and pharmacokinetics (DMPK) studies since the commercial application of liquid chromatography–tandem mass spectrometry (LC–MS-MS) in the late 1980s and early 1990s (1). This is a bold statement and one made born out of experience and foresight. The advent of the atmospheric pressure ionization interface in the 1980s (2) revolutionized bioanalysis and, indeed, most forms of pharmaceutical analysis. It allowed DMPK scientists to confirm analytes' presence, identify the structure of impurities and metabolites, reduce analysis times, and most importantly to bioanalysts, allow levels of sensitivities to be routinely achieved that could only be previously reached with complicated derivatization, gas chromatography–mass spectrometry (GC–MS) or electrochemical detection. During this era of LC–MS-MS analysis, we have seen assay sensitivities drop from nanograms per milliter to picograms per milliliter (3) and analysis time drop from 10–20 min to 1–2 min (4). There is no doubt that LC–MS-MS has revolutionized bioanalysis, so DBS has a tough act o follow if it really does represent the next big change in DMPK.
So What Is DBS?
DMPK analysis plays a key role in the drug discovery and development process. It provides high-quality preclinical analytical data to project teams and clinicians on the concentration and nature (parent or metabolite) of the drug-related material in a systemic system following dosing. This allows the pharmacokinetic parameters such as Cmax, Tmax, AUC (area under the curve) bioavailability, and clearance to be determined. These are then used to calculate safety margin, dosing levels, and so forth. Traditional DMPK rodent safety assessment studies require relatively large volumes of blood, approximately 1 mL of plasma for each sample. To obtain a plasma sample in this amount requires taking approximately 1.5–2 mL of blood and sacrificing two to three laboratory animals for each time point on the pharmacokinetic curve.
Widely used for screening newborns for metabolic disorders, dried blood spots have the potential to change how pharmacokinetic studies are conducted. The economic and ethical benefits of collecting blood for small rodent safety studies and clinical trials onto Guthrie-type filter paper cards (Figure 1) has been demonstrated by Spooner and colleagues (5–8) as well as others (9–11). The use of blood spot cards as a sampling medium requires only 15–20 µL of blood for each time point. This has several advantages: there is no need to sacrifice animals to obtain a sample; the pharmacokinetics curve produced is more representative as it is derived from one animal and not a composite; fewer animals are used; less compound is required; pharmacokinetic samples can be taken from the toxicological group rather than satellite groups; and there is no need to freeze samples and refrigerate them in transit.
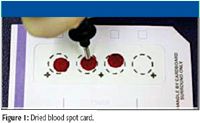
Figure 1
The use of DBS cards can translate into significant financial savings in terms of reduced animal use, limited or no requirement for frozen storage, and no need to ship the samples on dry ice. Indeed, in some geographies, the samples can be placed in a plastic food storage bag with desiccant, and placed in the normal post. This represents a significant cost saving.
So What Does DBS Mean for the Bioanalyst and DMPK Biochemist?
While the collection of DMPK samples in the DBS format can save a lot of money, it also represents a step change for animal technicians and bioanalysts. Animal technicians must learn a new way of collecting the samples, readily achieved via training videos. Bioanalysts must redevelop their workflows. Unlike working with plasma and serum where the samples are transferred easily by pipetting, diluted, and extracted with liquid–liquid or solid-phase techniques, DBS samples require a completely different approach. With DBS analysis, typically a 15-µL aliquot of blood is spotted onto the card in replicates of three for each sample from which a 3- or 6-mm punch is sampled, giving a sample volume in the region of 3–6 µL. The punching is carried out either using a robotic approach or manually with a handheld punch, which cuts out a clean circle of paper. The act of cutting out the sample as a small disk acts to give the analytical accuracy of the sample in the same way that pipetting a specific volume does with a liquid sample. The sample is then dissolved in a few hundred microliters of methanol, shaken for 1 h, and then centrifuged for 1 min. The supernatant is then removed and diluted with water (1:1) before injection onto the LC–MS-MS system.
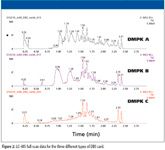
Figure 2
The Extra Matrix!
The blood spot cards are available in two main formats: treated and untreated. The treated cards are impregnated with chemicals to inactivate any bloodborne virus; however, the chemicals in the card that are dissolved during the extraction process can interfere with the analyte signal. It is therefore critical during method development to monitor the background signal from the card and adjust the chromatography adjusted to properly resolve the card matrix from the analyte peak. This adds extra complexity as the analyst must address the challenge posed by the blood matrix and the new matrix components from the card. To illustrate, we analyzed a model pharmaceutical compound from three different dried blood spot cards. The samples, calibration line and QCs, were prepared by spiking an authentic standard of alprazolam in methanol solution into fresh rat blood. The samples were spotted with approximately 15 µL of fresh rat blood, onto a Whatman DMPK cards type A, B, and C. The cards were sampled using a 3-mm punch, dissolved in 100 µL of methanol, shaken for 1 h and then centrifuged for 1 min. The supernatant was removed and water added (1:1), before injection onto the LC–MS system. The chromatography was performed on a 50 mm × 2.1 mm ACQUITY BEH C18, 1.7-µm column (Waters Corp., Milford, Massachusetts), and the analytes were eluted under reversed-phase gradient conditions over 2 min using an ACQUITY UPLC system (Waters). The column effluent was monitored by electrospray MS operating in positive ion mode with the simultaneous collection of both multiple reaction monitoring (MRM) and full-scan MS data on a Xevo TQ mass spectrometer (Waters). The collision energy, capillary voltage, and cone voltage were optimized for each individual compound. The data displayed in Figure 2 show the results obtained. Here, we can see the untreated card (DMPK C) exhibited a significantly lower background signal than that of the treated cards. The full-scan MS data of each of the cards shows the treated cards have an increasingly intense ion current as the LC gradient increases. Notice, too, how the reduction in the signal response of the analyte ion with the treated cards compared to the untreated one (Figure 3).
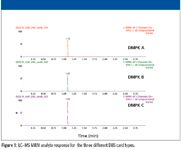
Figure 3
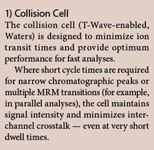
As we can see from this data, it is critical to the assay's success to develop the LC–MS methodology so that the analyte peak is clearly resolved from not only the endogenous material in the sample but from the background signal from the card as well. To achieve this, two technologies have been employed. The first of these technologies is sub-2-µm particle LC for maximizing separation performance and peak capacity, thus giving the analyst the opportunity to develop a robust method quickly. The second technology is a tandem quadrupole mass spectrometer that simultaneously acquires full-scan and MRM data, allowing the analyst to monitor the background signal while measuring the sensitivity of the analyte response. To achieve this performance, the MS system employed a novel collision cell, incorporating T-Wave design (Waters, Box 1), which allows the simultaneous collection of full-scan data and MRM data without loss in assay sensitivity.
Bioanalytical assays are required to be reliable and reproducible. The approach to DBS bioanalysis was employed for the analysis of alprazolam, a highly potent short-acting drug of the benzodiazepine class. To evaluate the reproducibility of the blood spot assay. The analyte was spiked into blood to form a calibration line over the range of 100 pg/mL to 1000 ng/mL and spotted onto blood spot cards. The cards were dried for 3 h, a sample punched with a 4-mm punch, and the resulting sample dissolved in 200 µL of methanol. The samples were analyzed using an LC system coupled to a mass spectrometer. The separation was performed on a 50 mm × 2.1 mm BEH C18 1.7-µm column (ACQUITY, Waters), and the analytes were eluted under gradient conditions using a 5–9% methanol–aqueous ammonium hydroxide (0.1%). The resulting chromatogram obtained is shown in Figure 4 shows the extracted 100-pg/mL standard and blood blank as well as the resulting calibration curve.
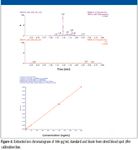
Figure 4
The data presented in Table I show the reproducibility of the QC data. We can see from these data that the low-concentration QCs had an RSD of 2.08% and the highest-concentration QC an RSD of 3.8%. This data shows that the high sensitivity assays can be developed with good reproducibility using blood spot cards and LC–MS-MS.
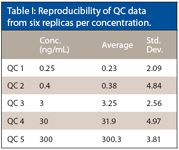
Table I: Reproducibility of QC data from six replicas per concentration.
Detecting Metabolites
The detection, confirmation, and quantification of metabolites is a necessary part of modern bioanalysis for which MS is perfectly suited. For our work, the MS system collected MS and MRM data in the same analytical run to detect and confirm the identity of drug metabolites during a bioanalysis assay. The data in Figure 5 show the detection of the 4-hydoxy metabolite of alprazolam from a sample derived from a dried blood spot. The MS-MS spectrum acquired from the metabolite peak (Figure 5b) was triggered from the MRM signal related to the metabolite peak. The spectrum was obtained on the trailing edge of the peak using the enhanced sensitivity mode of ScanWave (Box 2), a data acquisition approach that increases the ability of scientists to confirm the identity of metabolite peaks during a bioanalysis assay.
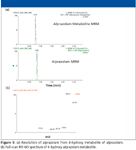
Figure 5
On-Card Analyte Stability or Instability
Sensitivity: The low sample spot and sampling approach means that only 3–6 µL of blood is used for the analysis. In a typical safety assessment study, the compound under test is dosed once or twice a day intravenously or orally at levels of 3–200 mg/kg. A drug compound or metabolite that is not sequestered into an organ or fat or rapidly eliminated typically circulates in the bloodstream at a level greater than 5 ng/mL, even at the later time points (24 h). These concentration levels are well within the detection range of today's modern LC–MS-MS analytical systems when operated in MRM mode. However, for low-dosed, rapidly cleared or inhaled compounds the circulating levels are typically much lower; in the 1–10 pg/mL range. Therefore, greater levels of sensitivity are required from the analytical instrumentation to accurately quantify these types of samples from a dried blood spot. This has forced many of the early adopters of DBS analysis to implement a two-tier strategy for sample collection, with sample collection for the orally dosed compounds based upon dried blood spots and the sample collection for low-exposure compounds employing the traditional serum–plasma approach. This results in the need for two different sample storage and preparation approaches, in some ways mitigating the cost-saving potential of DBS, as a provision must still be made for the storage and analysis of plasma-based samples.

There are four major approaches to increasing sensitivity during a bioanalysis assay: Improve the sample clean-up; derivatize the sample; use a small scale of chromatography; and use a more sensitive mass spectrometer. Although the latter is the easiest and most popular option, it often can be used in conjunction with the first three items. Capillary and nano LC provide dramatically increased analyte response when the amount of material (injection volume) is small, just 1 or 2 µL (12). This increase in analyte response is due mainly to the fact that, when eluted from the column, the analyte is contained in a much smaller volume than with typical analytical or narrow-bore LC (12). There is evidence that superior detection levels due to greater ionization efficiency at low flow rates result from shifting to an electrospray ion source for the mass spectrometer (13). This only really occurs at single-digit nanoliter-per-minute flow rates, much lower than that encountered in capillary or nano-LC. While mainly employed for proteomics-type applications, there have been several papers describing the use of these small LC devices for small molecule type applications (14). In these applications, capillary or nano-LC was employed to analyze samples where the available volume is just a few microliters, for example tail-bled mice (15). To investigate the potential of this approach for blood spots, we investigated the use of a 300-µm column coupled to a tandem quadrupole mass spectrometer for the analysis of desmopressin, a synthetic replacement for vasopressin, the hormone that reduces urine production. The desmopressin sample was again spiked into fresh rat blood at levels ranging from 100 pg/mL to 100 ng/mL. A 20-µL sample droplet was spotted onto a DMPK A card. The cards were dried. Once dried, a 6-mm spot was cut out and dissolved in 200 µL of methanol, shaken for 2 h, centrifuged, and an aliquot was removed for analysis. The DBS samples were analyzed using a 100 mm × 0.3 mm, 1.7-µm BEH C18 column (Waters). The analytes were then eluted with a reversed-phase acetonitrile aqueous gradient over 3 min at 12 µL/min. The column eluent was monitored in positive ion mode using the MRM transition 535→328. Desmopressin has a monoisotopic molecular mass of 1068.42 g/mol and one would expect the precursor ion to be MH+ = 1069, however the compound exists in several multiply charged states, +2, +3, and +4. Thus for this assay we chose to use the +2 charge state for the precursor ion and the product ion m/z = 328. The data collected was compared to that obtained from a 50 mm × 2.1 mm column (ACQUITY BEH C18, Waters) eluted with the same mobile phase and detected using the same MS-MS conditions. The data collected (Figure 6) show that the peptide was eluted with a retention time of 0.85 min on the analytical column and 1.6 min on the capillary-scale column. This difference in analysis time is due to the time taken to sweep out the delay volume in the capillary system. Although this volume is very low, at a flow rate of 12 µL/min there is still an observable offset between the two chromatograms. However, the dispersion on the capillary column is still sufficiently controlled to ensure that the peak width was just 3 s wide at the base. This allowed sufficient resolution of the analyte peak of interest from the endogenous components in the sample. Despite the slight delay in the separation, we can see that the method cycle time was still in the 3–4 min range; therefore, this form of capillary-scale chromatography could be used without deleteriously impacting sample throughput. The main aim of switching to the capillary-scale of separation is to improve assay sensitivity. The data in Figure 6 compare the signal response from the injection of the same amount of DBS sample onto the two column formats. We can see from this data that the capillary-scale system delivers approximately a 30-fold increase in sensitivity over the 2.1-mm narrow-bore LC. The theoretical increase in sensitivity is inversely proportional to the square of the column radii, in this case, 1.052/0.32, a hypothetical increase of 49-fold. Though obtaining a 30-fold increase in sensitivity is in-line with theory, the difference can be attributed to the slight loss in peak width compared with the analytical scale LC. This 30-fold increase in sensitivity is a significant step forward in developing an analytical system that will allow DBS sampling to be used for more challenging low-exposure, low-dosed, high-clearance compounds such as inhaled products and biotherapeutics.
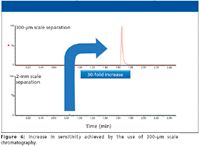
Figure 6
Conclusion
The application of DBS sample collection holds the key to dramatic changes in DMPK studies. The ability to collect and analyze small sample volumes has the potential to reduce significantly the number of animals needed in safety assessment studies, improve patient recruitment in clinical trials, reduce costs, and improve data quality. The fact that the PK samples can be taken from the histopathology group and not a satellite group will ensure greater correlation of the data. Also, as the PK curve will be developed from samples taken from one animal rather than a composite of 2–3 per time point, poor absorbents and fast metabolizers will be detected more easily, whereas before they were masked by the sample-averaging approach. This approach does introduce a step change to the workflow of the bioanalyst and challenges them to develop new approaches to deal with the limited sample volumes. Technologies such as sub-2-µm LC and capillary-scale LC combined with data-rich MS are up to the challenge. If successfully applied, we could be witnessing the transition of DMPK from the LC–MS era to the blood spot age. And DBS could well be the biggest change in DMPK since the advent of electrospray LC–MS-MS in the late 1980s.
Acknowledgments
The authors would like to thank Joanne Mather, Chet Bowen, and John Kehler of Waters Corporation for their contribution to the work discussed in this article. We would also like to thank Chris Benevides, Jim Murphy, and Mike Tomany with Waters Corporation R&D Department for their work on the design of the capillary nano-spray MS source.
Robert Plumb, Ph.D., is a visiting Professor at Imperial College, London, UK, in the Division of Surgery and Oncology. His role is the development of analytical technology specifically LC–MS to support the investigation in human metabolism using a metabonomics approach. He is the author of over 80 peer reviewed papers on the application of LC, LC–MS and LC–NMR-MS for metabolism studies. He is also a visiting Professor at Kings College London the Micro Separations Group with the Department of Pharmacy. He obtained his BSc Hons from the University of Hertfordshire and PhD in Drug Metabolism from the University of Hertfordshire. Prior to his current role he worked for GlaxoWellcome in the Drug Metabolism Department for 14 years responsible for the identification of metabolites to support discovery and development DMPK using LC–NMR-MS.
Paul Rainville is a Principal Scientist currently working in the Pharmaceutical Business Development Group of Waters Corporation. He has over 10 years experience in separation science with a strong emphasis in chromatography coupled with mass spectrometry.
Christopher Evans, Ph.D., is a Section Manager of the Bioanalytical Sciences and Development group of the Worldwide Bioanalysis and Systems Management within PCD-DMPK at GlaxoSmithKline Pharmaceuticals R&D, based in King of Prussia, Pennsylvania. In this current role, he co-leads the world-wide effort responsible for the investigation, evaluation and implementation of novel technologies and processes to enhance the way that the quantitative bioanalysis of drugs is performed. One of the primary goals of this group is to continue the investigation into Dried Blood Spot (DBS) technology and fundamental. He obtained the B.S. in chemistry from the University of Maryland at College Park and his Ph.D. in Analytical Chemistry from Purdue University. Prior to his current role, Chris led a discovery-DMPK group for nearly seven years, also within GlaxoSmithKline.
References
(1) N. Spooner, European Bioanalytical Forum, Barcelona, 2009, Oral Presentation.
(2) J.D. Henion, Clin. Chem. 55(6), 1234–1235 (2009).
(3) W.Z. Shou and J. Zhang. Expert Opin. Drug Metab. Toxicol. 6(3), 321–336 (2010).
(4) M. Jemal, Biomed. Chromatogr. 14(6), 422–429 (2000).
(5) P. Abu-Rabie and N. Spooner, Anal. Chem. 15, 81(24), 10275–10284 (2009).
(6) N. Spooner, R. Lad, and M. Barfield, Anal. Chem. 15, 81(4), 1557–1563 (2009).
(7) M. Barfield, N. Spooner, R. Lad, S. Parry, and S. Fowles, J. Chromatogr., B 1870(1), 32–37 (2008).
(8) L. Goodwin, S.A. White, N. Spooner, J. Chromatogr. Sci. 245(6), 298–304 (2007).
(9) W. Li and F.L. Tse, Biomed. Chromatogr. 24(1), 49–65 (2010).
(10) P. Bhatti, D. Kampa, B.H. Alexander, C. McClure D. Ringer, M.M. Doody, A.J. Sigurdson, BMC Med. Res. Methodol. 13(9), 76 (2009).
(11) A.J. Wilhelm, J.C. den Burger, A. Chahbouni, R.M. Vos, and A.J. Sinjewel, J. Chromatogr., B 877(30), 3916–3919 (2009).
(12) K.R. Reid, C.F. Burant, and R.T. Kennedy, Anal. Chem. 81(21), 9201 (2009).
(13) Y. Li, and R.B. Cole, Anal Chem.75(21), 5739–5746 (2003).
(14) S. Fanali, Z. Aturki G. D'Orazio, and A. Rocco, J. Chromatogr., A 1150(1–2), 252–258 (2007).
(15) I.J. Fraser. G.J. Dear, R. Plumb, M. L'Affineur, D. Fraser, and A.J. Skippen, Rapid Commun. Mass Spectrom. 13(23), 2366–2375 (1999).

Characterizing Plant Polysaccharides Using Size-Exclusion Chromatography
April 4th 2025With green chemistry becoming more standardized, Leena Pitkänen of Aalto University analyzed how useful size-exclusion chromatography (SEC) and asymmetric flow field-flow fractionation (AF4) could be in characterizing plant polysaccharides.
Investigating the Protective Effects of Frankincense Oil on Wound Healing with GC–MS
April 2nd 2025Frankincense essential oil is known for its anti-inflammatory, antioxidant, and therapeutic properties. A recent study investigated the protective effects of the oil in an excision wound model in rats, focusing on oxidative stress reduction, inflammatory cytokine modulation, and caspase-3 regulation; chemical composition of the oil was analyzed using gas chromatography–mass spectrometry (GC–MS).


