Be Careful of the Flow Rate
When converting methods from LC to UHPLC, don’t get confused by flow-rate settings.
When converting methods from liquid chromatography (LC) to ultrahigh-pressure liquid chromatography (UHPLC), don't get confused by flow-rate settings.
As more and more workers are transferring liquid chromatography (LC) methods to ultrahigh-pressure LC (UHPLC), I have received an increasing number of email questions that demonstrate a poor understanding of the role of the mobile-phase flow rate in method scaling. For this month's "LC Troubleshooting" I'd like to discuss situations when changes in flow rate are fairly innocuous and when they can get you into trouble.
First, Select the Column
Let's assume that you want to convert an isocratic LC method to an UHPLC one and maintain the same resolution, Rs. To help us understand the important variables, consider the fundamental resolution equation:

where N is the column plate number, α is the separation factor, and k is the retention factor. Definitions of k and α are:

where tR is the retention time, t0 is the column dead time (also abbreviated tm), and k1 and k2 are the retention factors of two adjacent peaks. To keep Rs constant, we need to keep N, α, and k constant, too. If we assume that we will not change the chemistry of the system (primarily the mobile phase, column stationary phase, and temperature), k and α will remain constant. This means that when we change from a conventional LC column to an UHPLC column, the column chemistry must be the same, so only the column length, L (in millimetres), internal diameter, dc (also in millimetres), and particle size, dp (in micrometres) can change. A simple method to keep N constant is to make sure that the ratio L/dp is constant. Because of the limited availability of column lengths and particle sizes available, it will be difficult to keep L/dp exactly the same, so we'll adopt the United States Pharmacopeia's (USP) guidelines (1) to keep this ratio within +50% and -25%.
As an example, let's start with a method on a conventional 150 mm × 4.6 mm LC column packed with 5-μm dp particles, operated at 1.0 mL/min. If we want to switch to a UHPLC packing with dp = 1.7, you can determine that (150 mm/5 μm) = 30 ≈ (50 mm/1.7 μm) = 29.4, well within our +50% to -25% limits. Usually UHPLC uses narrower columns than conventional LC, so let's substitute a 50 mm × 2.1 mm, 1.7-μm column for the 150-mm one.
Next, Adjust the Flow Rate
Although it isn't a requirement, it is a good idea to start the method conversion process by setting up the method with the new column and the flow rate adjusted to keep the same linear velocity of mobile phase through the column. To keep the linear velocity constant, the flow rate should be adjusted by the change in cross-sectional area of the column, which is proportional to the square of the ratio of column diameters, or (2.1 mm/4.6 mm)2 = 0.208 ≈ 0.2. So the initial flow rate of 1.0 mL/min should be reduced to 0.2 mL/min to obtain the same linear velocity.
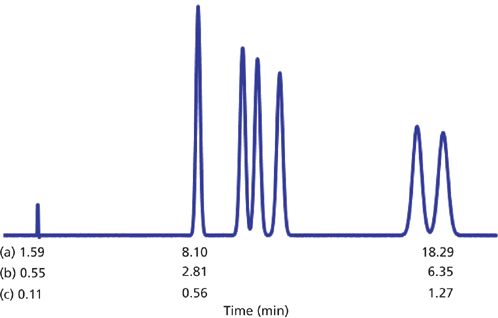
These two runs are compared in Figures 1(a) and 1(b), respectively. You can see that the chromatogram looks identical, with the exception of the retention times (see retention times compared below the chromatogram). We would expect the retention times for the UHPLC run to be one-third of those generated by the LC run, because the column is one-third of the length. In fact the retention times differ by 35%, because of the rounding of the ideal flow rate of 0.208 mL/min to 0.2 mL/min. You can check this by comparing the ratios of the t0 values as well as the ratios of the retention times of the first and last peaks for the UHPLC run (Figure 1[b]), which are all 35% of the LC run (Figure 1[a]).

Figure 1: Simulated isocratic reversed-phase runs for a set of nitroaromatic compounds at 55% methanol–buffer and 35 °C. (a) 150 mm × 4.6 mm, 5-μm column operated at 1.0 mL/min; (b) 50 mm × 2.1 mm, 1.7-μm column operated at 0.2 mL/min; (c) same as (b), but at 1.0 mL/min.
The column back pressure (not shown) for Figure 1(a) is 950 psi (~65 bar), whereas for Figure 1(b) it is 2635 psi (~180 bar). For UHPLC conditions, we can tolerate much higher pressures, and if we increase the flow rate to 1.0 mL/min, we get the chromatogram of Figure 1(c). Because the column efficiency, N, does not change with flow rate for the sub-2-μm particles used in UHPLC, we expect to see the same chromatogram in Figure 1(c) as we did for Figure 1(a) and 1(b), but with shorter retention times. As expected, the retention times for Figure 1(c) are one-fifth of those of Figure 1(b), because we increased the flow rate fivefold from 0.2 mL/min to 1.0 mL/min. The pressure (not shown) also increased fivefold to 13,170 psi (~910 bar).
What About Gradients?
So far, everything is going as we expected. The change from LC to UHPLC is straightforward. Simply keep N constant and don't change the chemistry of the system, and we can change the flow rate to obtain an acceptable pressure and short run time. The run of Figure 1(c) is ~14 times faster than that of Figure 1(a), just the kind of improvements we expect when moving from LC to UHPLC. Let's see what happens when we apply the same procedures to a gradient separation.
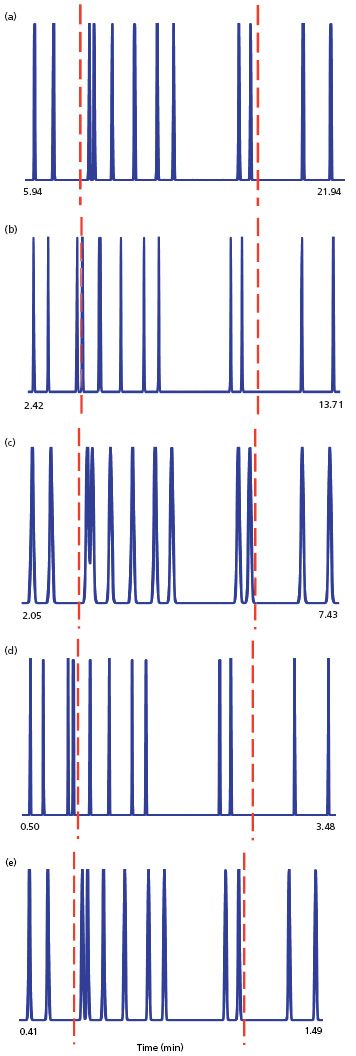
The sample for the runs of Figure 2 is a set of 12 polyaromatic hydrocarbons, starting with conditions that separate them on a 150 mm × 4.6 mm, 5-μm column at 1 mL/min; the gradient runs from 45% to 90% acetonitrile over 30 min. In each chromatogram, I've normalized the plots by stretching or compressing the x-axis so that the first and last peaks line up vertically. The least-resolved, or "critical" peak pair comprises peaks 3 and 4, which are separated almost to baseline in the initial run of Figure 2(a). I've added a couple of vertical dashed red lines to serve as reference markers so we can track the position of this peak pair, as well as for peaks 9 and 10.

Figure 2: Simulated gradient reversed-phase runs for a set of polynuclear aromatic hydrocarbons for a gradient of 45–90% acetonitrile–buffer and 40 °C. (a) 150 mm × 4.6 mm, 5-μm column operated at 1.0 mL/min with a 30-min gradient; (b) 50 mm × 2.1 mm, 1.7-μm column operated at 0.2 mL/min with a 30-min gradient; (c) same as (b), but F = 0.2 mL/min and tG = 10 min; (d) same as (b), but F = 1.0 mL/min and tG = 10 min; (e) same as (b), but F = 1.0 mL/min, tG = 2 min.
Let's apply the same logic we used for the isocratic case and run the method on a 50 × 2.1 mm, 1.7-μm column at 0.2 mL/min to obtain the same linear velocity. The results are seen in Figure 2(b). Immediately we see that the chromatograms are not the same. Both peak pairs have shifted to (relatively) shorter retention times. Also, peaks 3 and 4 are baseline separated - an obvious improvement over Figure 2(a). This cannot be attributed to an increase in N, because N for the 1.7-μm column is actually ~2% lower than for the 5-μm column. What can be going wrong? Then we remember that the smaller-particle column is one-third the length of the larger-particle one, so t0 should be one-third also (compare t0 for Figures 1[a] and 1[b]). So what happens if we reduce the gradient time, tG, to one-third - a change from 30 min to 10 min? This is shown in Figure 2(c). Now the peaks all line up again and the resolution values for the various peak pairs compare favourably between Figure 2(a) and 2(c), as we had hoped. The retention times for the shorter column are also reduced to approximately one-third of the original times.
The pressure for the run of Figure 2(a) is 465 psi (~30 bar) and 1285 psi (~90 bar) for Figures 2(b) and 2(c). Both of these are well below the >6000 psi (>400 bar) expectations of a UHPLC method. This means we should be able to make further gains in throughput by increasing the flow rate, just as we did when changing from the conditions of Figure 1(b) to those of 1(c) in the isocratic case. When we change the flow rate from 0.2 mL/min (Figure 2[c]) to 1.0 mL/min, we get the results of Figure 2(d). The pressure increases the expected fivefold to 6420 psi (~445 bar), but now we're back to a separation more like that of Figure 2(b) than 2(a) or 2(c). Something isn't right!
Gradient Retention Factors Are Different
As we've noticed with the various changes in the gradient method, the results we obtain don't seem to track with the same changes under isocratic conditions. The reason for this is that gradient retention factors are not calculated in the same way as those for isocratic. The gradient retention factor, k*, can be estimated as:

where F is the flow rate (in millilitres per minute), ΔΦ is the gradient range (equal to 0.45 for the current 45–90% gradient), Vm is the column volume (in millilitres), and S is a constant for a given analyte. As was the case for the isocratic k value in equation 1, we need to keep both N and k* constant if we want to keep resolution constant in gradient elution. We shouldn't change the gradient range, because this will change the chemistry of the system, and we are not changing the sample, so S will be unchanged. This allows us to simplify equation 4 as follows:

That is, when we change the gradient time, flow rate, or column size, we need to make compensating changes to keep equation 5 constant. We need one last equation to estimate Vm:

Thus, our 150 mm × 4.6 mm column has Vm ≈ 1.6 mL and the 50 mm × 2.1 mm column has Vm ≈ 0.11 mL.
Let's see how the runs of Figures 2(a)–2(d) compare when using equation 5. For Figure 2(a), (30 × 1)/1.6 = 18.9; for Figure 2(b), (30 × 0.2)/0.11 = 54.4; for Figure 2(c), (10 × 0.2)/0.11 = 18.1; and for Figure 2(d), (10 × 1)/0.11 = 90.7. (My usual warning applies here: If you try to repeat my calculations, the results are likely to vary slightly because of rounding.) So it is easy to see why Figure 2(a) and 2(c) look the same (18.9 ≈ 18.1) and Figures 2(b) and 2(d) look quite different (18.9 ≠ 54.4 ≠ 90.7).
We can also use equation 5 to understand how to adjust the conditions of Figure 2(d) to get the same separation as Figure 2(c), but at 1 mL/min. If we reduce the gradient time to 2 min, we get (2 × 1)/0.11 = 18.1, which is the same as for Figure 2(c). The results shown in Figure 2(e) confirm this prediction. We could tweak this further to get the same separation as in Figure 2(a) (for example, a gradient time of 2.1 min would give [2.1 × 1]/0.11 = 19.0 ≈ 18.9 for Figure 2[a]), but this is probably not worth the trouble.
With the correct adjustments, we've reduced the retention time for the last peak by ~15-fold by using the smaller UHPLC column at 1 mL/min. This is approximately the same savings we made with the isocratic changes of Figure 1.
Conclusions
We have seen that transferring an isocratic method from LC conditions to UHPLC conditions is pretty simple. Just find a column that has the same chemistry and approximately the same plate number as the original LC column. Then adjust the flow rate for an acceptable back pressure. I recommend the intermediate step of transferring the method to conditions with the same linear velocity (such as going from Figure 1[a] to 1[b]), but that isn't essential.
When transferring gradient methods from LC to UHPLC, however, more care needs to be taken. Even with the same column chemistry and plate number, flow rate can be changed only if other compensating changes are made to keep the results of equation 5 constant. For the present example, there were small changes in relative retention and resolution when poor choices were made, but we were lucky because the sample comprises similar compounds, which are expected to respond similarly when conditions are changed. If the sample contained analytes with different functional groups (such as acids, bases, and neutrals) or were more complex (such as a natural product sample or protein digest), complete loss of resolution or retention reversals are possible for some peak pairs when gradient conditions are not changed properly.
As a final caution, the data I used for the generation of the examples of Figure 2 were modified so that the dwell volume was zero. In real systems, the dwell volume typically is in the range of 1.5–3.5 mL for a conventional LC system and 0.3–1.5 mL for an UHPLC system. When methods are transferred between systems, theoretically the dwell volume should be scaled by the same factor as the column volume, Vm. This adds a little more complexity to the method transfer and tends to affect the relative retention of early eluted peaks more than later ones.
The bottom line is that transferring isocratic or gradient methods from LC to UHPLC will usually give a large reduction in sample retention, but it can be much more challenging than simply installing an UHPLC column and changing the flow rate. So, take care and pay attention to the basics and you should have success in method transfer.
"LC Troubleshooting" Editor John Dolan has been writing "LC Troubleshooting" for LCGC for more than 30 years. One of the industry's most respected professionals, John is currently the Vice President of and a principal instructor for LC Resources in Lafayette, California. He is also a member of LCGC Europe's editorial advisory board. Direct correspondence about this column via e-mail to John.Dolan@LCResources.com. To contact the editor-in-chief, Alasdair Matheson, please e-mail: amatheson@advanstar.com
References
(1) General Chapter <621> "Chromatography" in United States Pharmacopeia 37–National Formulary 32 (United States Pharmacopeia, Rockville, Maryland, USA, 2014).

Understanding FDA Recommendations for N-Nitrosamine Impurity Levels
April 17th 2025We spoke with Josh Hoerner, general manager of Purisys, which specializes in a small volume custom synthesis and specialized controlled substance manufacturing, to gain his perspective on FDA’s recommendations for acceptable intake limits for N-nitrosamine impurities.
University of Rouen-Normandy Scientists Explore Eco-Friendly Sampling Approach for GC-HRMS
April 17th 2025Root exudates—substances secreted by living plant roots—are challenging to sample, as they are typically extracted using artificial devices and can vary widely in both quantity and composition across plant species.
Determining the Serum Proteomic Profile in Migraine Patients with LC–MS
April 17th 2025Researchers used liquid chromatography–mass spectrometry (LC–MS) in their proteomic analysis to compare the serum proteome of migraine patients with healthy controls and to identify differentially expressed proteins as potential migraine biomarkers.


