Automating Analysis of Pain Management Drugs in Urine
This article discusses the benef ts of using automated dispersive solid-phase extraction (dSPE) rather than standard SPE in urine analysis.
A lot of useful information regarding medication taken and metabolism of drugs in the human organism can be extracted from urine. The technique most often used is enzymatic hydrolysis of metabolites, followed by solid-phase extraction (SPE) cleanup and high performance liquid chromatography tandem mass spectrometry (HPLC–MS–MS) determination. When performed manually, sample preparation is labour intensive and time-consuming. If hydrolysis and cleanup are automated and dispersive SPE (dSPE) is chosen instead of standard SPE, the process can be accelerated.
(PHOTO CREDIT: FRANKRAMSPOTT/GETTY IMAGES)

A significant amount of work is required whenever toxicologists and clinical chemists want to determine the concentration of active pharmaceutical ingredients (APIs) or of their metabolites in urine. One of the most time-intensive steps is the hydrolysis of conjugated analytes to their original form, typically performed enzymatically, for example, using β-glucuronidase (GUSB). Control, monitoring, and optimization of various parameters is needed to ensure that the hydrolysis reaction is complete and reproducible. Among these are pH, temperature, and length of the hydrolysis period that vary from enzyme to enzyme. These factors have a profound impact on the quality of the analysis results. The same is the case for matrix compounds, present in significant amounts in uri ne. To reach the very low limits of detection required for the monitoring of API residues and metabolites, interfering compounds from the matrix, or those generated during the hydrolysis process, must be eliminated. Typically, this is done using a suitable extraction technique such as solid-phase extraction (SPE), which is widely used in forensic chemistry. Performing standard, cartridge-based SPE has a number of drawbacks when used for this type of analysis. It uses relatively large amounts of costly solvent; the solvent and sample elution need to be precisely controlled, therefore increasing the risk of error and making the process slow; and the resulting sample dilution increases detection limits.
When he was initially searching for a more efficient SPE method, William E. Brewer from the University of South Carolina developed disposable pipette extraction (DPX), a dispersive SPE (dSPE) technique. Instead of the sorbent being present as a packed bed, in dSPE the sorbent is a loose powder contained inside a standard disposable pipette tip by fixed screens at the top and bottom of the tip. The sample is aspirated into the tip only, eliminating both the risk of sample-to-sample carryover and the need for extensive washing of syringes used in systems based on standard SPE cartridges. With the sample-powder mix inside the tip, air is aspirated, leading to turbulent mixing of the phases and a highly efficient extraction. Typically, the remaining sample is discharged and the concentrated analytes are eluted with a small volume of solvent into a clean autosampler vial followed by liquid chromatography–mass spectrometry (LC–MS) or gas chromatography–mass spectrometry (GC–MS) analysis. Key differentiators of dSPE are: Fast extraction, high recovery rates, and very small volumes of solvent. Reducing solvent use in the laboratory brings many benefits, ranging from improved work environment to reduced cost for purchasing and disposing of often toxic solvents.
Brewer also wanted to automate this last key step to achieve a completely automated solution: This last key step involved the hydrolysis of the conjugates formed during drug metabolism to quantify the total amount of drug taken.
Experimental
A Dual Head MultiPurpose Sampler (MPS) (Gerstel) was used for this application. One head performs the DPX-based sample extraction and clean-up, while the second head performs the injection into the LC–MS system.
A 1 mL sample of urine is manually pipetted into an autosampler vial. The vial is capped and placed in the autosampler tray. The sample preparation and introduction process were controlled by software (Maestro, Gerstel).
Separation of the Target Analytes: Separation of three target analytes and their corresponding glucuronide conjugates (morphine and morphine-3-glucoronide; oxazepam and oxazepamglucoronide; oxymorphone and oxymorphoneglucoronide) was performed using a 3.0 × 50 mm, 2.7-µm Poroshell 120, EC-C18 column (Agilent Technologies). The detection system used was a 6460 Triple Quadrupole MS (Agilent) with Jetstream electrospray source (Agilent). Analyte quantification was performed using deuterated isotope labelled standards.
Hydrolysis and DPX Extraction: Mobile phase: A: 5 mM ammonium formate in water with 0.05% formic acid, B: 0.05% formic acid in methanol; LC pump conditions: Isocratic, 50:50 (A:B) at a flow of 0.300 mL/min; Run time: 10 min; Injection volume: 2 µL (loop overfill); Column temperature: 55 °C 6460 MS–MS; Operating mode: Electrospray, positive mode + Agilent Jet stream; Gas temperature: 350 °C; Gas flow (N2): 5 L/min; Nebulizer gas pressure: 35 psi; Sheath gas temperature: 250 °C; Sheath gas flow: 11 L/min; Capillary voltage: 4000 V; Nozzle voltage: 500 V.
Automation in Practice
To establish that the enzymatic hydrolysis of urine samples using the typical β-glucuronidase procedure could be automated successfully, triplicate urine samples spiked at a concentration of 1000 ng/mL with oxazepam glucuronide were hydrolyzed both manually and using the automated hydrolysis procedure. Following hydrolysis, all samples were extracted and analyzed using the DPX–LC–MS–MS procedure. The results for the manual and automated procedures matched well, with only a 4% difference between the two sets of results.
Figure 1: An examination of the automated β-glucuronidase hydrolysis procedure using 0.66 M acetate buffers of different pH was set up and performed.

The automated β-glucuronidase hydrolysis procedure was then compared to a typical acid hydrolysis procedure in which equal parts concentrated hydrochloric acid were added to spiked urine samples containing either oxymorphone-3-β-D-glucuronide or oxazepam glucuronide at 1000 ng/mL and then allowed to incubate at 100 °C for 90 min. After cooling to room temperature, the pH of these samples was adjusted to 4 using dilute ammonium hydroxide prior to extraction along with the automated β-glucuronidase hydrolyzed sample group using the automated DPX–LC–MS–MS procedure. The final volumes of the samples being compared were adjusted prior to extraction to ensure that the final concentrations would be equivalent. The native oxymorphone and oxazepam concentrations were found to be lower when the acid hydrolysis procedure was used. Since no response was observed when monitoring for oxymorphone-3-β -D-glucuronide and oxazepam glucuronide, it is believed that the lack of response may be a result of either further degradation of the native analytes or interference with their ionization, rather than incomplete hydrolysis when using the acid hydrolysis procedure. One of the benefits of automation is the ease with which designed experiments can be performed to quickly optimize or compare various steps involved in the manual procedures being automated.
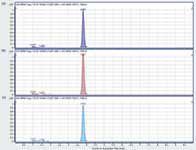
Figure 2: Overlay mass chromatogram of oxazepam results from pH examination test showing no significant difference was found when the pH of the 0.66 M acetate buffer was varied from (a) 4.0, to (b) 4.5, and to (c) 5.0.

An examination of the automated β-glucuronidase hydrolysis procedure using 0.66 M acetate buffers of different pH was set up and performed as shown in Figure 1. Figure 2 provides an overlay view of mass chromatograms resulting from oxazepam determinations; as can be seen, no significant difference was found when changing the pH of the 0.66 M acetate buffer from (a) 4.0 to (b) 4.5 or to (c) 5.0. To ensure that the automated hydrolysis procedure was complete and could be used within an automated DPX–LC–MS–MS method for the quantitation of analytes, standards and quality control (QC) samples in urine were prepared using the glucuronide conjugated analytes morphine-3-β-D-glucuronide or oxazepam glucuronide and then both the native and the conjugated forms of the analytes were monitored using the previously described LC–MS–MS method. In all cases, the absence of detected response for the glucuronide conjugated analytes proved the successful complete hydrolysis of the urine sample being analyzed.
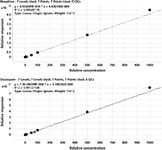
Figure 3: Calibration curve results for morphine and oxazepam following automated hydrolysis and subsequent DPX-LC-MS-MS analysis of morphine-3-glucuronide and oxazepam glucuronide.

The accuracy and precision achieved for morphine and oxazepam using the complete automated hydrolysis-DPX–LC–MS–MS method were determined by extracting replicate (n = 6) QC samples at 75 ng/mL concentrations. Accuracy data averaged 102% for morphine and 96.3% for oxazepam and the precision (% CV) was 3.52% for morphine and 4.70% for oxazepam. Representative calibration curves for morphine and oxazepam are shown in Figure 3. Regression analysis for both analytes resulted in R2 values of 0.99 or greater.
The complete automated process resulted in linear calibration curves with R2 values 0.99 or greater achieved for glucuronide conjugated analytes with limits of quantitation (LOQs) of 1 ng/mL for both morphine and oxazepam. The combined automated hydrolysis, dSPE extraction, and LC–MS–MS method provided good accuracy and precision. The accuracy data averaged 102% for morphine and 96.3% for oxazepam and precision (%CV) was 3.52% for morphine and 4.70% for oxazepam.
Conclusion
The automated system performed well. The described enzymatic hydrolysis and subsequent DPX cleanup methods were successfully automated for glucuronide conjugated analytes in urine. Analytes were rapidly and reproducibly isolated from hydrolyzed urine samples and subsequently determined using the described automated DPX cleanup procedure coupled with LC–MS–MS analysis.
Reference
1. F.D. Foster, J.R. Stuff, E.A. Pfannkoch, and W.E. Brewer, Automated Hydrolysis, DPX Extraction and LC–MS–MS Analysis of Pain Management Drugs from Urine, GERSTEL AppNote (Nr 1/2014).
Fredrick D. Foster received his B.S in chemistry from Juniata College, Pennsylvania, USA, and his M.S. in biotechnology from Johns Hopkins University, Baltimore, Maryland, USA. Foster has more than 20 years experience in analytical and bio-analytical method development and analysis, working closely with industry and various U.S. Federal and State agencies. Application fields include clinical, food safety and environmental analysis, mainly based on HPLC and LC–MS–MS. Mr. Foster currently works as an applications chemist for Gerstel, Inc. located in Baltimore, Maryland, USA, helping to develop, demonstrate, and train customers on automated sample preparation methods coupled to either HPLC or LC–MS–MS.
William Brewer received his PhD in chemistry at the University of South Carolina, South Carolina, USA, where he currently holds a faculty appointment as a senior instructor. Bill spent several years as a forensic toxicologist during which time he invented DPX technology. He is the Founder and Chief Scientific Officer of DPX Labs (South Carolina, USA).
E-mail: fdfoster@gerstelus.com
Website: http://www.gerstel.com/
This article is from The Column. The full issue can be found here: http://www.chromatographyonline.com/node/373202

Thermodynamic Insights into Organic Solvent Extraction for Chemical Analysis of Medical Devices
April 16th 2025A new study, published by a researcher from Chemical Characterization Solutions in Minnesota, explored a new approach for sample preparation for the chemical characterization of medical devices.
Study Explores Thin-Film Extraction of Biogenic Amines via HPLC-MS/MS
March 27th 2025Scientists from Tabriz University and the University of Tabriz explored cellulose acetate-UiO-66-COOH as an affordable coating sorbent for thin film extraction of biogenic amines from cheese and alcohol-free beverages using HPLC-MS/MS.
Multi-Step Preparative LC–MS Workflow for Peptide Purification
March 21st 2025This article introduces a multi-step preparative purification workflow for synthetic peptides using liquid chromatography–mass spectrometry (LC–MS). The process involves optimizing separation conditions, scaling-up, fractionating, and confirming purity and recovery, using a single LC–MS system. High purity and recovery rates for synthetic peptides such as parathormone (PTH) are achieved. The method allows efficient purification and accurate confirmation of peptide synthesis and is suitable for handling complex preparative purification tasks.

.png&w=3840&q=75)

.png&w=3840&q=75)


.png&w=3840&q=75)


.png&w=3840&q=75)


