Automated Drug Screening of Dried Blood Spots Using Online LC–MS/MS Analysis
The Column
A fully automated method for the effective drug screening of large populations based on dried blood spot (DBS) technology is presented. DBSs were prepared, scanned, then spiked with deuterated standards, and directly extracted, before they were transferred online to an analytical liquid chromatography (LC) column and then to the electrospray ionization tandem mass spectrometry (ESI-MS/MS) system. The method was applied to DBS samples from two patients with back pain; codeine and oxycodone could be identified and quantified accurately below the level of misuse of 89.6 ng/mL and 39.6 ng/mL, respectively.
Maksim Kabakou/stock.adobe.com

A fully automated method for the effective drug screening of large populations based on dried blood spot (DBS) technology is presented. DBSs were prepared, scanned, then spiked with deuterated standards, and directly extracted, before they were transferred online to an analytical liquid chromatography (LC) column and then to the electrospray ionization tandem mass spectrometry (ESI-MS/MS) system. The method was applied to DBS samples from two patients with back pain; codeine and oxycodone could be identified and quantified accurately below the level of misuse of 89.6 ng/mL and 39.6 ng/mL, respectively.
For forensic applications, the use of dried blood spot (DBS) technology, such as drug screening, is of major interest. The easy sample collection, small sample volumes, and the option to ship to a centralized laboratory are all benefits. This article shows the development of an automated DBS process, including card recognition, sample preparation and extraction, and online analysis by ultrahigh-performance liquid chromatography tandem mass spectrometry (UHPLC–MS/MS) for the simultaneous determination of a panel of psychoactive drugs in DBS.
Materials and Methods
Automated Extraction: Automated extractions were performed with a DBSâMS 500 (Camag), an extraction system for mass spectrometry (MS). The extraction solvent (methanol and water mixture; 70:30 v/v) was connected to the extraction port. The wash solution (methanol, acetonitrile, 2-propanol, and water with 0.1% formic acid; 25:25:25:25, v/v/v/v) was joined to the rinsing bottle. The internal standard mix was connected to internal standard port 2. Internal standard port 4 and the wash port were also filled with methanol. Chronos software (Camag) was used for this method
The system was prepared by priming methanol through the internal standard port 4 (10 cycles) followed by two cycles through port 2. The extraction head was cleaned in an ultrasound bath at 40 °C for 10 min prior to analysis. The extraction solvent was primed for five cycles and the rinsing solvents were flushed for 1 min (this process is an automated system prime method). The DBS cards were photographed with the built-in camera in the extraction system before and after each run to check for the presence of a blood spot and to adjust the extraction head to the centre of each spot.
The software automatically recognized inadequate dried blood spots based on their roundness, diameter, and area. Inadequate DBSs were excluded from analysis. A 20-μL internal standard measure was sprayed in a homogenous layer onto each spot. After a 20 s drying time, the samples were extracted with a volume of 20 μL and a 200 μL/min flow rate. To complete the automated DBS extraction cycle, the system was rinsed for 20 s.
Chromatography and Mass Spectrometry: Chromatography was performed with a Nexera X2 UHPLC system (Shimadzu) connected to a LCMS-8060 tandem mass spectrometer (Shimadzu). Analytes were separated on a 2.3 × 50 mm, 5-μm C18 Shim-pack GIST analytical column (Shimadzu).
Mobile phase A consisted of water with 10âmM ammonia formate, and mobile phase B of methanol with 10 mM ammonia formate. The following stepwise gradient was applied: 5–95%
(0.0–6.0 min), 95% (6.0–8.0 min), and 5% (8.1–10.0 min). The flow rate was set to 1.0 mL/min at 40 °C.
At least five multiple reaction monitoring (MRM) transitions were recorded for each analytical compound. The most abundant three mass transitions were used for quantitation. The preset MRM transition from the forensic and toxicology LC–MS/MS method package of Shimadzu were confirmed using standard solutions (1 μg/mL) and were used afterwards for the
LC–MS/MS method development.
Sample Preparation: The deuterated drugs were dissolved in methanol to prepare 100âμg/mL standard solutions. A mix was then prepared by two dilution steps to generate a final concentration of 100 ng/mL for all deuterated standards. This solution was used as an internal standard mix on the extraction system, and each sample was sprayed with 20 μL in “fast” mode.
A calibration was set up with four levels: level 1 was 10-fold below the cut-off, level 2 was the cut-off concentration, level 3 was fivefold, and level 4 was 10-fold the cut-off concentration. To prepare the calibration levels, the stock solution of the standards was prepared in methanol and gently mixed with the donor blood in four different concentrations. Aliquots of 15 μL were spotted onto DBS cards (Camag) and dried at room temperature for at least 2 h. The cards were subsequently stored at 4 °C in sealed plastic bags containing desiccants. Stock solutions were stable for two weeks.
Results
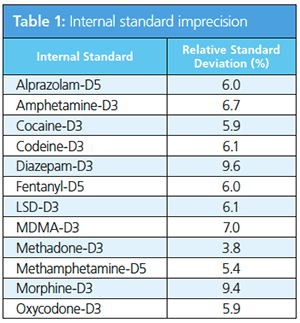
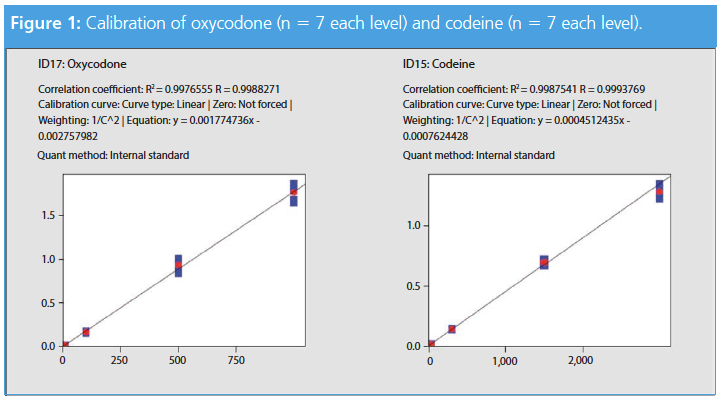
Correlation and Precision: The calibration levels were measured sevenfold to determine the method robustness and validity. The relative standard deviations (RSDs) of the internal standards, which were applied by spraying, were below 10% for all target compounds by comparing the data through all four levels (Table 1).
The correlation and intra-day variations of all target compounds are listed in Table 2. The target to internal standard ratio was used to compare the results and to develop the calibration line. In Figure 1, codeine and oxycodone are displayed because those compounds were measured in the patient samples using the developed method (see section: Patient Samples).
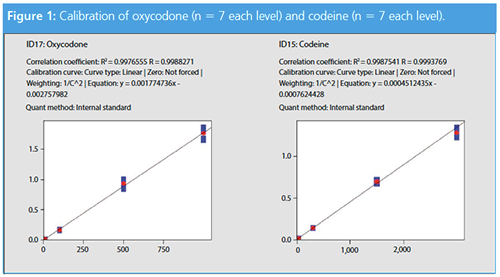
The intra-day variations as well as the coefficients of determination (R2) of the four calibration standards are summarized in Table 2. Fentanyl, LSD, morphine, and MDMA can be quantified at their cut-off level, however, level 1 represents the limit of detection with a signal-to-noise (S/N) ratio of 10.3 for fentanyl, 8.0 for LSD, 9.0 for morphine, and 3.3 for MDMA, and are therefore not represented in Table 2.
Excellent correlation was obtained for all target compounds in the panel (Table 2). All points of the calibration functions were sufficiently precise with RSDs below 15%.
Patient Samples: To check the feasibility of the method and the applicability in a real setting, two anonymized DBS samples were acquired from healthy donors using medication for back pain. The samples were drawn by the patients themselves according to an introduction sheet. They were provided with a DBS card, a 1.8-mm lancet, an alcohol prep pad, and packaging material with desiccant.
The returned samples were analyzed using the developed DBS-UHPLC–MS/MS method. A 89.6 ng/mL measure of codeine was detected in sample 1 and 39.6 ng/mL of oxycodone in sample 2. The MRM data quality was sufficient enough to be used for screening against a spectral library to confirm the identity of the quantified compounds. The software displayed the chromatographic peak, the calculated concentration according to the calibration function, and the results from the library search (Figure 2).
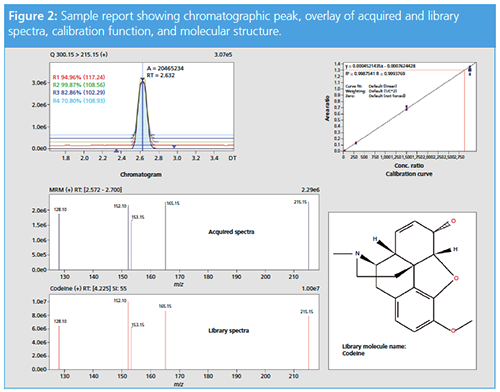
Both patient samples contained a drug concentration below the cut-off level of abuse (89.6 ng/mL codeine, cut-off 300 ng/mL, and 39.6 ng/mL oxycodone, cut-off 100 ng/mL), which demonstrates a good therapeutic dosage. In addition, a morphine signal was detectable in the patient taking codeine; typically, approximately 10% of the codeine is metabolized via CYP2D6 to morphine.
The full automation of the analysis workflow is important to exclude error sources. Each process was monitored and documented automatically and large batches of samples were measured overnight without any human interaction. Each dried blood spot card was prepared and handled the same way in a standardized process. Analytes are less stable in solution, and this method minimized the time period where those remained in solution. Using this method, the analysis of one sample took 10 min.
Conclusion
A new workflow for drug screening in large populations was introduced for a panel of 12 drugs of abuse from a wide variety of structural categories. The analysis process is fully automated by using DBS-UHPLC–MS/MS. The feasibility for such an approach was shown and the method was successfully applied to real cases to demonstrate the potential. The panel was chosen with a variety of different illicit and legal drugs from different substance classes to cover a broad field of substances. Highly active drugs, such as LSD and fentanyl, which appear in very small blood concentrations, were included in the panel and quantified at their cut-off concentration. The process from sampling to generating the report was linked with a barcode system to enable forensic applications. Each process step was well documented and all analysis steps followed good laboratory practice (GLP). The method can be easily extended and validated according to individual laboratory guidelines.
Stefan Gaugler is a diagnostic specialist in the field of dried blood spot analysis. He has been working in the field of DBS for 5 years and is currently in the final stage of his Ph.D. at the University of Zaragoza, Spain. He coordinates all of the worldwide scientific DBS projects for Camag, travelling extensively to develop and transfer new methods in this field.
Jana Rykl is an application chemist for HPLC and mass spectrometry, with deep knowledge in protein, peptide, and small molecules identification and quantitation. She provides technical support for analytical instruments and data evaluation software for Shimadzu customers in Switzerland.
Matthias Grill is an organic chemist at Lipomed in Arlesheim, Switzerland, and specializes in the synthesis of small- to medium-sized molecules.
Vicente Cebolla is a researcher from ICBâCSIC in Zaragoza, Spain, with longâterm experience in analytical chemistry of complex samples. His research focuses on separation of lipid mixtures (biodiesel, sphingolipids in human plasma, and phospholipids in bacteria) by high-performance thinâlayer chromatography, using gradient elution with AMD 2 (automated multiple development), and structure elucidation by coupling HPTLC with tandem MS and HRMS.
E-mail:shimadzu@shimadzu.eu
Website:www.shimadzu.eu
Advances in Non-Targeted Analysis for PFAS in Environmental Matrices
March 27th 2025David Megson from Manchester Metropolitan University in Manchester, UK, spoke to LCGC International about the latest developments in non-targeted analysis (NTA) of per- and polyfluoroalkyl substances (PFAS) in environmental matrices based on a recent systematic review paper he has collaboratively published (1).
Study Explores Thin-Film Extraction of Biogenic Amines via HPLC-MS/MS
March 27th 2025Scientists from Tabriz University and the University of Tabriz explored cellulose acetate-UiO-66-COOH as an affordable coating sorbent for thin film extraction of biogenic amines from cheese and alcohol-free beverages using HPLC-MS/MS.
Multi-Step Preparative LC–MS Workflow for Peptide Purification
March 21st 2025This article introduces a multi-step preparative purification workflow for synthetic peptides using liquid chromatography–mass spectrometry (LC–MS). The process involves optimizing separation conditions, scaling-up, fractionating, and confirming purity and recovery, using a single LC–MS system. High purity and recovery rates for synthetic peptides such as parathormone (PTH) are achieved. The method allows efficient purification and accurate confirmation of peptide synthesis and is suitable for handling complex preparative purification tasks.

