Automated Aroma and Flavour Profiling of Honey Using High-Capacity Sorptive Extraction
Honey is prone to food fraud, where either a less desirable honey is misrepresented as a more desirable one, or honey substitutes are used to bulk the original product. This article demonstrates how high-capacity sorptive extraction can be used to extract aroma compounds spanning a wide volatility range from different honey samples. Automated statistical analysis was used to uncover subtle differences between the honey samples, to determine possible markers of authenticity and help to combat fraud.
Honey is a natural aromatic sweetener comprising 95% water and sugars. The remainder comprises flavonoids, proteins, vitamins, free amino acids, and volatile organic compounds (VOCs), which give different honey varieties their distinctive characteristics (1). Unfortunately, honey is open to food fraud, where an inexpensive honey is misrepresented as a more desirable one, or honey substitutes such as cheap sweeteners or sugar syrups are used to add bulk to the original product (2). Traditional authentication techniques, such as solid‑phase microextraction (SPME) and solvent extraction, are becoming obsolete because they involve time‑consuming sample preparation and pollen analysis by specially trained analysts. As a result, a new type of analysis is required. This article demonstrates how a high-capacity sorptive extraction technique can be used to sample key aroma compounds in different types of honey samples to assess their potential for use as unique markers of authenticity. The different properties of the compounds in honey mean that sorptive phase combinations must be selected carefully to maximize uptake and achieve the most comprehensive profile.
Experimental
The samples analyzed were five different varieties of honey, including a mass market honey, hobbyist honey, forest honey, Manuka honey, and Welsh honey. A sample of golden syrup was also used as a sixth sample for comparison. The samples were prepared in a 20 mL headspace vial containing 1 g of sample and 1 mL of water. Vials were crimp-capped and sonicated, and the analytes extracted from the headspace (Figure 1). For headspace extraction, HiSorb DVB/CWR/PDMS inert-coated (H4-AXAAC) probes were used, with the whole process being fully automated using a Centri 360 extraction and enrichment instrument (all Markes International). Each sample was analyzed five times for reproducibility, and the scan range on the gas chromatography–mass spectrometry (GC–MS) system was 35–450 m/z. The software used for data mining and chemometrics was ChromCompare+ (SepSolve Analytical).

Results
Aroma Profiling of Honey:
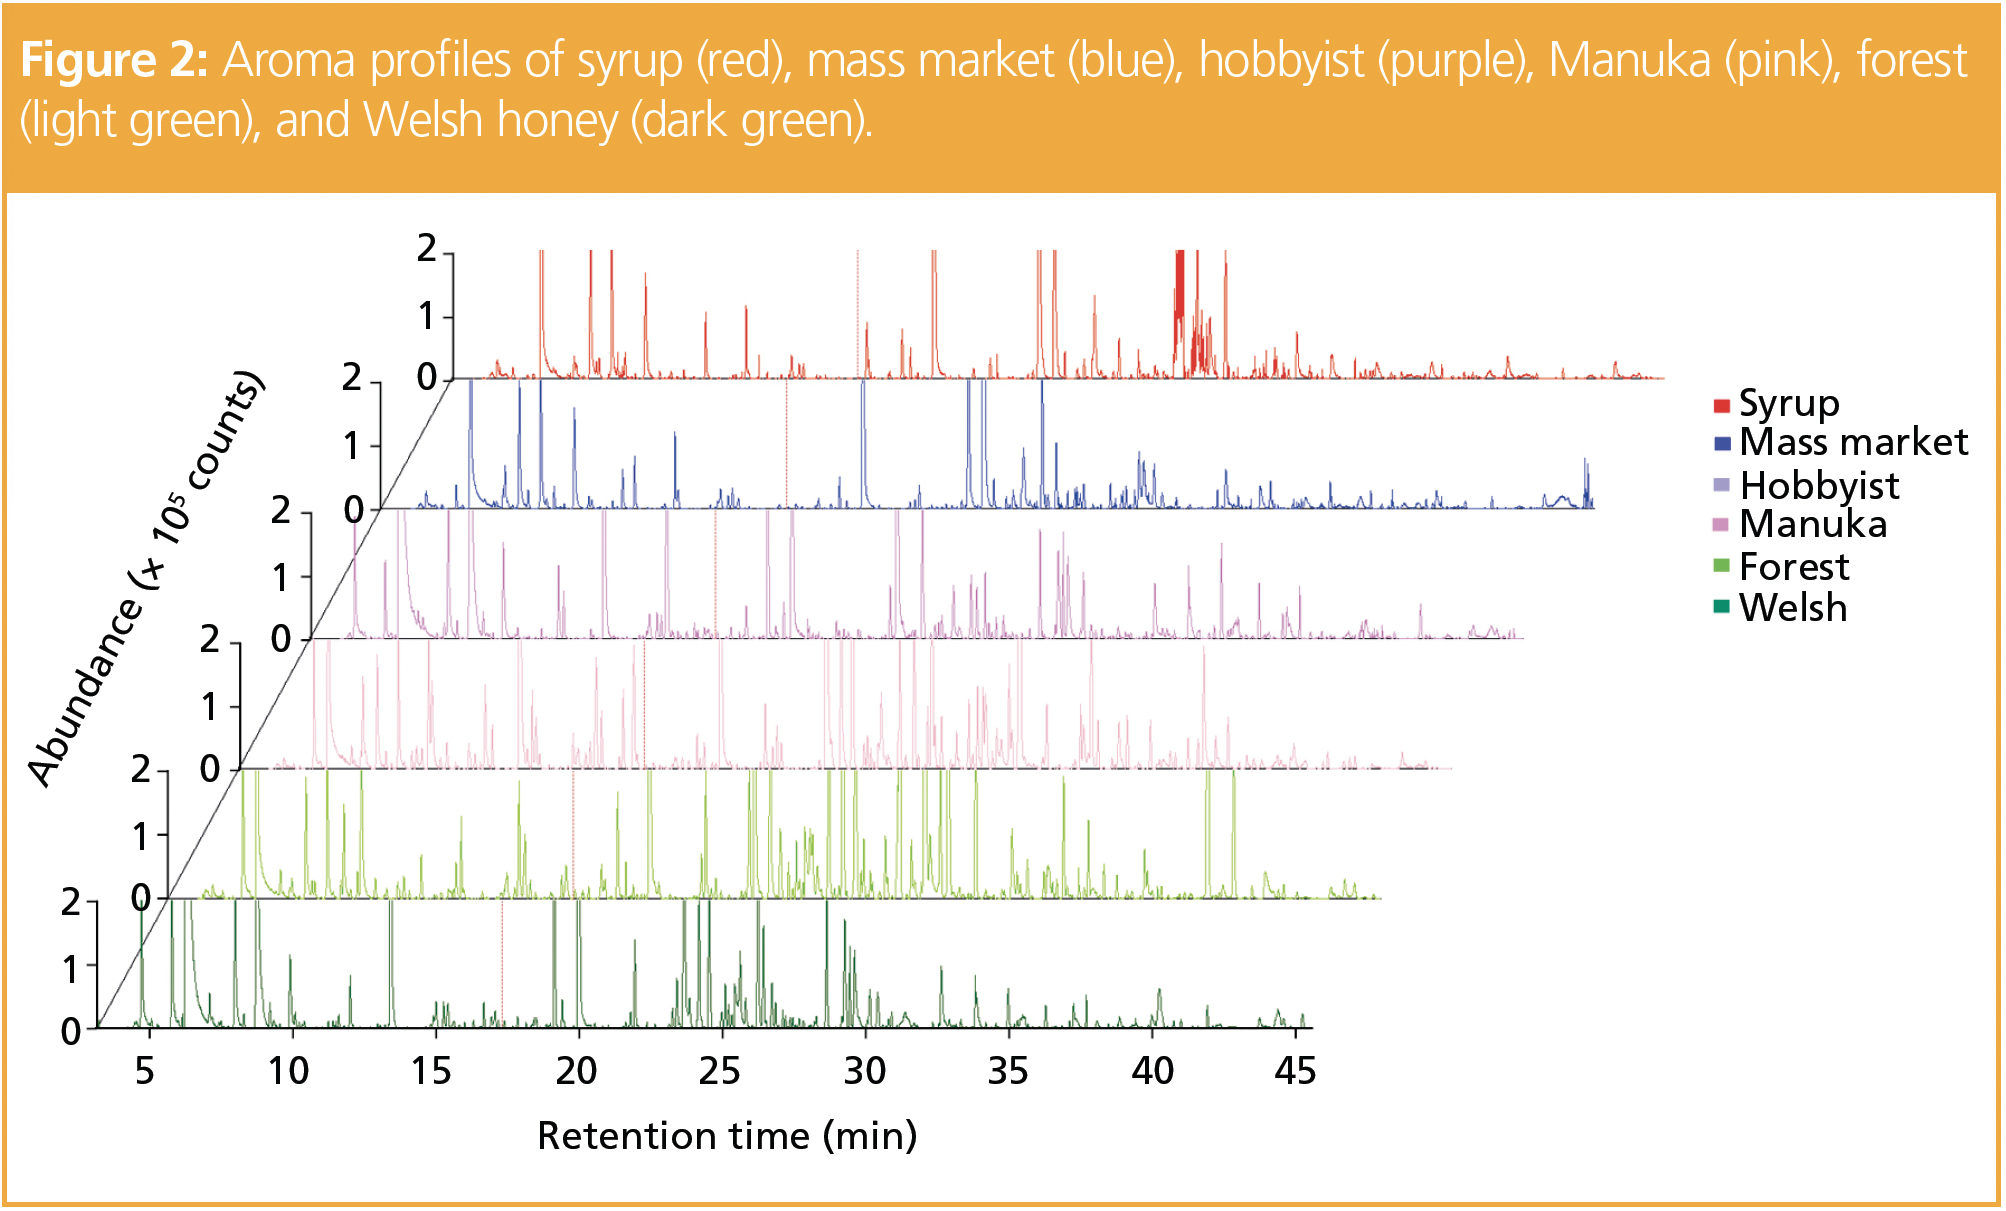
The aroma profiles generated for each sample (Figure 2) indicated that some compound classes were common to all the honey samples, but others differed between samples. Each class contributed characteristic aromas; for example, ketones, common in all samples, confer buttery and nutty odours.
Multiple esters were discovered in all samples, which was not unexpected given that this group of compounds provides sweet and fruity aromas. Aldehydes were prominent, bestowing fresh, green, and herbal notes. Alcohols, which add fresh flavours to honey, were a large component. They can occur naturally or as a result of heat treatment during processing (3).
Furans, known for their sweet woody notes, are also common in honey and are typically present because of the dehydration of reducing sugars in the matrix. Their presence can also indicate that thermal processes and storage after collection from hives have degraded the sugars in the honey (2).
Overall, the honey profiles had common descriptors of fruity and sweet notes. However, naphthalene, an aromatic hydrocarbon commonly derived from coal, was also highlighted as an odour in one honey sample. This off-odour may have come from the smoke used by beekeepers to calm bees before removal of honey from hives (4).
Combatting Food Fraud Using Markers:
To distinguish the key variances between samples, a custom library of VOCs in each sample was created using the software, and provided quantitative and qualitative analysis of one-dimensional (1D) and two‑dimensional (2D)-GC–MS data. A total of 79 compounds with match factors above 850 and probabilities above 85% were used to generate the library. Alignment and comparison of the chromatographic data shown in Figure 2 led to the formation of a principal components analysis (PCA) score plot (Figure 3).
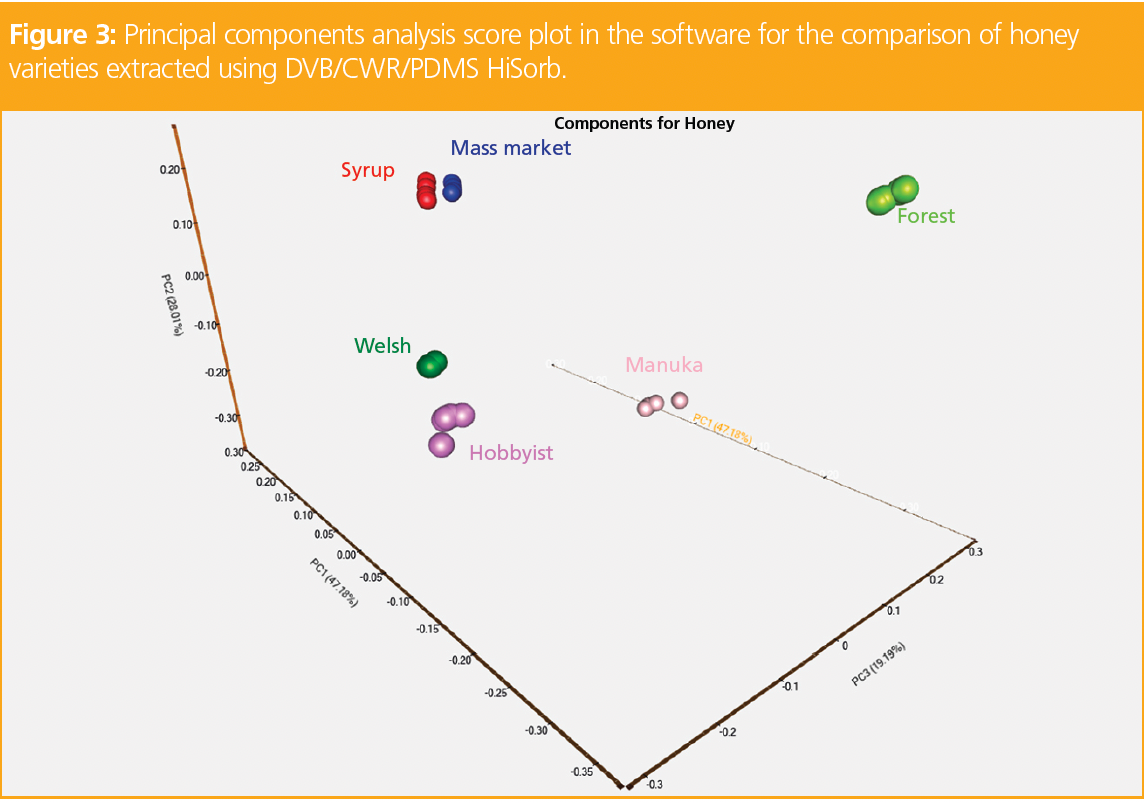
The mass market honey was very similar to the syrup sample, as they both cluster closely in the PCA plot, indicating that additional sugars may have been added to bulk the honey product. The Welsh and hobbyist honeys also had similarities, suggesting that they have a similar geographical origin. The Manuka and forest samples were the most distinctive varieties, which can be seen by the distance in the clustering compared to the other honey samples.
Twenty key aroma compounds were determined as differentiating significantly between the samples. Figure 4 demonstrates the abundance of these compounds by sample type. Compounds that are specific to a particular sample have the potential to be used as markers for declarations of sample origin.
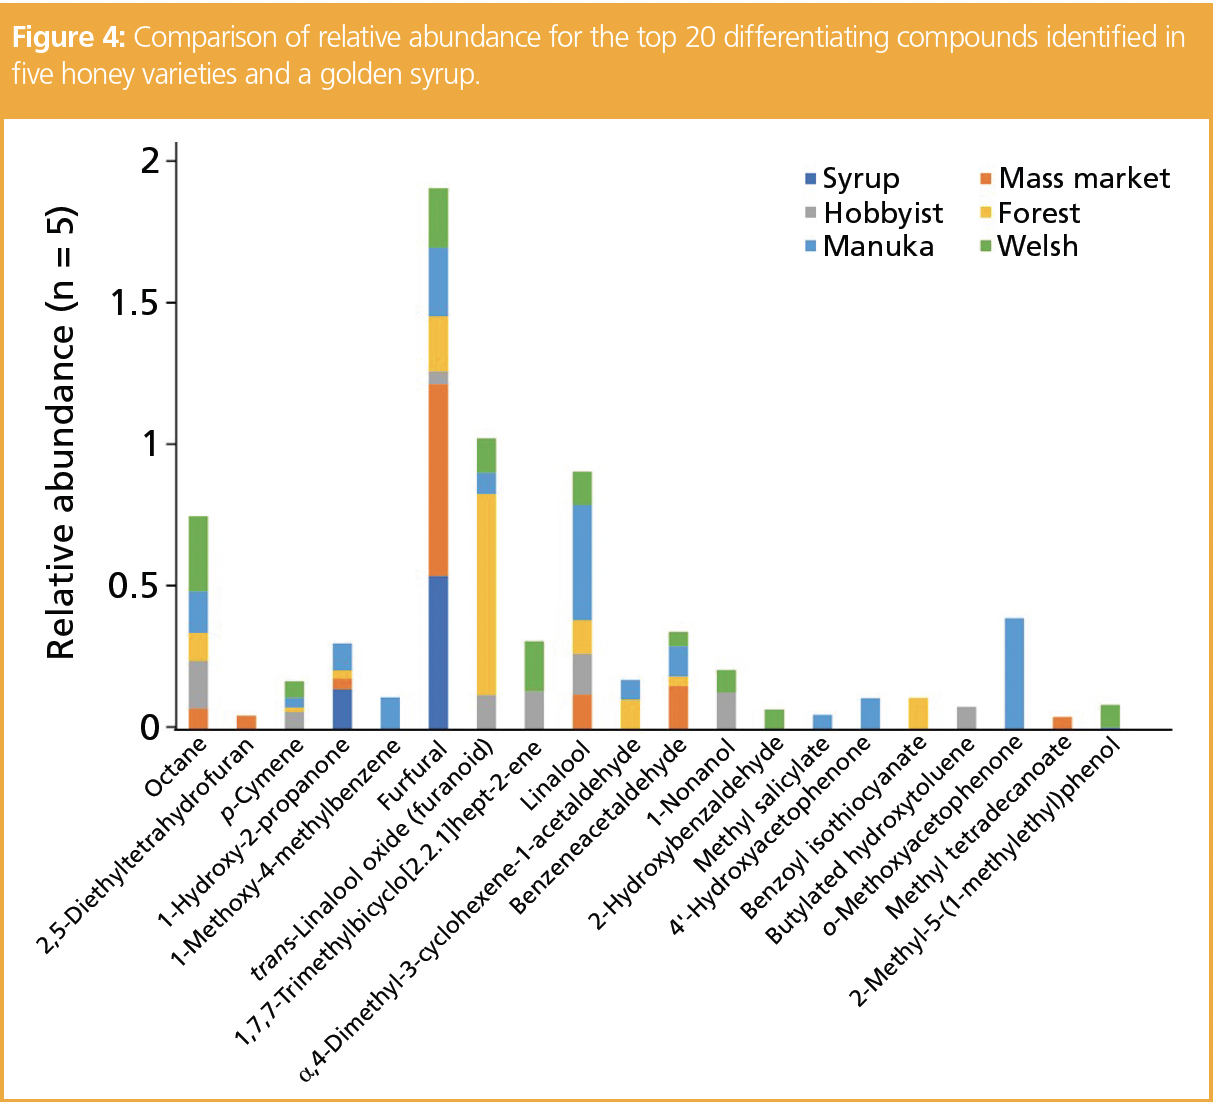
The unique marker compounds found in the luxury Manuka honey are 1-methoxy‑4‑methylbenzene, which has a phenolic, minty aroma, 4’-hydroxyacetophenone, which has a floral, sweet aroma, methyl salicylate, which has a wintergreen, mint aroma, and o-methoxyacetophenone, which provides an anisic, almond, and cherry aroma. As these compounds were only present in the Manuka honey, they could be used as confirmatory markers when classifying samples of unknown origin that are labelled as Manuka.
Conclusions
Analysis of the VOC content of foodstuffs is important in the food and beverage industry, with a wide range of applications in research and development, quality control, shelf-life assessment, and the detection of food fraud. A common technique in food VOC profiling is sorptive extraction, wherein compounds partition from food onto a sorptive phase and are transferred to analytical instrumentation such as a GC–MS system for separation and detection (5). Sorptive extraction offers a highly sensitive, robust, and fully automatable extraction solution, and provides excellent results in GC–MS‑based analysis of foodstuffs.
This article has demonstrated that sorptive extraction is a highly efficient technique for the VOC profiling of honey samples. The technique was used to extract a wide range of compounds, particularly those with key aroma and flavour properties.
References
(1) Baroni, M. V.; Nores, M. L.; Del Pilar Díaz, M.; et al. Determination of Volatile Organic Compound Patterns Characteristic of Five Unifloral Honey by Solid-Phase Microextraction−Gas Chromatography−Mass Spectrometry Coupled to Chemometrics. J. Agric. Food Chem. 2006, 54, 7235–7241. DOI: 10.1021/jf061080e
(2) Missio da Silva, P.; Gauche, C.; Gonzaga, L. V.; Oliveira Costa, A. C.; Fett, R. Honey: Chemical Composition, Stability and Authenticity. Food Chem. 2016, 196, 309–323. DOI: 10.1016/j.foodchem.2015.09.051
(3) Gianelli Barra, M. P.; Ponce-Díaz, M. C.; Venegas-Gallegos, C. Volatile Compounds in Honey Produced in the Central Valley of Ñuble Province, Chile. Chil. J. Agric. Res. 2010, 70, 75–84. DOI: 10.4067/S0718-58392010000100008
(4) BBC Science Focus Magazine, How Does Smoke Subdue Bees? https://www.sciencefocus.com/nature/how-does-smoke-subdue-bees/ (accessed 2023-08-10).
(5) Markes International, HiSorb High-Capacity Sorptive Extraction Phase Evaluation for Aroma and Flavour Profiling of Honey, Markes International Application Note 279.
Rachael Szafnauer received an MSci in forensic science from the University of South Wales, UK, where her final‑year project focused on fingerprinting emerging psychoactive substances using advanced techniques such as GC×GC–TOF-MS, in collaboration with Markes International. She later took up the role of thermal desorption product specialist at Markes, providing technical and application support to the commercial team, before taking on her current role as product marketing manager and specializing in the development of applications using extraction and enrichment techniques for GC–MS.
Email: rszafnauer@markes.com
University of Rouen-Normandy Scientists Explore Eco-Friendly Sampling Approach for GC-HRMS
April 17th 2025Root exudates—substances secreted by living plant roots—are challenging to sample, as they are typically extracted using artificial devices and can vary widely in both quantity and composition across plant species.
Thermodynamic Insights into Organic Solvent Extraction for Chemical Analysis of Medical Devices
April 16th 2025A new study, published by a researcher from Chemical Characterization Solutions in Minnesota, explored a new approach for sample preparation for the chemical characterization of medical devices.
Sorbonne Researchers Develop Miniaturized GC Detector for VOC Analysis
April 16th 2025A team of scientists from the Paris university developed and optimized MAVERIC, a miniaturized and autonomous gas chromatography (GC) system coupled to a nano-gravimetric detector (NGD) based on a NEMS (nano-electromechanical-system) resonator.


