Atmospheric Pressure Photoionization — The Second Source for LC-MS?
LCGC North America
This article explores the progress that atmospheric pressure photoionization (APPI) has made in its relatively short history for LC–MS analysis. Specifically, the authors examine the combination of APPI and electrospray ionization (ESI).
Electrospray ionization (ESI) and atmospheric pressure chemical ionization (APCI) have dominated liquid chromatography–mass spectrometry (LC–MS) instrumentation for many years. Atmospheric pressure photoionization (APPI) is a relative newcomer, expanding the range of compounds that can be ionized and has become the source of choice for many applications. If not for the legacy and history of ESI and APCI, APPI might be more than just the third option of choice(1,2).
In this article, we review the progress made in recent years in understanding and exploring the unique properties of APPI, leading to a continual enhancement in both source performance and range of applicability. With several years of research demonstrating the benefits of APPI over APCI, in addition to other advantages not afforded by ESI or APCI, it is worth asking whether APPI should supplant APCI as the second choice to ESI. The APPI source can prove to be the most versatile of available sources for small molecule analysis. However, ESI is expected to dominate for the foreseeable future, and certainly for ionization of very large molecules (for example, proteins) for which there is little other choice for LC–MS.
Ionization Mechanisms
ESI and APCI mechanisms:An insightful discussion on LC–MS ionization mechanisms was given recently in this magazine by Balogh (3), and we briefly will summarize it for ESI and APCI here. ESI, being a liquid-phase ionization process, is well suited to LC. However, the ions still must be removed from the ESI droplet spray to be analyzed by MS. Much has been written about the cascade of events under which the charged droplets liberate their ions into the gas phase (4). This involves evaporation, followed by a coulomb explosion that sprays off numerous charged nanodroplets (5). The primary droplets continue to shrink by this repeated process. Ultimately, the ions become isolated in the gas phase either by a combination of evaporation of charged nanodroplets or by an electric-field-induced mobility of the ions out of nanodroplets.
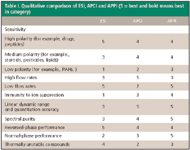
Table I. Qualitative comparison of ESI, APCI and APPI (5 = best and bold means best in category)
APCI, like APPI, requires vaporization of the liquid sample stream first, which is achieved by nebulization and heating. The mechanism of APCI is based upon a corona-needle discharge, producing a high density of charges, for example, electrons and protons, which interact with surrounding molecules and subsequently reach a rapid, thermodynamic equilibrium and corresponding ion distribution. As the solvent molecule is in high abundance, it is the primary charge carrier and results in a charge transfer to the analyte molecule when the thermochemistry is favorable. The ionization efficiency of analyte is favored by ionization potentials lower than or proton affinities higher than the surrounding solvent molecules. However, if other molecules are present — for example, impurities or coeluents — that form more stable ions than the desired analyte, the analyte ion signal can be suppressed due to competition for the available charge.
As different as ESI and APCI are, the final type and distribution of ions formed are very similar. This is because both mechanisms are based upon charge carriers and, thus, the most thermodynamically stable distribution of ions will be similar. The formation of positive ions is generally by proton transfer, as portrayed in Figure 1, while negative ions are formed by electron attachment. For ionization methods based upon charge competition, there generally will be winners and losers, and some analyte molecules will not ionize efficiently, if at all, and those that do might be prone to ion suppression due to competitive thermochemical reactions. In the case of ESI, sodium ion (Na+ ) often leads to the formation of [M+Na]+ adduct ions. In a sense, this is another form of charge competition, in that [M+Na]+ competes with the formation of [M+H]+. The ratio of these ions and ion adducts can vary with subtle changes in source conditions, sometimes making quantitative measurements challenging.
APPI mechanism: The photoionization mechanism is simplified under vacuum conditions: photon absorption by the analyte molecule, leading to electron ejection, forming a molecular radical cation M. + . This process is similar to electron ionization common to gas chromatography (GC)–MS, except that the ionization process is soft, that is, there is less fragmentation. In the atmospheric region of an LC–MS system, the ionization mechanism becomes more complex. The unpredictable fate of ions generally is detrimental to LC–MS analysis, but like most processes, once they are better understood, these properties can be exploited to enhance performance. For example, the role of dopant in APPI, first developed and patented for the atmospheric ion source of ion mobility spectrometry (IMS), was adapted to APPI for LC–MS (6,7). The basic APPI mechanisms can be summarized in Table II.

Table II
The fundamental process in photoionization is the absorption of a high-energy photon by the molecule and subsequent ejection of an electron. In direct APPI, this process occurs for the analyte molecule, forming the molecular radical cation M. + . The analyte radical cation can be detected as M. + or it can react with surrounding molecules and be detected as another ion. The most common reaction is the abstraction of a hydrogen atom from the abundant solvent to form the stable [M+H]+ cation, which is usually the observed ion (8).
In dopant APPI [or photoionization-induced APCI (12)], a quantity of photoionizable molecules (for example, toluene or acetone) is introduced into the sample stream to create a source of charge carriers. Use of a photoionizable solvent achieves the same effect. The dopant or solvent ions can then react with neutral analyte molecules via proton transfer or charge exchange reactions. The previously mentioned dopant mechanism simplifies the dopant process. In fact, there can be extensive ion–molecule chemistry between dopant and solvent before the analyte becomes ionized. APPI also can produce negative ions by creating a high abundance of thermal electrons from dopant or solvent ionization, or by photons striking metal surfaces in the ionization source. Two commercially available APPI sources take different approaches to photoionization. One source is designed specifically for dopant APPI, including a reaction tube in which dopant-ion reactions are enhanced (MDS Sciex, Concord, Ontario, Canada). The other source is designed for direct APPI, consisting of an open geometry with a high intensity lamp (Syagen, Tustin, California); however dopant-APPI also can be performed with this source.
The process of direct APPI is not as prone to charge-competition. Photons are egalitarian, crossing any molecule in their path. In this regard, as shown in Figure 1, an analyte molecule X has just as great of a chance of being ionized whether or not a lower ionization potential molecule Y is present. Consequently, APPI is much less prone to ion suppression than either ESI or APCI (9,10). Dopant APPI is similar to APCI, however, in that charge carriers are created to promote analyte ionization, and are therefore somewhat susceptible to ion suppression. This is not to say that direct APPI is entirely immune to ion suppression, because once photoions are formed they can undergo further ion molecule chemistry. However, the desired ions are formed initially, as opposed to APCI and ESI, where competition for charge can prevent the desired ions from forming in any useful yield.
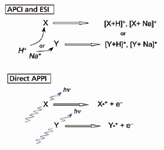
Figure 1: Schematic representation of the mechanisms of positive ionization for APCI, ESI, and direct APPI.
As molecules with ionization potentials (IPs) lower than the Kr lamp energies of 10.0 and 10.6 eV will be ionized efficiently, the factors that most affect APPI sensitivity are solvent properties and source conditions (11,12). Solvent has the potential to interfere with analyte ionization, because it can compete for the absorption of photons. If the solvent IP is greater than the lamp photon energy and has an appreciable photon-absorption cross section, then the photon can be absorbed and the energy dissipates uselessly. Solvents with high IPs include the aqueous reversed-phase solvents water (IP = 12.6 eV), acetonitrile (12.2 eV), and methanol (10.8 eV). If the solvent IP is comparable to or less than the lamp energy, then the absorbed photon can ionize the solvent molecule, producing a charge carrier that can then go on to ionize analyte ions. Solvents with lower IPs include normal-phase or nonaqueous reversed-phase solvents such as hexane (IP = 10.1 eV), isooctane (9.86 eV), and isopropyl alcohol (10.2 eV). It should be noted that solvent dimers, which are present in about 1–100 ppm abundance (depending upon temperature and flow rate) have about 1 eV lower IP than the solvent monomer and are often ionizable. Methanol (dimer IP = 9.74 eV) is an example of this, and therefore the use of methanol enhances APPI, in contrast to acetonitrile, for which the dimer IP is still too high to ionize (12). Acetonitrile has the additional disadvantage of having a very high absorption cross section and is believed to participate adversely in ion-molecule chemistry (13).
Because APCI depends upon the solvent to generate charge carriers, its sensitivity diminishes at lower flow rates. This is opposite to APPI, which excels at low flow rates, because it does not necessarily require the solvent for ionization. Moreover, lower flow rates result in less solvent absorption of photons. Additionally, APPI sensitivity can be compromised even at high flow rates, as solvent photoabsorption can compete with analyte photoionization. For very high flow rates (for example, 1 mL/min), APCI typically will surpass APPI in sensitivity. However, this can be equalized by using dopants or mobile-phase solvents (for example, hexane, isopropyl alcohol) that photoionize.
On the whole, APPI provides excellent coverage of a wide range of compounds for a wide range of LC–MS conditions. Figure 2 portrays the "strike zone" for APPI, APCI, and ESI on a polarity versus molecular weight scale. APPI has a wider range of applicability than APCI, and essentially covers the entire APCI compound range.
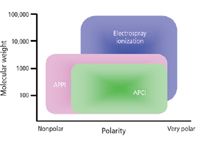
Figure 2: Portrayal of range of ionization by ESI, APCI, and APPI as a function of compound polarity and molecular weight.
Results
The ionization properties of ESI, APCI, and APPI clearly are evident in analytical observations. We present a couple of recent studies from our laboratory to demonstrate these effects. Much has been published on more common applications such as drugs (14–16), steroids (17,18), and PAHs (19). All three sources do well on polar, basic-type molecules, such as drugs. However, less polar compounds, such as steroids and especially PAHs, are ionized poorly by either ESI or APCI in comparison to the relatively efficient APPI. APCI has an advantage in ionizing less polar compounds than ESI, but is less effective than APPI at low-polar to nonpolar molecule ionization.
We focus here on the properties of less-polar compounds, as acceptable methods for these compounds prove to be a greater challenge for the analytical chemist. Interestingly, less-polar compounds are not very soluble in aqueous mobile-phase solvents such as methanol, water, and acetonitrile, and therefore nonaqueous, reversed-phase, or normal-phase solvents might be preferable. These solvents (for example, hexane, heptane, and isooctane) are not ideal for APCI and ESI, because they are not effective charge carriers. However, they are excellent solvents for photoionization, because they are either passive to the photoionization process or they photoionize as noted previously, and thus, provide a self-doping effect.
Figure 3 contains the full mass spectra of the methyl ester of eicosapentaenoic acid recorded either by ESI, APCI, or APPI. This compound was one of several lipid compounds studied using these ionization sources (20,21). The most notable features are that APPI and APCI mass spectra look nearly identical; the APPI signal is nearly twice as strong as APCI; the ESI spectrum is congested and weak without a modifier, and the strongest analyte ion is the adduct ion [M+Na]+; and the ESI spectrum recorded with a modifier is strong, but still congested including strong signal due to the adducts [M+Na]+ and [M+NH4]+.
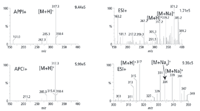
Figure 3: Eicosapentaenoic acid methyl ester full scan mass spectra. APPI and APCI mobile phase was hexane, ESI mobile phase was 1:1 isooctaneâisopropyl alcohol without or with 10 mM ammonium formate.
Figure 4 shows linearity plots for another lipid compound similar to eicosapentaenoic acid methyl ester, monoarachidin (22). Again APPI and APCI give similar and excellent results; however, the sensitivity of APPI is enhanced three- to fourfold. ESI signal without a modifier is very weak, and with a modifier, the signal is strong, but very nonlinear.
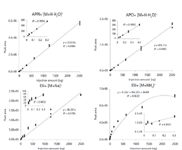
Figure 4: Monoarachidin linearity plots. Mobile phase: 1:1 isooctaneâisopropyl alcohol (APPI and APCI); 10:15:1 isooctaneâisopropyl alcoholâwater with 15.4 mM sodium acetate (ESI sodium adduct) and 1:1 isooctaneâisopropyl alcohol with 10 mM ammonium formate (ESI ammonium adduct).
In the final example, we present a comparison of APCI and APPI for a variety of chiral compounds measured by a method to enhance enantiomeric separation (22). These compounds are mephenesin, a muscle relaxant, benzoin, an antiseptic, and naringenin, a nutraceutical. Figure 5 demonstrates that under chromatographic conditions, optimum for chiral separations (see figure caption) that these compounds are observed with considerably greater sensitivity by APPI versus APCI, with signal-to-noise ratios being 10 to over 100 times greater using APPI.

Figure 5: LC separation of enantiomers of three drug compounds. SIM was performed for [M+H]+ in each case. Column: 150 mm à 2.1 mm, 5-μm ChiralPak AD-H; mobile phase (mephenesin): 85:15 hexaneâethanol at 0.2 mL/min, isocratic; mobile phase (benzoin): 9:1 hexaneâisopropyl alcohol at 0.2 mL/min, isocratic; mobile phase (naringenin): 8:2 hexaneâisopropyl alcohol at 0.2 mL/min, isocratic.
Discussion and Conclusions
Table I presents a qualitative comparison of the operational properties of ESI, APCI, and APPI. Though the ranking can be considered subjective, it does allow "better than" or "worse than" comparisons within several categories. ESI is the best choice for polar compounds such as drugs and is by far the best choice for larger molecules, such as peptides and proteins. For other compounds, APCI and APPI should be the preferred choice, with an advantage toward APPI in many important respects, except at very high flow rates (for example, 1 mL/min) and for small molecules such as smaller alkanes (smaller than hexane) and halocarbons. If one is to accept the body of evidence and the subjective rankings in Table I, it would seem that ESI and APPI are the most versatile combination for meeting a wide range of analytical needs. That APPI is not more commonly used is probably indicative of its short history rather than its performance. Familiarity breeds commonality, which explains the widespread use of ESI, even in cases where APCI or APPI would be better suited. However, in this competitive world there is an edge to be had for those who incline toward performance versus familiarity.
With the performance benefits of APPI becoming more widely known and exploited, further developments are inevitable. Some of the paths to future improvements include multimode sources involving ESI and APPI (23,24) and possibly even a triple source including APCI. The currently used RF discharge Kr lamps for APPI provide high photon radiance; however, more intense lamps are under development. Also, the use of other gas fills such as Ar have shown enhanced sensitivity compared with Kr for some applications, particularly for reversed-phase LC–MS using methanol (12).
References
(1) D.B. Robb, T.R. Covey, and A.P. Bruins, Anal. Chem. 72, 3653–3659 (2000).
(2) J.A. Syage, M.D. Evans, and K.A. Hanold, Amer. Lab. 32, 24–29 (2000).
(3) M.P. Balogh, LCGC 24(12), 1284–1290 (2006).
(4) M. Dole, L.L. Mack, R.L. Hines, R.C. Mobley, L.D. Ferguson, and M.B. Alice, J. Chem. Phys. 49, 2240 (1968).
(5) P. Kebarle, J. Am. Soc. Mass Spectrom. 35, 804–817 (2000).
(6) G.E. Spangler, J.E. Roehl, G.B. Patel, and A. Dorman, U.S. Patent 5,338,931 (Aug. 1994).
(7) H-R. Doering, G. Arnold, J. Adler, T. Robel, and J. Riemenschneider, U.S. Patent 5,968,837 (Oct. 1999).
(8) J.A.Syage, J. Amer. Soc. Mass Spectrom. 15, 1521–1533 (2004).
(9) K.A. Hanold, S.M. Fischer, P.H. Cormia, C.E. Miller, and J.A. Syage, Anal. Chem. 76, 2842–2851 (2004).
(10) M. Takino, S. Daishima, and T. Nakahara, Rapid Commun. Mass Spectrom. 17, 1965–1972 (2003).
(11) T. Kauppila, A. Bruins, and R. Kostianen, J. Am. Soc. Mass Spectrom. 16, 1399–1407 (2005).
(12) L.C. Short, S-S Cai, and J.A. Syage, J. Am. Soc. Mass Spectrom. 18, 589–599 (2007).
(13) E. Marotta, R. Seraglia, F. Fabris, and P. Traldi, Int. J. Mass Spectrom. 228, 841–849 (2003).
(14) Y. Hsieh, K. Merkle, G. Wang, J.-M Brisson, and W.A. Korfmacher, Anal. Chem. 75, 3122 (2003).
(15) K.S. Hakala, L. Laitinen, A.M. Kaukonen, J. Hirvonen, R. Kostiainen, and T. Kotiaho, Anal. Chem. 75, 5969–5977 (2003).
(16) C. Yang and J. Henion, J. Chrom. A 970, 155–165 (2002).
(17) M.J. Greig, B. Bolaños, T. Quenzer, and J.M. Bylund, Rapid Commun. Mass Spectrom. 17, 2763–2768 (2003).
(18) H.B. Theron, C. Coetzee, F.C.W. Sutherland, J.L.Wiesner, and K.J. Swart, J. Chrom. B. 813, 331–336 (2004).
(19) E.A. Straube, W. Dekant, and W. Völkel, J. Am. Soc. Mass Spectrom. 15, 1853–1862 (2004).
(20) S-S. Cai and J.A. Syage, J. Chromatogr. A 1110, 15–26 (2006).
(21) S-S. Cai and J.A. Syage, Anal. Chem. 78, 1191–1199 (2006).
(22) S-S. Cai, K.A. Hanold, and J.A. Syage, Anal. Chem. 79, 2491–2498 (2007).
(23) L.C. Short, K.A. Hanold, and J.A. Syage, Rapid Commun. Mass Spectrom. 21, 1561–1566 (2007).
(24) L.C. Short and J.A. Syage, Rapid Commun. Mass Spectrom. 22, 541–548 (2008).

Polysorbate Quantification and Degradation Analysis via LC and Charged Aerosol Detection
April 9th 2025Scientists from ThermoFisher Scientific published a review article in the Journal of Chromatography A that provided an overview of HPLC analysis using charged aerosol detection can help with polysorbate quantification.
Removing Double-Stranded RNA Impurities Using Chromatography
April 8th 2025Researchers from Agency for Science, Technology and Research in Singapore recently published a review article exploring how chromatography can be used to remove double-stranded RNA impurities during mRNA therapeutics production.


