Are You Getting the Most Out of Your HPLC Column?
Special Issues
This article provided guidance for working with the low-dispersion, small-volume columns that were gaining popularity in 2003. These considerations are still appropriate today with the short, narrow HPLC and UHPLC columns now in vogue. Anatomy
The Significance of This Article-Then and Now
When I wrote this article in 2003, low dispersion columns, especially sub-2-mm i.d. microbore, fused-silica capillary (0.05, 0.100, and 0.300 mm i.d), and chip columns, had been around for some time. These columns were used mostly with specialized instruments that were somewhat optimized for these smaller internal diameter columns, so the chromatographers using them were accustomed to having minimal-dead-volume connections, smaller flow cells, and even mass spectrometry interfaces. However, in the conventional high performance liquid chromatography (HPLC) world, most chromatographers were still using 4.6-mm i.d. columns, often 150 or 250 mm in length. Most instruments of the day were built for these higher volume columns and extracolumn volumes were of little consequence except, perhaps, for low k’ solutes. At Pittcon 2003, however, introductions of sub-2-µm columns took place and, because of their speed and efficiency advantage, they looked like they were going to catch on. Also, I saw our own chemists in the laboratory beginning to struggle with instrument design at the time and the factory was already working on a lower dispersion, higher pressure instrument. Thus, I thought it would be helpful to publish a basic article on extracolumn and gradient delay volume (dwell volume) effects, explaining where they originate, how to measure them, and how correct for or minimize them, as well as other instrumental considerations (for example, detector flow cell, data acquisition rates, injection volume, and so on). Even though this article was written 12 years ago, these same considerations are appropriate today with the short, narrow HPLC and ultrahigh-pressure liquid chromatography (UHPLC) columns now in vogue.
ABSTRACT
This article discusses low-dispersion columns, describes how to modify high performance liquid chromatography systems to work with the small-volume columns, and provides guidance about obtaining the optimum capabilities from these columns.
A trend in high performance liquid chromatography (HPLC) column technology is the increasing use of low-dispersion columns. Low-dispersion columns generally have much smaller void volumes (internal volume [Vm]) than those of popular, standard 150 mm × 4.6 mm or 250 mm × 4.6 mm analytical columns. The smaller column volumes can be the result of using shorter versions-for example, 30 mm × 4.6 mm or 50 mm × 4.6 mm-of the standard columns, which usually are packed with smaller particles. The smaller volumes also can result from using a column of similar or shorter length but with a much smaller inner diameter of 1 or 2 mm or even less. As columns become increasingly smaller, analysts must be aware of the greater demands on instrumental and experimental contributions that are relatively unimportant with the standard dimension columns. If not, they could be unable to take full advantage of these low-dispersion columns and might be disappointed in their analytical results.
Many laboratories are driven by the need for higher throughput, and one of the best ways to increase throughput is to switch to shorter columns packed with smaller particles, perhaps run at flow rates greater than 2 mL/min. Shorter columns provide decreased analysis times, and the smaller particles preserve the column efficiency and resolution. Thus, chromatographers can achieve nearly the same separation on a shorter column with smaller particles as they could on a longer column with larger particles. On the other hand, compared with conventional HPLC columns, small-diameter columns provide higher sensitivity in limited-sample situations. Columns of 1.0- or 2.0-mm i.d. are used at lower flow rates than conventional 4.6-mm i.d. columns, with flow rates usually inversely proportional to their radius ratios squared. In liquid chromatography-mass spectrometry (LC–MS) applications, certain ionization sources such as electrospray operate better with low flow rates and the combination of small inner diameters and short columns often is used to speed analyses and reduce solvent usage. Both types of columns have smaller Vm values, so they can be classified as low-dispersion columns. In addition, both column types save solvent and are more economical.
Many HPLC instruments in use today were designed for standard 150 mm × 4.6 mm or 250 mm × 4.6 mm columns. When using these standard columns, instrumental parameters such as extracolumn and dwell volumes (which I will explain below) were of relatively little concern for most chromatographers. Typical 20-50 µL injection volumes and 8–12 µL detector cell volumes could be tolerated easily and had minor influence on peak widths.
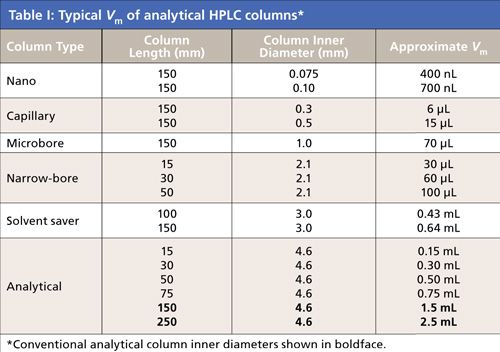
Table I shows Vm values of typical HPLC columns and those of some short, small-inner diameter columns. As the column volume becomes increasingly smaller, it puts constraints on the HPLC system. This installment of “Column Watch” discusses some of these constraints, how to measure them, and how to modify the HPLC system to work with the small-volume columns. It also provides some guidance about how to use the columns experimentally to gain their optimum capabilities. Without these columns’ best performance, users will be unable to realize the full potential of these new breeds of columns.
Extracolumn Volume and Its Effect
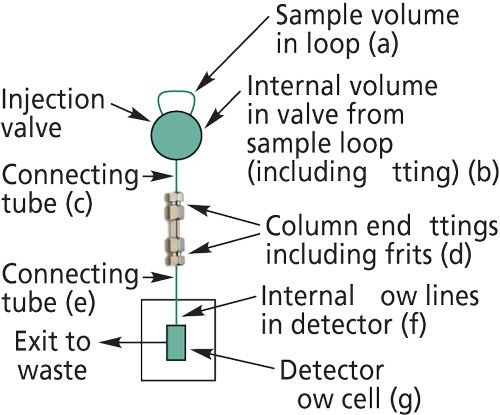
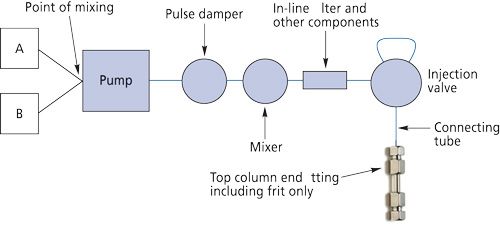
Extracolumn volumes are the volumes of mobile phase outside of the column packing that the analyte traverses as it moves from the point of injection to the detector flow cell exit. Figure 1 represents a schematic of the location of these volumes in a typical HPLC system. The important volumes are from the sample loop to the detector cell exit. The variances associated with these volumes are additive:

where

is the total extracolumn variance and

to

are the individual variances contributed by each of the volumes depicted in Figure 1. If the system had a guard column, it also would have its own extracolumn variances due to connecting tubing (if any) and endfittings with frits. The analytical column itself is not considered in equation 1.
If I also include the column, the total peak width of a chromatographic peak (wtot) can be defined as

or

where wcol is the peak width resulting from band broadening processes within the column itself and wext is the extracolumn contributions to the overall observed peak width. For any retained or unretained Gaussian-shaped peak, σ represents the standard deviation, and for this peak 95% of the peak area generally can be within the 4σ value.
Because variances are additive, any of the elements that make up these extracolumn variances can affect the entire system variance if it is too great. For example, if you were using a small-volume column with dimensions of 30 mm × 2.1 mm (Vm = 60 µL from Table I), and your HPLC detector had a low-volume flow cell (<5 µL), and you injected a small volume of sample (2 µL) but had a 1-m length of 0.02-in. (0.5-mm) inner diameter connecting tubing from your column to your detector (approximately 2 mL), then your system might have too much dead volume to provide satisfactory performance, and your peaks, especially those with low retention factor (k) values, would show band spreading, loss of efficiency and resolution, and a decrease in sensitivity. The band spreading and efficiency loss in the mobile phase results from solutes that display low-diffusion coefficients in liquids and from the parabolic flow profile in open tubes. These extracolumn volumes cause an increase in the peak width. Extracolumn volumes that might be tolerated in gas chromatography in which solute diffusion coefficients in the gas phase are much greater cannot be tolerated in the liquid phase in LC.
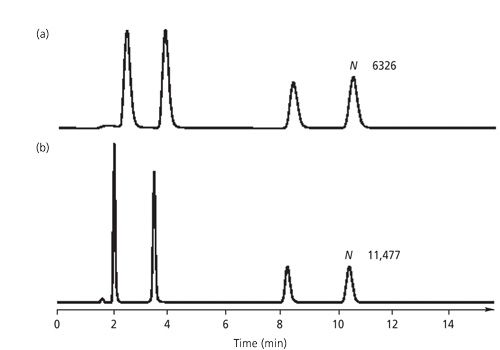
To illustrate the influence of extracolumn volume, Figure 2 shows the effect of artificially adding some extra volume to an otherwise optimized chromatographic system with only 5 µL of extracolumn volume. The column was a 150 mm × 2.1 mm narrow-bore column. A piece of capillary with 50-µL volume added into the flow lines between the column and the detector was used to mimic dead volume that might occur if users were unaware of portions of their flow streams contributing excess volume or were using an older system. The last-eluted peak exhibited a loss of 45% of its efficiency when the extra system volume was present. Extracolumn volume has a greater effect on peaks with lower retention (low k values) that are narrow than it does for larger k value peaks that are broader. Because the extra dispersion is rather constant, its contribution is more noticeable to peaks with small peak volume, as the first two peaks of Figure 2 show where the loss of efficiency is even more severe.
Estimating the Extracolumn Volume of an HPLC System
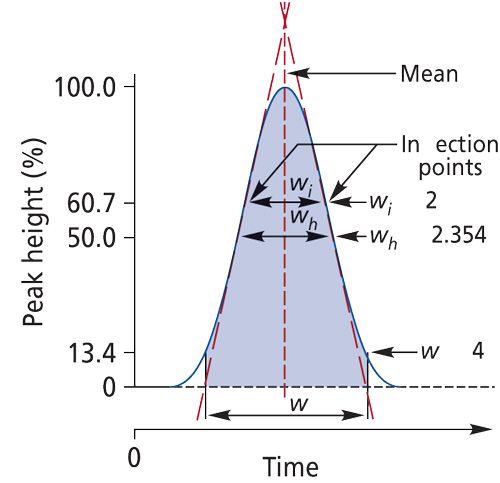
Because the extracolumn volume is the total volume from the injector to the detector exit without the column, the first step in estimating the extracolumn volume is to remove the column from the instrument. Join the injector connection tubing and the detector inlet tubing with a zero-dead-volume union. If the lines are not close enough to join together, use the shortest possible piece of stainless or polyetherether ketone (PEEK) capillary tubing with an inner diameter no bigger than 0.12 mm. This tubing will require the use of two zero-dead-volume unions. This setup will make a slight contribution to the extracolumn volume. Assuming that you are using a UV detector, set the wavelength to 254 nm and inject 0.5-2 µL of toluene at 1 mg/mL into a 100% acetonitrile or methanol mobile phase. From the chromatogram, measure the 4σ width of the toluene peak at its base by extrapolating to the baseline as shown in Figure 3. This width will represent the value of wext for the overall extracolumn contribution. Modern chromatography data systems will determine the peak width automatically so you don’t have to measure it by hand. Be sure to use a fast data-acquisition rate so the peak width of toluene is determined accurately.
Next, estimate how much extracolumn volume can be tolerated for some typical HPLC column and instrument configurations. A 10% loss of resolution arises when

A peak with k of 2 eluted from a 100 mm × 2.1 mm, 5-µm dp narrow-bore column, with a plate count of 6000, has a standard deviation (σcol) of 9.4 mL. The allowable extracolumn dispersion for a 10% loss in resolution would be σext = 0.5 × 9.4 µL = 4.7 mL; therefore wext = 18.8 µL. In comparison, a drop of water is roughly 30 µL.
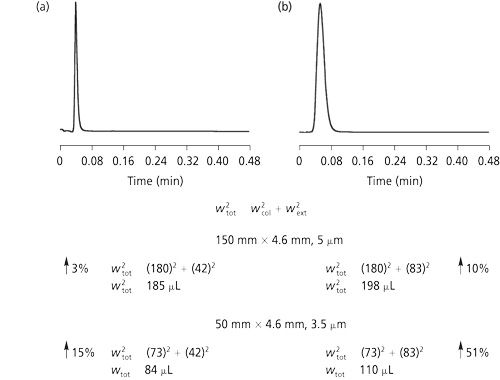
To see the effect for some actual column data, consider Figure 4. Figure 4 compares the effect of extracolumn volume in two instruments with different wext values and two columns--a conventional 150 mm × 4.6 mm, 5-µm dp column (wcol = 180 µL) and a 50 mm × 4.6 mm, 3.5-µm dp shorter, low-dispersion column (wcol = 73 µL). Figure 4 shows the effect of instrumental contributions on two columns. Instrument 1 was a low-volume instrument with wext of 42 µL, and instrument 2 was a higher-volume instrument with wext of 83 µL. Note the effect of the additional 41-µL volume on the conventional column was quite modest, varying from 3% additional bandwidth on the low-volume instrument to 10% on the higher-volume instrument. For the high-efficiency short column, however, the same added volume caused a 51% increase in bandwidth for instrument 2 but only a modest 15% for the low-volume instrument 1.
What if you don’t want to go through the trouble of determining the extracolumn variances for your instrument? Assuming that you haven’t modified your instrument since purchase, you could request this information directly from the instrument manufacturer. Another possibility is to purchase a low-dispersion column from a reputable manufacturer and run the unretained compound test and compare it with the test chromatogram from the manufacturer. In most test chromatograms shipped with HPLC columns, an unretained compound can be used as a benchmark for particular HPLC systems. Column manufacturers invariably will test their high-efficiency columns on an optimized instrument, so the column shows its optimum performance. Thus, if your test chromatogram shows more band broadening than the test chromatogram shipped with the column, then most likely your instrumental extracolumn contribution is significant. The instrument could require modification to get the optimum performance from an low-dispersion column.
System Dwell Volume and Its Effect
The system dwell volume (VD), also called the gradient delay volume, of an HPLC instrument is defined as the volume from the mixing point of the mobile-phase solvents to the head of the column. It is important only in gradient HPLC because the composition of the mobile phase in isocratic analysis is constant.
Figure 5 is a schematic of a typical HPLC system with a binary gradient pump that performs low-pressure mixing. The individual system elements that contribute to dwell volume are shown in blue. The volume of the pump includes the inlet check valves, the pump piston chamber, the outlet check valves, and any filters and flow channels that could be within the pump. This volume can be quite substantial--several milliliters--for a low-pressure mixing system. For a high-pressure mixing system (not shown here), the solvents are mixed after the pump, usually in a tee arrangement. Thus, the entire pump volume is bypassed and considerable volume is eliminated. However, mixers and pulse dampers themselves can contribute several hundred microliters to the system dwell volume. Other hydraulic components such as in-line filters, precolumns, and autosampler transfer lines also contribute to overall dwell volume.
Why is the dwell volume important? The gradient is formed at the mixing point of the two solvents, and it must traverse the system dwell volume before it reaches the head of the column. Consider the use of the 30 mm × 2.1 mm low-dispersion column (Vm = 60 µL) at a typical flow rate of 200 µL/min for a narrow-bore column with a dwell volume of 1.0 mL, which might be typical of a high-pressure mixing gradient system. The time it will take for the gradient to reach the head of the column from the point of formation will be 1000 µL ÷ 200 µL/min or 5 min. When using short columns, chromatographers usually are interested in achieving a separation time of 1-2 min. It would be quite difficult to achieve this separation time if the gradient itself doesn’t reach the column for 5 min.
Knowing the system dwell volume is equally important when you want to transfer a method from one liquid chromatograph to another. If the gradient method is specified for the initial instrument, the system dwell volume must match the new instrument exactly for the same separation to be achieved. Otherwise, the gradient mixture will arrive at the column head at a different time, and the solvent composition will be entirely different as a function of time. When transferring a method to the same make and model of instrument, the dwell volumes should match unless one of the instruments has been modified. Even something as simple as changing to different inner diameter connecting tubing can affect the gradient separation. When transferring a method to a different make and model of instrument, expect to do a great deal of work to get the method to be reproducible. Modern instruments, however, sometimes have capabilities to modify the injection parameters to correct for the dwell volume (see below).
How to Estimate the Dwell Volume of an HPLC System
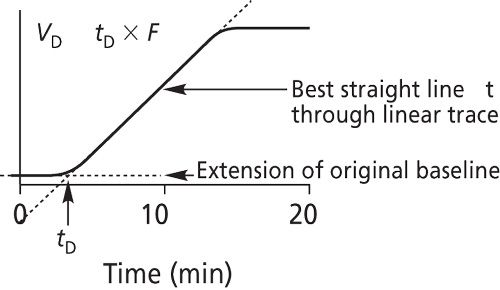
First, replace the HPLC column with a zero-dead-volume union or a short piece of small inner diameter stainless steel or PEEK capillary tubing (0.12-mm i.d.), as you would with the system modification for estimating the extracolumn volume. Place HPLC-grade water in reservoir A (UV-transparent solvent). Prepare a solution of HPLC-grade water that contains 0.2% acetone and place it in reservoir B (UV-absorbing solvent). Set the UV detector wavelength at 265 nm. Adjust the full-scale attenuation so that 100% A and 100% B are on scale. Equilibrate the system with 100% A (pure water) until you achieve a stable baseline. Next, run a gradient profile from 0% to 100% solvent B in 10 min (gradient time [tg]) with a flow rate of 1.0 mL/min. Record the UV trace. Referring to Figure 6, determine the gradient delay time (tD) by extrapolating the straight line to the initial deflection of the UV trace from baseline. VD in milliliters is determined by the product of tD and flow rate (F) in milliliters per minute. The value of tD, and consequently the dwell volume, can be determined computationally from the difference in time required for the baseline to rise to one-half of the 100% absorbance value (t50%) and one-half of the gradient time (0.5tg):

It is desirable to have as small a value of VD as possible so the gradient delay is minimized. In general, it is advisable to reduce the dwell volume to less than 1 mL to allow reproducible gradient elution for low-dispersion columns. To repeat, when developing a gradient method, it is important to specify VD to adequately transfer the method to another HPLC instrument.
System Modifications to Reduce Extracolumn and Dwell Volume
After following the instructions above, you will have determined the critical instrumental volumes that affect low-dispersion column efficiency and gradient delay. Assuming that these volumes are not optimized and your column performance could be affected, what can you do to decrease these volumes? Several hardware changes are required to minimize extracolumn system volume and system dwell volume. Hardware changes might include narrower inner diameter and shorter lengths of connecting capillary tubing throughout the system, as well as a lower-volume detector flow cell and mixer assembly. For isocratic applications, those system elements shown in blue in Figure 1 should be changed to lower-volume versions. Gradient applications also benefit from changes in the solvent mixer and associated pump tubing to minimize the dwell volume.
Table II lists recommended changes to a commercial HPLC system to maximize the performance of low-dispersion columns used with a UV detector. Readers should consult their instrument manufacturers about possible changes to optimize their system.

Although they are not volume elements, two instrument parameters that might be overlooked could improve column performance. One parameter is the detector response time. Because most detectors are preset to work with 4.6-mm columns in which peaks widths typically are tens of seconds wide, the peak widths from small volume peaks eluted from low-dispersion columns run at reasonably high flow rates might be only a few seconds wide. If the response time is not set to measure these rapidly eluted peaks, the response of a detector could lag, and the peaks might be distorted, which would result in artificial band broadening.
The second instrumental parameter that can contribute to peak variance is the data-acquisition rate. At least nine data points are required across a peak for a data system to define peak parameters such as peak apex, inflection points, and peak area. If a peak is eluted quickly and the data acquisition rate is set too slow, then that peak will not be defined precisely and the data system will assign erroneous values.
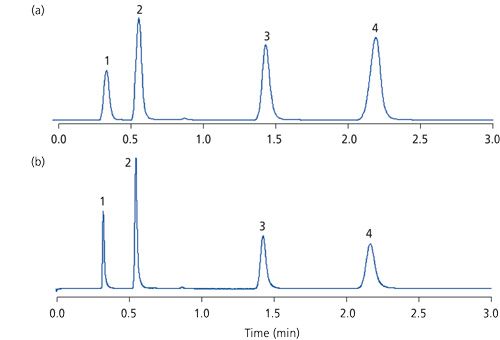
Figure 7 shows chromatograms obtained at two data-acquisition rates using a ChemStation data system (Agilent Technologies). The rapid separation was achieved on a 30 mm × 4.6 mm, 1.8-µm dp low-dispersion reversed-phase column with early peaks eluted with peak widths less than 5-s wide. The upper chromatogram had a rather slow data-acquisition rate, and the lower chromatogram had a faster data rate. Clearly, the loss of peak efficiency in the upper chromatogram is evident, even for the more strongly retained compounds (peaks 3 and 4).
Some experimental parameters can be adjusted to overcome some effects of band broadening. To minimize extracolumn effects caused by injection contributions, for example, using an injection solvent that is weaker than the mobile phase can focus analytes at the head of the column thereby negating the effects of sample volume itself and possible band broadening in the connecting tube and the inlet endfitting. Another technique would be to reduce the volume of sample injected to minimize band spreading caused by an injection solvent composition that is stronger than the mobile phase. A good guideline is to inject a volume of less than 15% of the volume of the initial peak. Another approach would be to increase the retention time for the first eluted peaks because they are the ones most affected by extracolumn broadening effects.
Analysts can compensate for the effect of dwell volume by programming a delayed injection into the method to allow the gradient to reach the head of the column as the sample is being injected. In addition, the flow rate can be changed to compensate for the isocratic hold period that results from dwell volume delays. Changing the flow rate in a gradient separation will change average retention, so it can alter selectivity. This possible change can be corrected for by adjusting the mobile phase conditions using the Match Method software recently developed by Dolan and co-workers (1).
Conclusion
In general, chromatographers can take advantage of the features of low-dispersion columns by understanding the instrumental parameters that affect overall band broadening contributions. Parameters such as extracolumn effects and dwell time can have immense contributions to band dispersion. Making system modifications to decrease these volumes will permit optimum use of
- short, analytical 4.6-mm i.d. columns packed with particles as small as 1.8 μm;
- 1.0–2.1 mm i.d. columns as short as 15 mm; and
- narrow-bore columns as small as 1-mm i.d. with conventional lengths of 150 mm or so.
The recent introduction of 3.0-mm i.d. columns allows users to take advantage of lower solvent use, shorter analysis times, MS interfacing, and consistent resolution without modifying their existing instruments. In this article, I have not considered capillary columns, with inner diameters smaller than 1 mm, nor nano-bore columns, with inner diameters as small as 0.075 mm, because these columns generally require an entirely new instrument with gradient pumps capable of operating at flow rates as low as 300 nL/min, at high pressures, extremely low system extracolumn and dwell volume, and special injectors and detectors such as nanospray mass spectrometers.
Acknowledgments
I have borrowed some of the figures from Agilent Technologies’ seminar materials, and I would like to collectively thank my colleagues who have generated the data throughout the years. I also would like to acknowledge the help of Tom Jupille of the LC Resources Training Group of Rheodyne LLC (Walnut Creek, California) and John Dolan from BASi Northwest Laboratory (McMinnville, Oregon) for reviewing the manuscript and making helpful suggestions.
Reference
(1) J.W. Dolan, L.R. Snyder, T.H. Jupille, and N.S. Wilson, J. Chromatogr. A 960,51–67 (2002).
How to cite this article
R.E. Majors, LCGC North Am.21(12), 1124–1133 (2003).

Polysorbate Quantification and Degradation Analysis via LC and Charged Aerosol Detection
April 9th 2025Scientists from ThermoFisher Scientific published a review article in the Journal of Chromatography A that provided an overview of HPLC analysis using charged aerosol detection can help with polysorbate quantification.
Removing Double-Stranded RNA Impurities Using Chromatography
April 8th 2025Researchers from Agency for Science, Technology and Research in Singapore recently published a review article exploring how chromatography can be used to remove double-stranded RNA impurities during mRNA therapeutics production.


