Analysis of Proteins, Biologics, and Nanoparticles in Biological Fluids Using Asymmetrical Flow Field-Flow Fractionation
With the increasing interest in biopharmaceuticals such as proteins, antibodies, and nucleic acids, there is a corresponding increase in the need for characterizing such components. Much effort is spent on characterization in the early drug development phases as well as during formulation development and quality control. One parameter that is commonly investigated is the size distribution of the macromolecular components to deduce if there is aggregation or degradation occurring, if conformational changes occur, or if there are interactions with excipients. While the properties of the protein drug in the buffer system or in the pharmaceutical formulation are important, possibly even more interesting are the properties of the drug once it enters the body. Size characterization of macromolecules in biological fluids has traditionally been an area hampered by the complexity of the matrix. The large amount of indigenous components can interfere with commonly applied analytical techniques for size characterization. However, the separation technique asymmetrical flow field-flow fractionation (AF4) has recently shown increasing applicability for the characterization of components in blood plasma and serum. This article reviews some aspects of applying AF4 to plasma, serum, milk, and cerebrospinal fluid in the field of analysis and characterization of proteins, biologics, and nanoparticles in biological fluids.
Biopharmaceuticals such as proteins, antibodies, peptides, and nucleic acids are increasingly being used in practically all branches of medicine. The market for these and other biologics has been developing at a faster rate than the market for all drugs and it will continue to grow (1). Yet, the complexity of these structures poses a significant challenge for biopharmaceutical developers and often requires an in-depth characterization to gain understanding and to ensure safety and efficacy (2). A major concern with pharmaceutical proteins is their propensity to form aggregates. These aggregates can exist as small oligomers up to large sub-visible or even visible precipitates, and are of concern because they can reduce drug efficacy and give rise to adverse toxicological and immunological responses (3,4).
While characterizing biopharmaceuticals in formulation is certainly important, it is also of interest to perform the characterization of the drug product after its administration (5). This implies the analysis of blood samples after drug administration. However, blood samples are difficult to analyze due to the complex nature of their components and their wide size range, which requires extensive sample preparation prior to analysis. Similar to blood plasma, the analysis of proteins in biological fluids such as cerebrospinal fluid (CSF) and amniotic fluid is challenging, and until recently only possible to achieve either in vivo or ex vivo.
The most common method for determining the size and amount of proteins and sub-visible aggregates is size-exclusion chromatography (SEC) in combination with suitable detectors. However, some complications with SEC are that it has high surface area and shear forces, which may be a problem for analysis of large-sized aggregates with the potential to adsorb to surfaces. To achieve high recovery and proper elution of analytes in SEC, the separation often uses a mobile phase that does not agree with physiological conditions with respect to ionic strength, pH, and composition. It is therefore recommended to verify SEC data with complementary orthogonal methods because SEC can give erroneous estimates of the aggregate levels (6,7,8). Analytical SEC is rarely reported to be used for the analysis of biological fluids (without extraction protocols to remove matrix components). This is presumably because samples such as blood plasma could clog the column or rapidly deteriorate its performance due to adsorption of matrix components to the column.
Asymmetrical flow field-flow fractionation (AF4), an orthogonal technique to SEC, has been used to characterize biomacromolecules and pharmaceutical molecules (9,10,11), and it has been proven to be a powerful tool to characterize proteins, antigens, and antibodies (12,13). One critical step when applying AF4 is to choose the proper detection technique and factors such as selectivity and sensitivity should be considered. The combination of AF4 with fluorescence (FL), enzyme‑linked immunosorbent assay (ELISA), surface plasmon resonance (SPR), or mass spectrometry (MS) offers the possibility of obtaining information about the size distribution of the biopharmaceutical in blood, the aggregation potential after administration, the interaction of the protein with different matrix components, and potentially applying the methodology to the study of other biological fluids.
Discussion
Several methodologies exist that have the ability to selectively detect and quantify the amount of a component in a biological fluid. Commonly used techniques are ELISA, SPR, and MS. A limitation of all these techniques is that it is difficult or not possible to determine if the analyte response originates from the analyte in monomeric form or if it is from an aggregated (or conjugated) species. In some cases, there is a significant loss of signal when the analyte is present in a biological matrix. It may then be suspected that the analyte is aggregated or associated with matrix components, thereby giving a loss of signal. While such information may give valuable indications, it is often inconclusive and still does not give any information on the size of the aggregates. Furthermore, quantification is often difficult or not possible.
If the sample in the biological matrix could be size-separated and then detected it would enable more detailed information on the analyte size distribution, potentially offering answers to if the analyte is aggregated or associated with matrix components, and to what extent. An alternative methodology is AF4. In contrast to SEC, a sample passing an AF4 channel is subjected to significantly lower shear forces and exposed to much smaller surface areas. Also, clogging of the channel is no longer an issue, and AF4 generally works very well with mobile phases of physiological ionic strength and pH.
Different Sample Matrices
As reported elsewhere, AF4 can be applied to a variety of different biological fluids (14,15,16,17,18). Blood serum and plasma are perhaps the most obvious and interesting from a pharmaceutical point-of-view, but the methodology is equally applicable to other interesting biological matrices such as CSF and amniotic fluid (Figure 1).
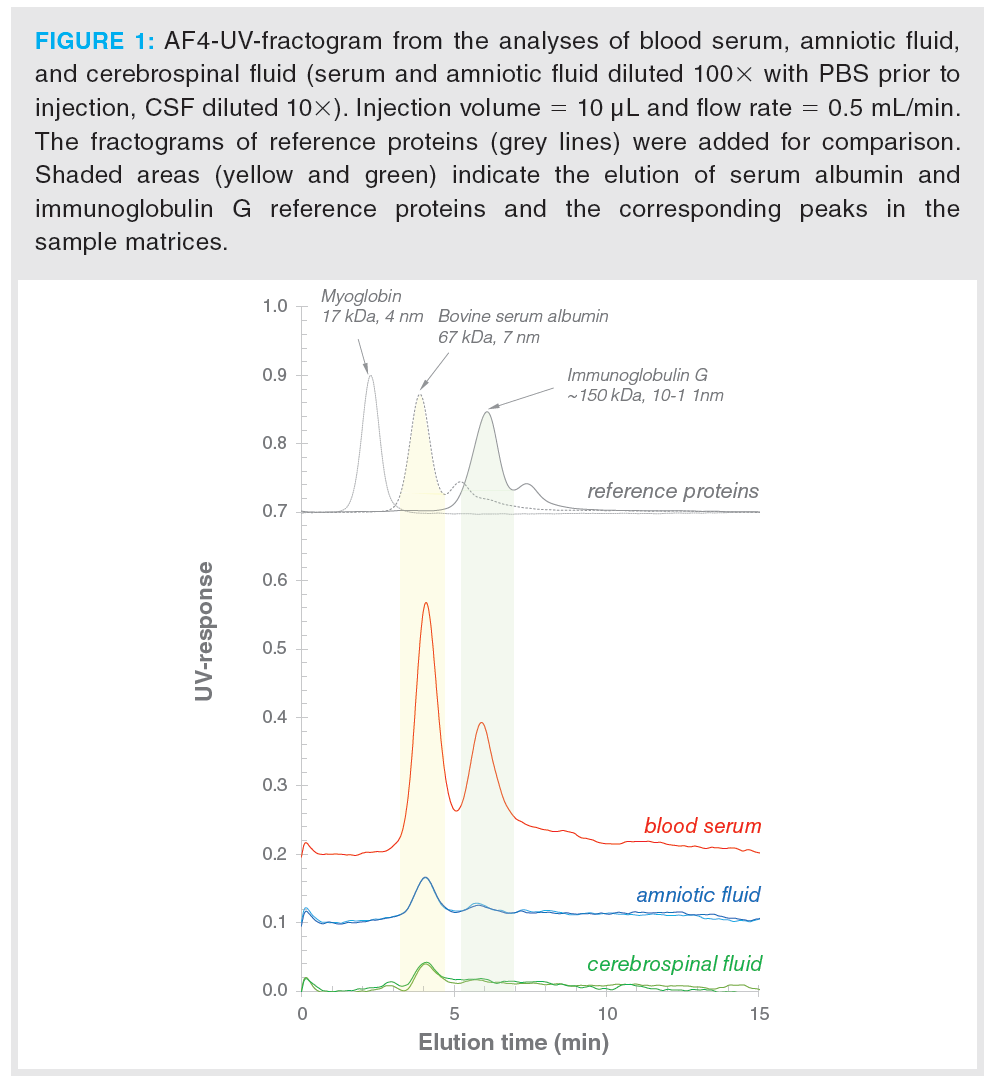
In AF4 (Brownian mode), the sample components are eluted in order of increasing size. The eluted fractions can be collected and measured offline, or monitored online by an UV detector, as in the Figure 1 example.
As can be seen in Figure 1, the different fluids share some characteristics: the most intense peak (at ~4 min) corresponds well with the elution time of serum albumin reference (67 kDa), which should be the most abundant component, with the second most intense peak being dominated by IgG (150 kDa). A significant difference between the different matrices lies in the total amount of proteins, so that, for example, the lower protein content CSF gives considerably lower signals than the serum.
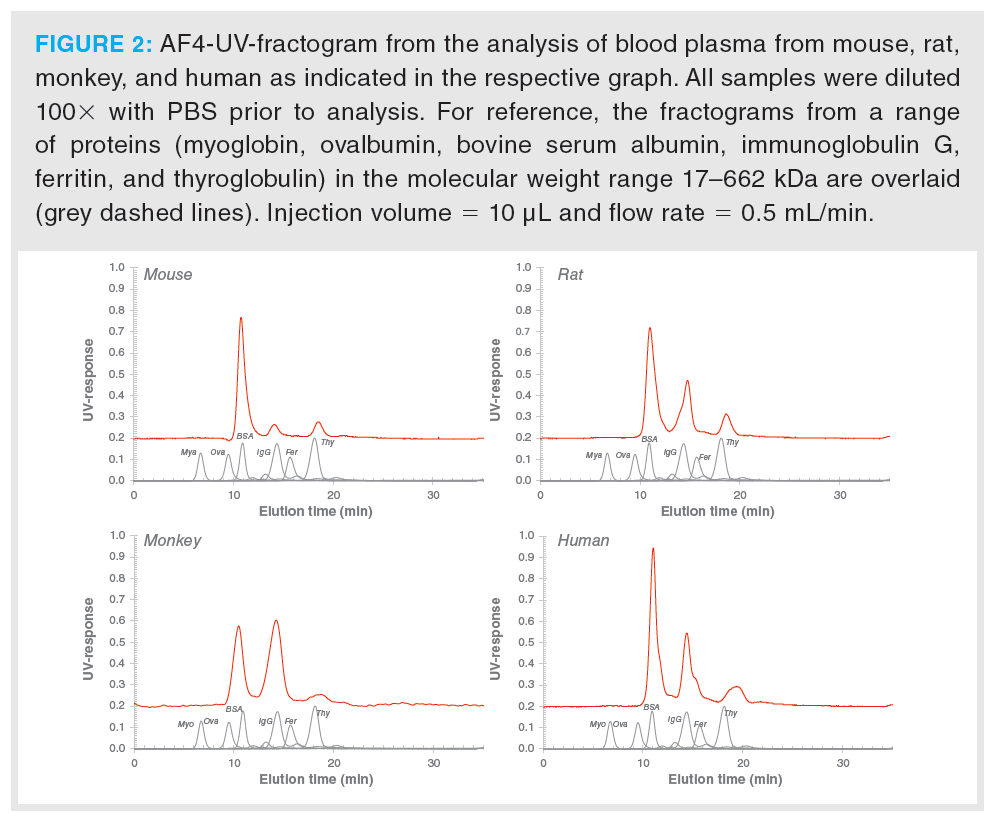
It is equally possible to apply the same methodology to serum and plasma from different animals (Figure 2), which can be helpful when investigating if a component behaves differently in different animal types. In the example (Figure 2), the different plasma samples all contained an active pharmaceutical ingredient (API). Fractions were collected after the AF4 size separation and analyzed by ELISA for quantification of the API. As can be noted from the four plasma fractograms in Figure 2, the general profile is similar irrespective of the source, with the difference being that protein levels, and especially antibody levels, show some variability. The different antibody levels may be related to pattern-variations of age, health, and infection history between individuals.
Biological samples and matrices can also contain very large colloidal structures such as lipoproteins, vesicles, and viruses. One example of a biological fluid with an abundance of large colloidal structures is milk (Figure 3). Due to the large size range over which AF4 is applicable, it can also be applied for the analysis and characterization of casein micelles present in milk (19,20,21).
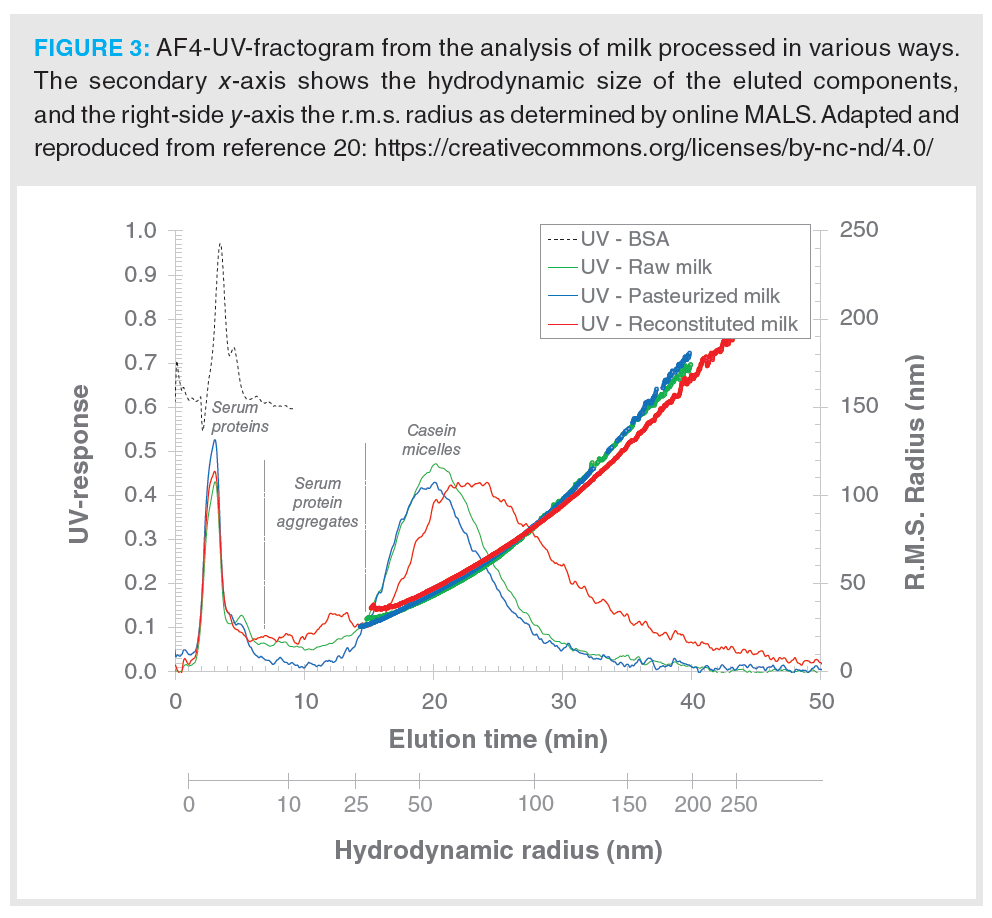
In Figure 3, AF4 was used to investigate the impact of pasteurization of milk and reconstitution of milk powder on the size and structure of casein micelles. The most abundant component of the milk samples was confirmed to be casein micelles (elution 16–45 min, radius size range of 30–300 nm), with the difference being that the most abundant size (peak apex) depends on the milk type. In the same analysis, the first population of the fractogram consists mainly of serum (whey) proteins and other relatively small and low molar mass components of the milk (<6 nm in hydrodynamic radius and peak maximum at 2.8 min). The second population (between 6–15 min)—of which there is substantially less in the raw and pasteurized milk samples—consists partially of serum protein aggregates.
Separation Considerations
As has been shown, it is possible to size-fractionate biological fluids containing a wide variety of components, with sizes ranging from small proteins up to ~0.5 µm colloidal structures. However, some aspects of the sample and the aim of the study must be considered before starting the experiments. One must primarily consider the size range of interest—is it peptides and small proteins, or large colloids? (AF4 can, in Brownian mode, cover from ~2 nm to approximately 1000 nm hydrodynamic diameter.) Depending on the size range to be investigated, different separation conditions should be used for optimal resolution. One should also consider the sample load as many biological fluids
have a very high protein content. For example, blood serum and plasma are often in the 50–100 mg/mL protein range. To avoid overloading the AF4 channel (otherwise detrimental effects on resolution can be experienced), only small volumes of sample need to be injected or the sample needs to be diluted prior to analysis. Another consideration is that in many cases it is preferable to investigate the sample under conditions as close as possible to physiological conditions. Thus, it is suitable to use a carrier liquid that has a physiological pH and ionic strength. Some biologically active components, for example, enzymes or milk as in the earlier example, may require certain ions (Ca2+ or Mg2+) to maintain their structure or function. Such considerations may impact the choice of buffers used for both dilutions and as the carrier liquid.
Detection Considerations
Biological fluids are complex and contain millions to trillions of different components. While AF4 is able to separate a wide range of macromolecular and colloidal components, the resolution is not sufficient to resolve all of them. Thus, one of the critical steps when applying the methodology is to choose the detection technique. Due to the complexity of the sample matrix and the often low concentration of the analyte, two factors are particularly important: selectivity and sensitivity. As the analyte will be coeluting with other substances, selectivity is necessary for accurate concentration determinations. As the analyte is often present at low concentrations in body fluids, and the sample becomes further diluted during the AF4 separation, there is also demand on the detection sensitivity. The most straightforward selective detection technique is via fluorescently labelling the component of interest. This approach has the added benefit of being easily performed online. An example is presented in Figure 4: a fluorescently labelled antibody is present in CSF, making it straightforward to monitor by AF4 equipped with an online fluorescence detector.
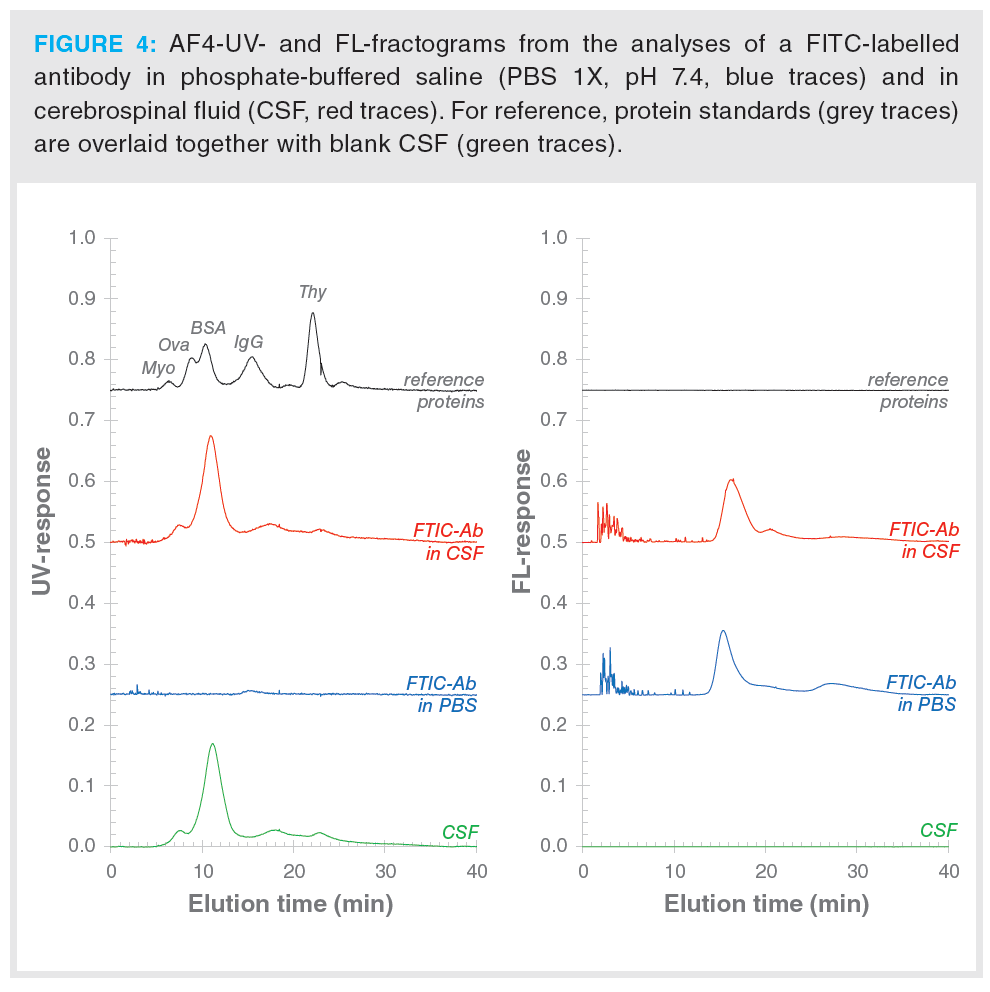
A potential drawback with FL‑labelling is that the introduction of the chemical groups with fluorescence activity might affect how the component interacts with matrix components. From that perspective it would therefore be better to use a detection technique that is able to selectively measure an unlabelled component. Examples are immunoassays such as ELISA or SPR (Figure 5) (15). Besides the obvious benefit of not needing to go through a labelling procedure, any concerns that the methodology incurs changes in the physicochemical properties of the analyte are eliminated. However, immunoassays are not without caveats either. First, there must be an antibody against the target analyte. For late-stage pharmaceutical candidates this may be the case, but in the early stage it is not always available.
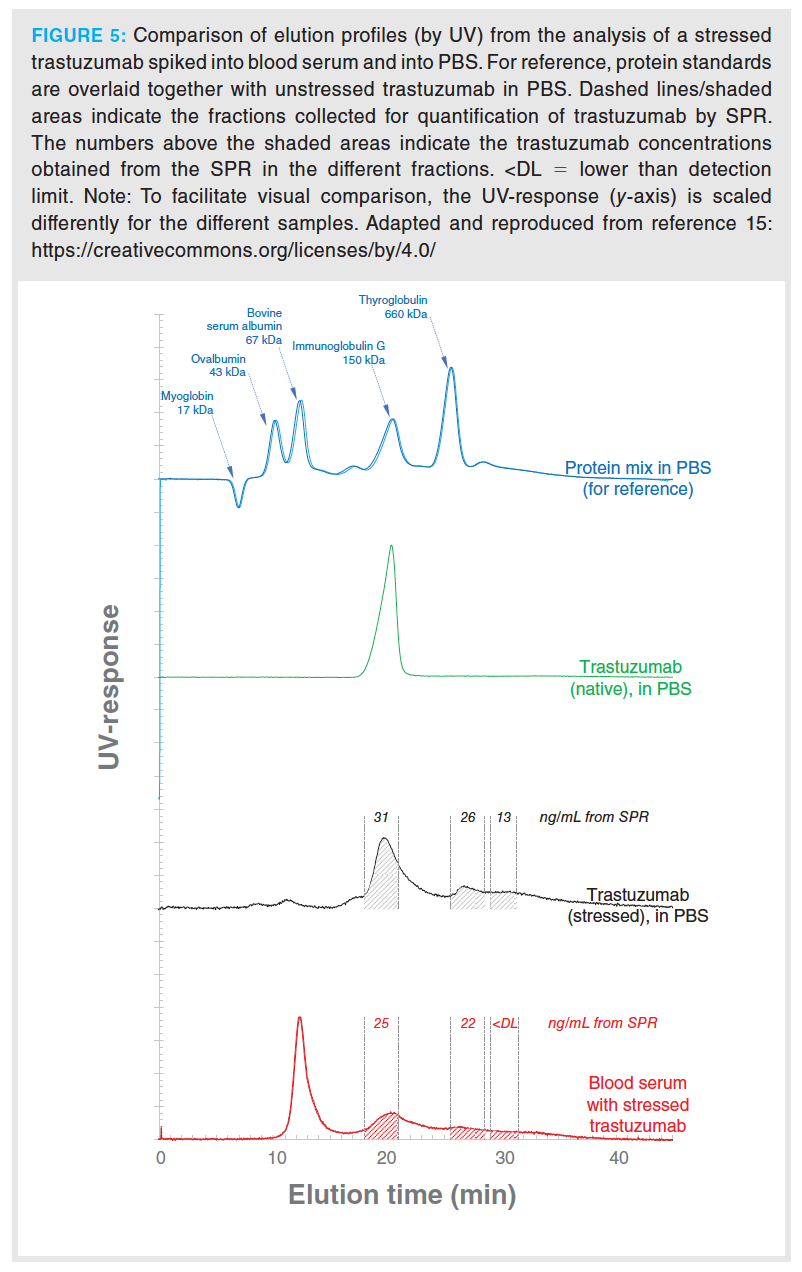
Another more fundamental consideration that should be taken into account is the detectability of the analyte if present in an aggregated state or associated with matrix components. It is not guaranteed that an immunoassay technique (such as ELISA or SPR) has the ability to give a response for an oligomer or aggregate (at least it is not certain that the detection will have the same sensitivity or response factor for an aggregate). In the example of SPR on a stressed trastuzumab, the large aggregates were detected when the stressed trastuzumab was in a buffer system. However, when the stressed trastuzumab was in a blood serum matrix, the largest aggregates were not detected (15). This may be caused by matrix components associating with the large aggregates, making them less accessible to the SPR-sensor surface.
Limitations
During the separation, the sample is diluted, and the run-time of the complete process (from injection to detection or fraction collection) is at least several minutes up to an hour. For example, if a protein aggregate dissociates upon dilution and does so within seconds or minutes, such protein aggregates would not be detected or accurately quantified by the methodology. In summary, for a system where the analyte aggregates or associates rapidly and is dependent on concentration, results may be inaccurate.
AF4 fractionates by hydrodynamic size. Thus, if there are changes in an analyte that occur but that do not significantly change the hydrodynamic size of the analyte, they will not be noticed by any shift in elution time. An example would be the association of a peptide internally within a large protein structure may go undetected (although FL-labelling of the peptide or MS against the peptide would be able to detect this).
Summary
There is a renewed interest in AF4 as it may be helpful with regards to analyzing complex biological fluids. The methodology becomes especially interesting when combined with selective detection techniques, such as FL, ELISA, SPR or MS, as the combination then offers the potential to provide information on analyte behaviour in biological systems that is difficult to obtain by any other technique.
References
- M. Kesik-Brodacka, Biotechnology and applied biochemistry 65(3), 306–322 (2018).
- S. Berkowitz, J. Engen, J. Mazzeo, et al., Nat. Rev. Drug Discov. 11, 527–540 (2012).
- S. Frokjaer and D.E. Otzen, Nature Reviews Drug Discovery 4(4), 298–306 (2005).
- J. den Engelsman, P. Garidel, R. Smulders, et al., Pharm. Res. 28, 920–933 (2011).
- W. Wang, S.K. Singh, N. Li, M.R. Toler, K.R. King, and S. Nema, International journal of pharmaceutics 431(1–2), 1–11 (2012).
- R.R. Manning, R.E. Holcomb, G.A. Wilson, et al., Biopharm International 27(12), 32–39 (2014).
- J.F. Carpenter, T.W. Randolph, W. Jiskoot, et al., Journal of Pharmaceutical Sciences 99(5), 2200–2208 (2010).
- US Food and Drug Administration, Guidance for Industry Immunogenicity Assessment for Therapeutic Protein Products (FDA, Rockville, Maryland, USA, 2014), pp. 1–36.
- R.N. Qureshi and W.T. Kok, Analytical and Bioanalytical Chemistry 399(4), 1401–1411 (2011).
- D.C. Rambaldi, P. Reschiglian, and A. Zattoni, Analytical and Bioanalytical Chemistry 399(4), 1439–1447 (2011).
- L. Nilsson, Food Hydrocolloids 30(1), 1–11 (2013).
- C. Cragnell, J. Choi, M. Segad, et al., Food Hydrocolloids 70, 65–68 (2017).
- K. Shin, J. Choi, J.H. Cho, et al., Journal of Chromatography A 1422, 239–246 (2015).
- M. Leeman, J. Choi, S. Hansson, et al., Anal. Bioanal. Chem. 410, 4867–4873 (2018).
- M. Leeman, W.M. Albers, R. Bombera, et al., Anal. Bioanal. Chem. 413, 117–127 (2021).
- P. Li and J.C. Giddings, J. PharmSci. 85(8), 895–898 (1996).
- M. Madörin, P. Van Hoogevest, R. Hilfiker, et al., Pharm Res. 14(12), 1706–12 (1997).
- I. Park, K.J. Paeng, Y. Yoon, et al., J. Chromatogr. B Anal. Technol. Biomed. Life Sci. 780(2), 415–22 (2002).
- M. Glantz, A. Håkansson, H.L. Månsson, et al., Langmuir 26, 12585–12591 (2010).
- A. Lie-Piang, M. Leeman, A. Castro, et al., Food Research Int. 139, 109939 (2021).
- A. Lie-Piang, M. Leeman, A. Castro, et al., Curr. Res. Food Science 4, 83–92 (2021).
Mats Leeman is a senior scientist at Solve Research and Consultancy in Lund, Sweden, where he works with size characterization of proteins, polymers, and nanoparticles. Mats holds a Ph.D. in technical analytical chemistry from Lund University. He has been using AF4 for more than 15 years for various applications within the pharmaceutical, specialty chemicals, and biotech industries.
Alejandra Castro Nilsson is a senior scientist and CEO at Solve Research and Consultancy in Lund, where she works with the characterization of biopolymers, proteins, and nanoparticles. Alejandra holds a Ph.D. in food engineering from Lund University. She has worked with AF4, light scattering, laser diffraction, and chromatographic techniques for more than 10 years for various applications, including polysaccharides, proteins, nanoparticles, and biopolymers.
Lars Nilsson is Professor of Formulation Technology at Lund University. His research focus is on applied colloid chemistry and formulation technology as well as development and application of AF4 methodology for the separation and characterization of biomacromolecules and nanoparticles within the life sciences. His AF4 work currently focuses on the analysis and characterization of therapeutic proteins and peptides in relation to formulation aspects and biological fluids.

In the present study, a gradient reversed-phase high-performance liquid chromatography (RP-HPLC) method has been designed and validated to quantify ornidazole (OZ) in the marketed formulation (oral gel) with the application of QbD.
A column with chemically modified column hardware showed improvements in analytical performance for siRNA compared to a conventional stainless-steel column.

