Advances in GC–MS for Food Analysis
Special Issues
An overview of important GC–MS techniques currently used in food analysis is described. Considerable attention is devoted to the use of the mass spectrometer, in relation to its poptential for separation and identification. The importance of comprehensive GC?GC is also discussed.
An overview of important gas chromatography–mass spectrometry (GC–MS) techniques currently used in food analysis is described. Considerable attention is devoted to the use of the mass spectrometer, in relation to its potential for separation and identification. The importance of comprehensive two-dimensional GC (GC×GC) is also discussed.
Food products are usually of a highly complex nature and are composed of organic material (fats, sugars, proteins and vitamins) and inorganic material, (water and minerals). Apart from natural constituents, foods can contain xenobiotic compounds deriving from a variety of sources, including the environment, packaging, agrochemical treatments, etc. Many xenobiotic compounds can have a profound negative effect on human health — even at trace concentration levels.
A gas chromatography mass spectometry (GC–MS) analysis of a food can vary in scope. For example, a GC–MS method can be used for the qualitative/quantitative analysis of untargeted volatiles (for example, elucidation of an aroma profile) or targeted ones (such as pesticides). Furthermore, a GC–MS method can also be exploited for the generation of a chromatography profile (fingerprinting), with the aim of distinguishing between food samples of the same type (for example, to determine geographical origin). In such studies, the exploitation of statistical methods is almost obligatory. However, for almost any purpose, a GC–MS technique must be both sensitive and selective, as well as possessing a decent separation power and speed. The extent to which one or more of the aforementioned features prevails is dependent on the initial analytical objective.
Current one-dimensional GC approaches are generally based on the use of a 30 m × 0.25 mm × 0.25 µm column, which generates peak capacities in the 400–600 range, and are the most commonly exploited tools for the separation of food volatiles. One can expect to fully-resolve around 80–100 analytes, using such a capillary column (compound more, compound less). However, because food samples are generally of moderate-to-high complexity, then the occurrence of solute co-elution at the column outlet is common, leading to difficulties or possible errors in the identification and quantification of specific components.
In the GC–MS field, most analysts are located in one of two groups. On the one hand, there are the many separation scientists who are mainly GC specialists and devote their time almost entirely to the optimization of the separation step, and tend to treat the MS instrument as a simple detector. Such an approach is fine if the ion source receives totallyisolated solutes, identified commonly by using dedicated MS databases. Problems arise when peak overlapping occurs, hence demanding a deeper exploitation of the MS step (for example, by using peak deconvolution methodologies, extracted ions or knowledge of MS fragmentation processes). On the other hand, several MS specialists pay little attention to the GC process, and prefer to circumvent a poor GC separation by exploiting a mass-analysing second dimension: multi-compound bands are transformed into a bunch of ions that are resolved and detected on a mass basis. It is obvious, however, that in the case of extensive co-elution, the reliability of the qualitative/quantitative results can be hampered. In truth, both analytical dimensions are complementary, and should be pushed to their full capacities.
One-Dimensional GC-Based Processes
In this section, a series of recent GC–MS food applications will be described, in which different types of MS systems have been used. Emphasis will be directed to the potential of the MS analytical step, which is often exploited to a greater extent in the presence of a single GC dimension. Cajka et al. used a high resolution time-of-flight mass spectrometer (HR ToF MS), connected to a 10 m × 0.53 mm × 0.5 µm "5% phenyl" column for the target analysis of 111 pesticides in baby foods (1). The short mega-bore column was used to exploit the low pressure (LP) conditions created by the mass spectrometer, increasing the optimum gas linear velocity.
A QuEChERS (quick, easy, cheap, effective, rugged and safe) method was used for sample preparation, while a programmed temperature vaporizor (PTV) was employed as injection system. The GC step was a fast (10.75 min total run time) and low resolution one, hence higher demands were put on the high resolution MS process. The HR ToF MS instrument used, operated under electron-ionization (EI) conditions, was reported to have a mass resolution of approximately 7,000 and was operated at an acquisition frequency of 4 Hz, which was considered sufficient for quantification purposes. With only a few exceptions, the limits of quantification were ≤ 0.01 mg/Kg. Pesticide identification was performed exploiting mass spectral deconvolution, while quantification was performed by using extracted ions with a 0.02 Da mass window. A disadvantage of the proposed approach appeared in the low resolving power of the capillary column (circa 20,000 N); as can be observed in Figure 1(a), which reports extracted-ion chromatogram segments relative to the separations of (m/z = 180.938) HCH (hexachlorocyclohexane), (m/z = 235.008) DDD (dichlorodiphenyldichloroethane)/DDT (dichlorodiphenyltrichloroethane) and (m/z = 323.024) difenoconazole isomers, a series of co-elutions do occur. The use of a conventional GC column (circa 120,000 N), with the sacrifice of speed, is probably a better,if slower, option [Figure 1(b)].

Figure 1
Triple quadrupole MS instrumentation (MS–MS analysis) can provide greater selectivity and sensitivity than "fullscan" systems, with the requisite of prior knowledge on "what you're looking for". An MS–MS analysis is comparable to a selectedionmonitoring (SIM) one, performed by using a single quadrupole MS system, but with higher selectivity. Koesukwiwat et al. performed an LP-GC–MS-MS analysis, using a "5% phenyl" mega-bore capillary (10 m × 0.53 mm × 1 µm), on 150 relevant pesticides in four vegetable foods (2). The GC retention time window ranged from 2.9 min to 6.2 min, and thus the occurrence of compound overlapping, at the lowresolution column outlet, was inevitable. Again, high demands were put on the MS process. Twenty-six multiple reaction monitoring (MRM) segments (60 transitions for each segment) were set across a brief time space (2.6–6.7 min) to cover all the target analytes. Two ion transitions were monitored for each of the 150 pesticides, with the most intense ion exploited for quantification purposes and the other for qualitative ones. The choice of the precursor ion, a process which required a substantial amount of preliminary work, privileged higher mass ions. The triple quadrupole MS system was operated at a cycle time of about 208 msec (4.8 Hz), and a dwell time of 2.5 msec was used for each transition. The sensitivity of the method was generally sufficient for the requirement of food pesticide analysis, with LCL (lowest calibration level) values down to the 5 ppb level.
A fast GC–MS method was developed by Scandinaro et al. for the construction of a novel MS database, named EI-MS F&F (electronimpact-MS flavour & fragrance) (3). The authors reported the use of a micro-bore apolar GC column (10 m × 0.10 mm × 0.10 µm), and a rapid-scanning quadrupole mass spectrometer (qMS). The qMS system employed was characterized by a scan speed of 10,000 amu/s, and a 25 Hz data acquisition frequency under a normal mass range (for example, m/z = 40–360). Such instrumental characteristics are sufficient for the requirements of qualitative/quantitative fast GC analysis. Single quadrupole MS instruments are the most commonly used in the GC field, combining a relatively low cost with robustness and reduced dimensions. Furthermore, MS databases are normally constructed using qMS spectra and, thus, peak assignment, through database matching, is quite reliable. To reach sufficient degrees of sensitivity, extracted-ion chromatograms must be used or, even better (in sensitivity terms), the SIM mode. It is clear that, in the latter case, full-scan spectral information is lost. A disadvantage of qMS instrumentation can be mass spectral skewing, an effect which can be observed particularly in fast GC–MS analysis. Skewing is related to the change of analyte concentration in the ion source during a scan, causing the generation of inconsistent spectral profiles across a peak.
During the experiment performed by Scandinaro et al., the authors subjected 200 essential oils to fast GC-qMS analysis. After, a single spectrum was derived from each chromatogram by averaging the spectra relative to all peaks in the chromatogram (apart from the solvent) and was added to the database. In principle, each spectrum attained can be considered in the same manner as a direct MS injection. The EI-MS F&F database was found to be an effective tool to give a reliable name to an unknown essential oil. After, the GC–MS chromatogram can be used for compound-to-compound identification.
Mass spectrometric systems can be considered, in their own right, as a second separative dimension. However, such an analytical characteristic is often masked when using the most common ionization mode, namely EI. In fact, when using such an ionization procedure, a great number of fragments are generated in the ion source for each compound, thus creating complex spectral profiles. On the other hand, if a soft ionization method is used [for example, chemical ionization (CI), field ionization (FI) or photoionization (PI)], generating a low degree of fragmentation, then the separation potential of the mass analyser is exalted.
Hejazi et al. analysed fatty acid methyl ester (FAME) mixtures by using a highly polar cyanopropyl 60 m × 0.25 mm × 0.25 µm column, with the latter entering the ion source of an HR-ToF MS instrument (4). Instead of using EI, the authors applied FI, a soft ionization method with very little or no fragmentation (the TIC is essentially a molecular-ion chromatogram). In the first dimension, FAMEs were separated on the basis of increasing polarity, while in the second MS dimension separation was dominated by molecular weight.
The GC-FI ToF MS data was represented on a 2D plane, with m/z values located along an x-axis and elution times along a y-axis. The GC elution times were manipulated so that the saturated FAMEs were shifted onto a horizontal line; relative retention times, with respect to the saturated FAME line, were then derived for the other FAMEs. The 2D plane derived from the analysis of fish oil is illustrated in Figure 2. As can be seen, analyte distribution is highly organized: FAMEs with the same C number are located in specific zones, while the same can be affirmed for analytes with the same number of double bonds. A great amount of information was obtained through the GC-FI ToF MS experiment (exact masses + 2D plane locations); however, the GC-FI ToF MS data was not sufficient to distinguish positional isomers (that is, C18:3ω3 and C18:3ω6). The method proposed by the authors was abbreviated as GC×FI MS, to emphasize the similarity with comprehensive two-dimensional gas chromatography (GC×GC). However, GC×GC would appear to be a more powerful method for the identification of FAMEs as a result of the formation of highly organized chemical-class patterns (5).
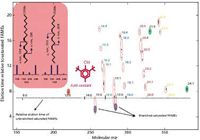
Figure 2
Isotope discrimination during plant biosynthesis can be exploited to evaluate geographic origin and adulteration of natural plant-derived foods. For such aims, isotope ratio mass spectrometry (IRMS), combined with gas chromatography, is a useful analytical tool (6). IRMS enables the measurement of deviations of isotope abundance ratios, from an agreed standard, by only a few parts per thousand for C, as well as for other atoms such as H, N, O and S. A requirement for IRMS analysis is that each element must be converted into a gas before entrance to the ion source. In particular, the determination of the 13 C/12 C ratio is now rather established, and is obtained by converting the C atoms of a specific analyte into CO2 and then by comparing the C isotope ratio of that constituent to that of a known standard. A dimensionless quantity (δ) is used to express the isotope ratio value of a specific solute, in relation to the standard and is expressed in ‰ (7).
Schipilliti et al. used solid-phase microextraction (SPME) to extract volatiles from the headspace of (organic) strawberries (as well as from other fruits such as pineapple and peach) [8]. The extracted compounds were then subjected to GC analysis, on an apolar 30 m × 0.25 mm × 0.25 µm capillary. IRMS analysis was carried out for twelve characteristic strawberry aroma constituents and an authenticity range was constructed (Figure 3). Moreover, SPME-GC-IRMS applications were carried out on non-organic strawberries and on strawberryflavoured foods (yogurt, sweets and ice lollies). As can be seen from the graph presented in Figure 3, the 13 C/12 C δ values for non-organic strawberries were within the authenticity range, while the δ values relative to the other food commodities indicated that "real" strawberry extracts had not been employed for flavouring.
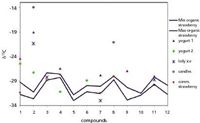
Figure 3
In general, GC-IRMS is a very useful technique for unveiling adulterations in food analysis. However, it should be added that the series of connections from the GC column outlet (for example, the combustion chamber) to the ion source can cause substantial band broadening and, ultimately, resolution losses. Consequently, whenever the complexity of a food sample exceeds a certain level, the use of a heart-cutting multidimensional GC–IRMS system is advisable.
One way to circumvent the insufficient resolution/selectivity observed in one-dimensional GC is to analyse the same sample on two columns with a different selectivity. Such an approach was exploited by Sasamoto et al. to analyse selected pesticides in a brewed green tea (9). The authors achieved a rapid twincolumn GC–MS experiment using dual low thermal mass (LTM) modules mounted on a gas chromatograph, equipped with a quadrupole MS and a pulsed flame photometric detector (PFPD). The two columns used were of equivalent dimensions (10 m × 0.18 mm × 0.18 µm), with a different stationary phase (5% phenyl and 50% phenyl), and were attached to a single injector. The column outlets were connected to the detectors via a cross union. Independent applications were performed using differential temperature programmes. Such an approach is rather interesting because two TIC traces, relative to two different capillaries, can be stored as a single GC–MS chromatogram. Figure 4 illustrates the TIC trace relative to a mixture of 82 standard pesticides, separated on each column. Expansions derived from extracted-ion chromatograms [Figure 4(c) and 4(d)] highlight a series of co-elutions, and, ultimately, the insufficient overall GC resolving power.
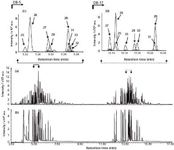
Figure 4
Comprehensive TwoDimensional GC-Based Processes
If a multidimensional GC (MDGC) instrument is used in food analysis, then ideally totally-isolated compounds should be delivered to the mass spectrometer. Although such a positive outcome is not always the case, it is also true that in most MDGC–MS applications, an EI unit-mass resolution MS system [either single quadrupoles or low-resolution (LR) ToF] is generally used. The reason for such a choice is obvious, being related to the highresolution and selective nature of the GC step, hence decreasing the need for a powerful MS process (for example, HR ToF MS or MS–MS).
An MDGC set-up usually consists of two columns connected in series and characterized by a differing selectivity (for example, apolar-polar, polar-chiral, etc.). MDGC methods are classified into two large groups, namely heart-cutting and comprehensive. Approaches belonging to the former class are characterized by the transfer of a limited number of chromatography bands from the first to the second column. In comprehensive two-dimensional GC, the entire initial sample is analysed in both dimensions. GC×GC experiments are normally performed using a conventional primary and a short secondary micro-bore column (1–2 m); the latter receives first-dimension cuts in a continuous and sequential manner.
The GC×GC transfer device, defined as modulator (usually cryogenic), enables the rapid accumulation and re-injection of chromatography bands from the first to the second column. Seconddimension separations are very fast, normally completed within 5–8 s. The time between sequential second-dimension injections is defined as "modulation period", and is equal to the analysis time on the secondary capillary. Each seconddimension analysis is characterized by solutes with the same first-dimension elution time (expressed in min) and different second-dimension retention times [expressed in seconds (s)]. If a 2,000 s GC×GC application with a 5-s modulation period is considered, then 400 5-s second-dimension traces, stacked side-by-side, will form a (monodimensional) comprehensive 2D GC chromatogram (only one detector is used). Dedicated software is necessary to generate a bidimensional GC space: each high-speed chromatogram is positioned at 90° to an x-axis, while the compounds separated in the second dimension are aligned along a y-axis and are characterized by an oval shape. With regards to quantification issues, it is necessary to sum the peak areas relative to the same compound in each high-speed second-dimension trace, again by using dedicated software. For more details on GC×GC the reader is directed to the literature (10).
A common characteristic of all GC×GC separations is that very narrow GC peaks (200–500 msec) are generated. For this reason, high-speed (up to 500 Hz) LR ToF MS systems have dominated the GC×GC market over the past decade. The reason for such a supremacy is mainly related to quantification: at least 8–10 data points/peak are necessary for correct peak reconstruction.
Silva et al. reported an SPME-GC×GC-LR ToF MS investigation, on the headspace of marine salt (11). The ToF mass spectrometer was operated at a 100 Hz spectral acquisition frequency, using a 41–415 m/z mass range. Prior to entrance in the ion source, the analytes were separated on an apolar-polar column combination. The GC×GC-LR ToF MS instrument was equipped with dedicated software for instrumental control and data processing. Automated data processing was used to tentatively identify peaks with a signal-tonoise threshold > 100. The SPME–GC×GC–LR ToF MS result for the most complex (101 identified compounds) salt sample is shown in Figure 5. As can be observed, the bidimensional chromatogram is characterized both by unsuspected complexity and by the formation of chemical-class patterns. The investigation of Silva et al. highlighted a series of positive features of GC×GC, namely, increased separation power, enhanced sensitivity (due to cryogenic modulation) and the generation of structured chromatograms.
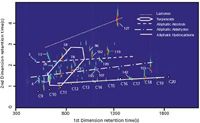
Figure 5
Recently, Purcaro et al. evaluated the performance of a novel rapidscanning (scan speed: 20,000 amu/s) qMS system in the GC×GC analysis of pesticides contained in water (12). The analytes were extracted by using direct solid-phase microextraction and then separated on a "5% diphenyl" 30 m × 0.25 mm × 0.25 µm primary column (SLB-5ms), and on a mediumpolarity ionic liquid 1 m × 0.10 mm × 0.08 µm secondary one (SLBIL59). The MS system was operated using a wide 50–450 m/z mass range (which is necessary for heavier weight components) and a 33 Hz spectral production rate, a frequency which was found sufficient for reliable quantification. The authors reported that the time required to achieve a scan was 19.5 msec, accompanied by an interscan delay of less than 11 msec. Heptachlor, namely the fastest peak generated (base width of circa 300 msec), was reconstructed with ten data points. Spectra derived at different peak points showed good spectral consistency. Under a more common GC mass range (50–340 m/z), the qMS system has been capable of producing 50 spectra/s (13).
Conclusions
A brief overview of some of the current possibilities in the field of gas chromatography–mass spectrometry analysis of foods has been discussed. The number of instrumental options is high and the present contribution can, only in part, direct the food analyst to the most appropriate choice, on the basis of the initial analytical objective.
In the case of target analysis, then a single GC column, combined with an appropriate MS approach (MS–MS, SIM, EIC, deconvolution methods, etc.), can do the job fine. If the entire chemical profile of a low-to-medium complexity food sample needs to be unravelled, then straightforward GC, with unit-mass resolution MS, is a still a good choice. In the case of a highly complex sample, then the need for a powerful GC step is, in many cases, required. Obviously, a method such as GC×GC is suitable for the analyses of unknowns, as well as for target analysis.
Peter Quinto Tranchida1 , Paola Dugo1,2 and Luigi Mondello 1,2 1 Dipartimento Farmaco-chimico, Facoltà di Farmacia, Università degli Studi di Messina, Messina, Italy 2 Centro Integrato di Ricerca (C.I.R.), Campus Bio-Medico, Roma, Italy.
References
(1) T. Cajka, J. Hajslova, O. Lacina, K. Mastovska and S.J. Lehotay, J. Chromatogr. A, 1186(1–2), 281–294 (2008).
(2) U. Koesukwiwat, S.J. Lehotay and N. Leepipatpiboon, J. Chromatogr. A, 1218(39), 7039–7050 (2010).
(3) M. Scandinaro, P.Q. Tranchida, R. Costa, P. Dugo, G. Dugo and L. Mondello, LCGC Europe, 23(9), 456–464 (2010).
(4) L. Hejazi, D. Ebrahimi, M. Guilhaus and D.B. Hibbert, Anal. Chem., 81(4), 1450–1458 (2009).
(5) P.Q. Tranchida, R. Costa, P. Donato, D. Sciarrone, C. Ragonese, P. Dugo, G. Dugo and L. Mondello, J. Sep. Sci., 31(19), 3347–3351 (2008).
(6) A. Mosandl, in: R.G. Berger (Ed.), Flavours and Fragrances – Chemistry, Bioprocessing and Sustainability, Springer, p. 379, (2007).
(7) J.T. Brenna, T.N. Corso, H.J. Tobias and R.J. Caimi, Mass Spectrom. Rev., 16(5), 227–258 (1997).
(8) L. Schipilliti, P. Dugo, I. Bonaccorsi and L. Mondello, J. Chromatogr. A, 1218(42), 7481–7486 (2011).
(9) K. Sasamoto, N. Ochiai and H. Kanda, Talanta, 72(5), 1637–1643 (2007).
(10) M. Adahchour, J. Beens and U.A. Th. Brinkman, J. Chromatogr. A, 1186(1–2), 67–108 (2008).
(11) I. Silva, S.M. Rocha, M.A. Coimbra and P.J. Marriott, J. Chromatogr. A, 1217(34), 5511–5521 (2010).
(12) G. Purcaro, P.Q. Tranchida, L. Conte, A. Obiedzinska, P. Dugo, G. Dugo and L. Mondello, J. Sep. Sci., 34(18), 2411–2417 (2011).
(13) G. Purcaro, P.Q. Tranchida, C. Ragonese, L. Conte, P. Dugo, G. Dugo and L. Mondello, Anal. Chem., 82(20), 8583–8590 (2010).
Analytical Challenges in Measuring Migration from Food Contact Materials
November 2nd 2015Food contact materials contain low molecular weight additives and processing aids which can migrate into foods leading to trace levels of contamination. Food safety is ensured through regulations, comprising compositional controls and migration limits, which present a significant analytical challenge to the food industry to ensure compliance and demonstrate due diligence. Of the various analytical approaches, LC-MS/MS has proved to be an essential tool in monitoring migration of target compounds into foods, and more sophisticated approaches such as LC-high resolution MS (Orbitrap) are being increasingly used for untargeted analysis to monitor non-intentionally added substances. This podcast will provide an overview to this area, illustrated with various applications showing current approaches being employed.

