A Standardized 2D-LC Screening Platform for Peak Purity Determination in Pharmaceutical Analysis
The determination of peak purity in chromatographic methods used in pharmaceutical analysis is a vital step in evaluating specificity to ensure the safe production of medicines. Current peak purity assessments accomplished through diode array detectors (DAD) and mass spectrometry (MS) have some challenges that could lead to misinterpreted purity values when the sample under evaluation is susceptible to the limitations of these techniques. Two-dimensional liquid chromatography (2D-LC) has the ability to resolve difficult-to-separate mixtures, and has been widely adapted to biological compounds. This study proposes a 2D-LC screening method as a means of determining peak purity of active pharmaceutical ingredients (API) and their related substances. Results confirm that the 2D-LC screen was successful in separating API/impurity mixtures in all 10 test cases studied. Selection of screening conditions including mobile phase choice and column selection is discussed along with the effectiveness and idiosyncrasies of peak purity analysis by 2D-LC.
The possible pitfalls of diode array detectors-ultraviolet region (DAD-UV) absorbance based peak purity determinations have been well documented (1,2). Some possible issues with DAD-UV based peak purity include: i) co-eluted impurities frequently have very similar structures and spectra, ii) co-eluted impurities may be at too low of a level to be detected, iii) co-eluted impurities with the same peak shape and elution profile are not detected, and iv) fast gradients may exhibit spectral changes in the baseline throughout the peak. Mass spectrometry (MS) detection coupled with high performance liquid chromatography (HPLC) has been a boon for the detection and structural identification of compounds for the pharmaceutical industry. High resolution MS/MS analysis and data independent acquisition have been successfully employed to differentiate overlapping peaks in chromatographic separations (3). Adding a mass spectrometer creates an orthogonal dimension of analysis capable of detecting co-eluted impurities based on a difference in mass-to-charge ratio, but likewise exhibits some weaknesses. Among them is its inability to easily differentiate stereoisomers and its susceptibility to suppression effects (particularly when examining peak purity of the major component). The shortcomings of these analytical techniques necessitate the search for additional methods for peak purity analysis that can account for the weaknesses of 1D-HPLC and MS but retain their ease of use and applicability. Two-dimensional liquid chromatography (2D-LC) analysis has emerged as the premier technology for complex mixture analysis in chromatography (4).
To realize the power of 2D-LC, it is critical to maximize orthogonality between the two dimensions. Orthogonality can be achieved either through changing the separation mode in the 2nd dimension or by changing mobile phase or stationary phase within a given mode. Often changing modes between the 1st (1D) and 2nd (2D) dimensions is not an easy task (4,5). With the majority of analyses in HPLC being performed in the reversed-phase mode, switching to hydrophilic-interaction chromatography (HILIC) or normal phase causes a number of problems arising from the mismatch of solvents (4). To produce an easy to use, walk-up screening method it is therefore easier to keep the 2nd dimension in reversed-phase mode and switch column stationary phases instead. Research on reversed-phase stationary phases is extensive and well established (6–8). Several models, including the hydrophobic subtraction model (HSM), have been developed to allow the end user a rapid, mathematical mode to understand orthogonality (9). Additionally, mobile phase selection can greatly influence the ionization state of compounds which has confounding effects on separation. 2D-LC affords a unique ability to switch mobile phases between the dimensions. Switching from a low pH solution in the 1st dimension to a higher pH in the 2nd dimension opens the possibility for orthogonal separation based on pH alone.
The goal of this study was to create a fast and reliable 2D-LC method for peak purity determination. A comparison of the purity results of the 2D-LC screening method to those of one-dimensional (1D)-HPLC detection by DAD and mass spectrometric detection is evaluated. This manuscript details the design of the screening method as well as the pitfalls observed using the 2D-LC approach. Three notable examples of the use of the 2D-LC screening protocol are discussed. In the first case, DAD purity missed an 11% impurity that co-eluted with the active pharmaceutical ingredient (API) peak. In the second case, several stereoisomers prevented mass spectrometry detection from differentiating from each other and the API. Lastly, the sudden presence of large aberrant peaks in the 2nd dimension and how they were identified and resolved are discussed.
Materials and Methods
Materials
HPLC grade acetonitrile (ACN), methanol (MeOH), isopropyl alcohol (IPA), ammonium acetate (NH4OAc), formic acid (FA), and triethylamine (TEA) were purchased from Sigma-Aldrich. An in-house Milli-Q water system was used to obtain purified water. All API and impurity samples were synthesized at AbbVie. Columns in the 2nd dimension (C8, C18, RP-Amide, PFP, ES-Cyano, Phenyl-Hexyl, and Biphenyl) were purchased from Sigma-Aldrich, (2.1 x 50 mm, 2 μm superficially porous particles). Columns in the 1st dimension were purchased from Sigma-Aldrich, Waters, and Phenomenex. Column choice in the 1st dimension was dictated by the API and impurity analytical method.
Instrumentation
2D-LC was performed on an Agilent 1290 Infinity series 2D-LC system (Agilent Technologies). In the 1st dimension, the system is composed of quaternary pump, temperature-controlled multisampler, temperature-controlled multi-column compartment, and DAD detector. The 1st dimension is connected to the 2nd via an Agilent 1290 infinity valve drive equipped with a ten-port, five-position valve that allows for active solvent modulation (ASM) and storage of ten cuts up to 40 μL in two multiple heart-cutting valves. The 2nd dimension instrumentation mirrors the 1st dimension, except for the multisampler and replacement of the quaternary pump with a binary pump.
Chromatographic Conditions
Conditions Used in Section 3.2
The 1st dimension gradient for API 1 used a 3 x 150 mm, 1.7 μm Waters Acquity CSH C18 at 60 ºC. Mobile phase A was composed of 0.1% trifluoroacetic acid (TFA) and 1% THF in water, and mobile phase B was composed of 0.05% TFA and 1% THF in MeOH. Injection volume was 3 μL and flow rate was 0.5 mL/min. UV absorbance was measured with a diode array detector (DAD) at 290 nm.
Conditions Used in Section 3.3
The 1st dimension gradient for API 2 used a 4.6 x 100 mm, 2.7 μm Ascentis Express C18 column at 60 ºC. Mobile phase A was 95:5 25 mM Ammonium Acetate:MeOH, and mobile phase B was MeOH. Injection volume was 8 μL and flow rate was 0.9 mL/min. UV absorbance was measured with the DAD at 247 nm.
Conditions Used in Section 3.4
The 1st dimension gradient for API 3 used a 4.6 x 100 mm, 2.7 μm Ascentis Express C18 column at 60 ºC. Mobile phase A was 25 mM Ammonium Acetate at pH 5.4 and mobile phase B was 60:40 of IPA:ACN. Injection volume was 5 μL and flow rate was 0.7 mL/min. UV absorbance was measured with the DAD set to 280 nm.
2D-LC Screening Method
Mobile phase A was either: 0.1% TFA, 25 mM ammonium acetate pH 4.5, or 25 mM ammonium acetate pH 6.8. Mobile phase B was acetonitrile and a 6 min gradient elution method was used in the 2nd dimension. The first 30 sec of the method constitute a hold at 5% B where active solvent modulation (ASM) occurred at a 3:1 ratio, followed by a 5 min ramp to 95% B, and finally a step gradient back to 5% B, where it was held to re-equilibrate the column. Flow rate was set to 1 mL/min and UV absorbance was measured with a DAD set to the wavelength of the 1st dimension method. The temperature of the 2nd dimension column was 40 ºC.
Results and Discussion
Development of a 2D-LC Screening Method for Impurity Detection
Developing the screening method began by understanding ways in which orthogonality in the 2nd dimension can be balanced with ease of use for the analyst. A recent review on 2D-LC applications by Pirok, Stoll, and Schoenmakers compiled data on which modes are most utilized in both the first and 2nd dimensions (10). While 1st dimension modes vary, the dominant 2nd dimension mode is RPLC. Therefore, to establish an easy to use, walk-up screening platform, it was decided to forego switching modes in the 2nd dimension. Enhancing the separation capability in reversed-phase chromatography is a highly researched and established topic (11,12). To maximize reversed-phase separation in the 2nd dimension, different mobile phase compositions were combined with contrasting bonded stationary phases. Most pharmaceutical APIs contain at least one ionizable group, making mobile phase pH an important factor in chromatographic separation (13). Changing mobile phase pH provides some orthogonality to separate complicated mixtures, but pH switching along with the utilization of different stationary phases was done to maximize orthogonality.
Changing column stationary phases in a screening protocol is a simple step that can have powerful consequences because selectivity is strongly influenced by stationary phase composition. A full screening profile in the 2nd dimension employs a set of columns that covers a wide range of chemical interactions. Figure 1 displays the complete column set installed in the 2nd dimension and the interactions that predominate in each. Dimensions of the columns were kept standardized to 2.1 x 50 mm, 2.0 μm (1000 bar max) and facilitated quick runtimes in the 2nd dimension to keep the total run time to a minimum.
FIGURE 1: 2D-LC screening protocol flowchart and column specifications. When a sample and method with a suspected impurity are received, the different mobile phase/column combinations are run in series and the purity of the method determined. Optionally, the user can attempt to quantitate any observed impurities with HiRes heart cutting. Columns in the 2nd dimension are of all the same dimensions (2.1 mm x 50 mm, 2.0 μm). Experimental conditions are provided within the text.
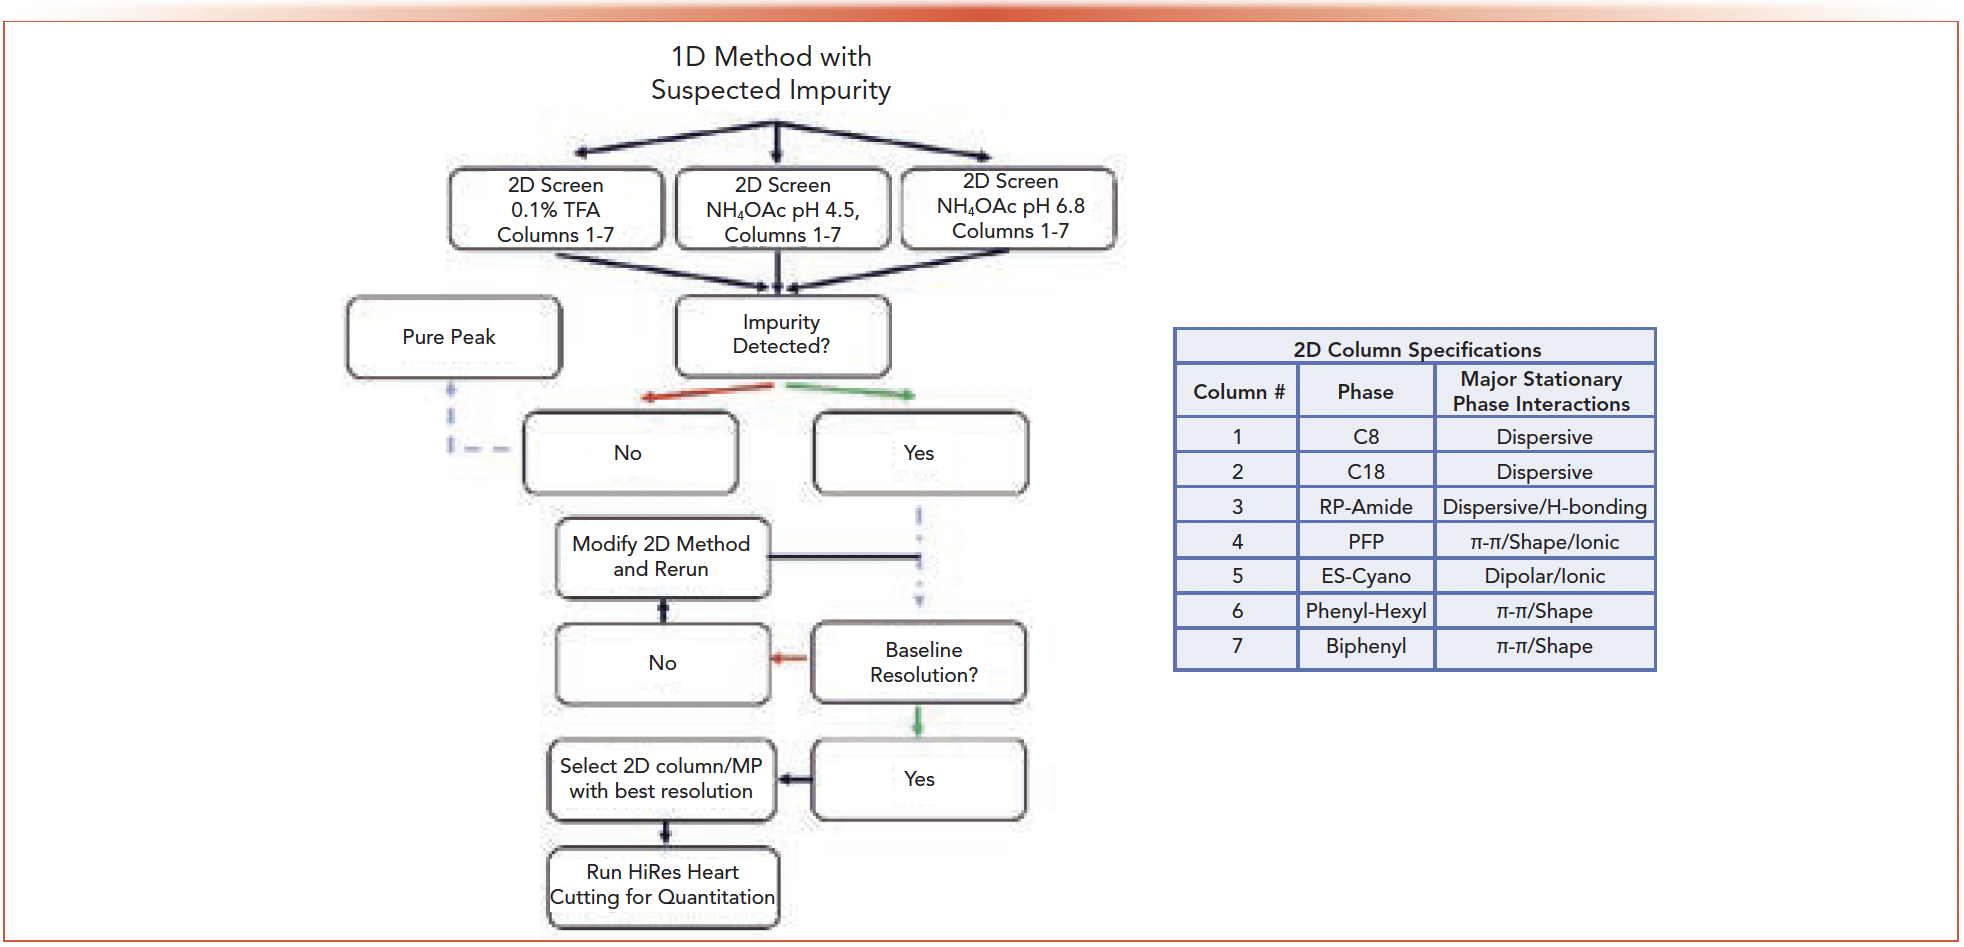
A flowchart was designed that encompasses the steps of the 2D-LC screening protocol (Figure 1). The choice of how many cuts to take across a peak of interest is determined by the width of the peak in question. To reduce analysis time, it can be beneficial to cut across the width of the whole peak as long as it can be encompassed in one cut. If the peak is too large to be analyzed in a single cut, then a set of three cuts made at the front, apex, and tail will suffice. After the initial 3 mobile phase x 7 column screen, if co-elution is detected and quantitation is needed, the user can continue to the second half of the flowchart where HiRes heart cutting is utilized to provide relative quantitation of the impurity in question. To test the efficacy of the screening method, eight representative APIs were evaluated with methods that forced co-elution between the API and select impurities. Three examples of the capability of 2D-LC to determine purity are discussed below.
2D-LC to Compliment DAD Peak Purity
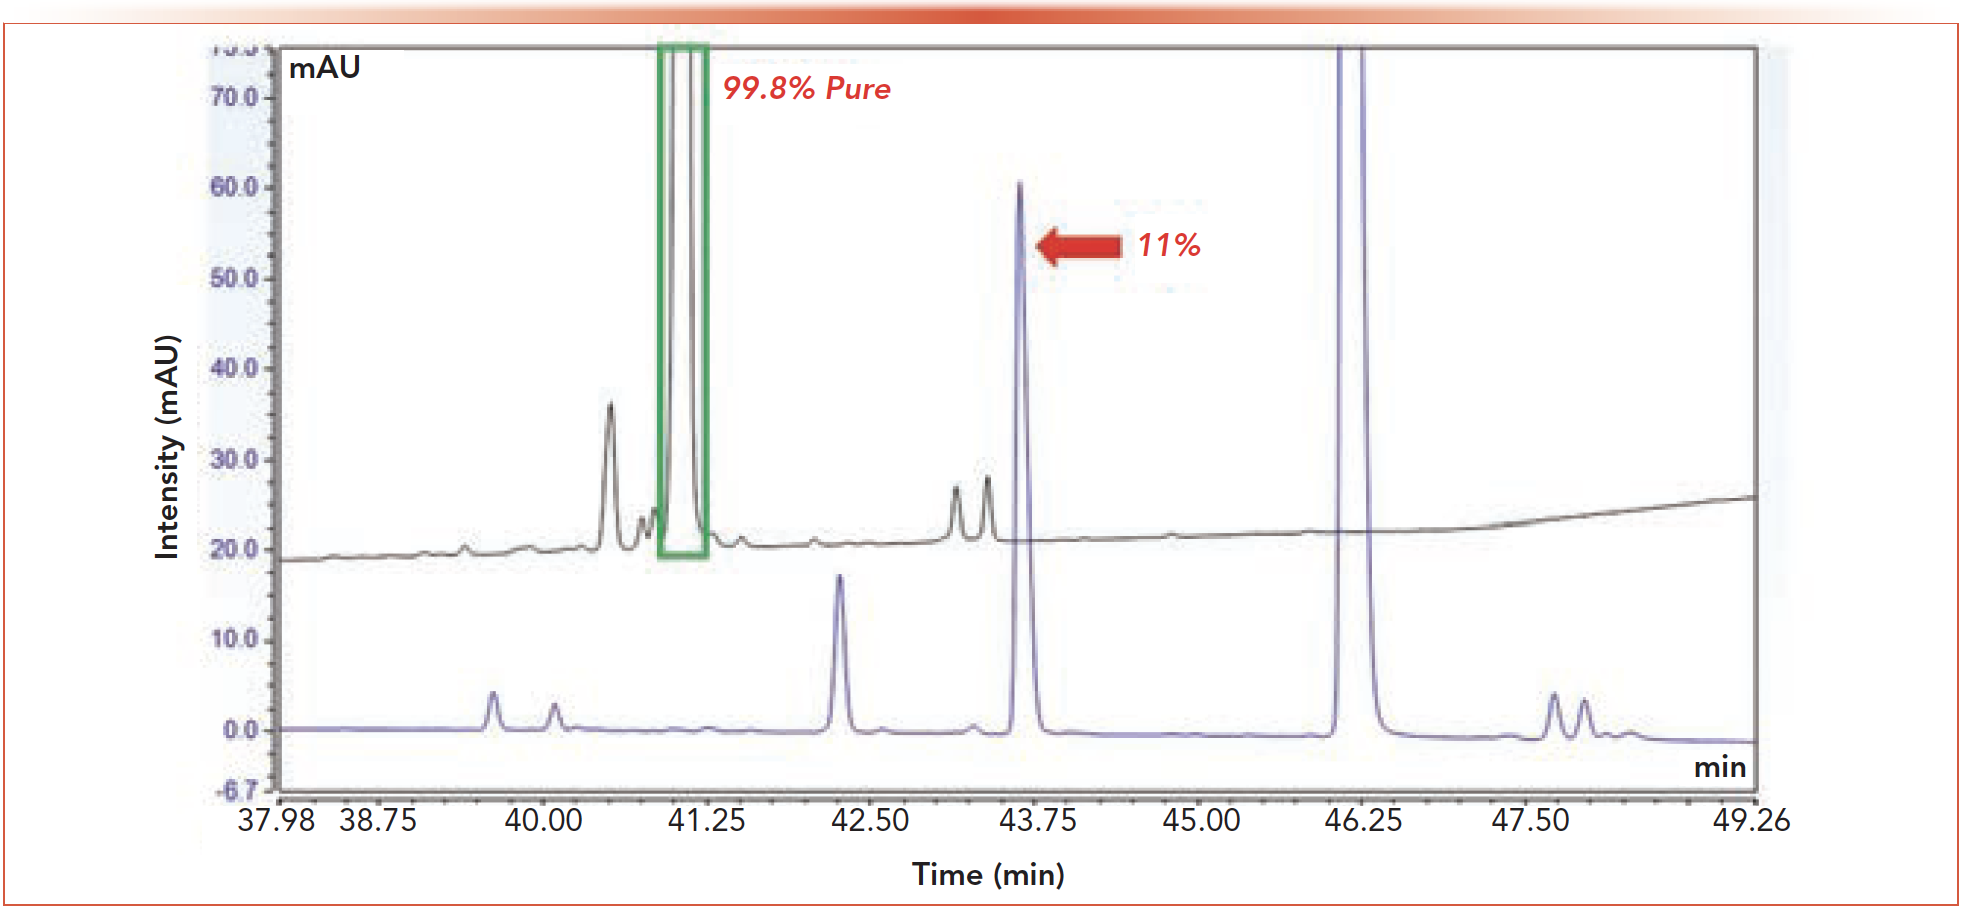
With peak purity determination via DAD in the 1st dimension having its limitations, 2D-LC can be a complementary method of defining peak purity. The black trace in Figure 2 shows a 1st dimension chromatogram of API 1 and its impurities. Boxed in green is the API peak of which DAD purity labeled as 99.8% pure. Subsequent manual screening and analysis of the 1st dimension chromatogram were conducted to separate an 11% peak shown in the blue chromatogram. This case study demonstrates a scenario where 2D-LC screening would have saved time and effort in demonstrating the purity of the peaks in the chromatogram.
FIGURE 2: Single dimension HPLC chromatograms showing the API peak of interest (highlighted in green, black trace) which the DAD software labeled as 99.8% pure. The blue trace shows the result of a modification to the method which resolved an 11% impurity previously co-eluted with the API. See the experimental section for detailed information on experimental conditions.
Results of the 2D-LC screening analysis for this API/impurity mixture are presented in Figures 3a–3c. Resolution between the API and the impurity was achieved in 18 of the 21 runs. Inspection of the chromatograms reveals 25 mM ammonium acetate at pH 4.5 generally had the best API to impurity resolution. The PFP column provided the best resolution between API and impurity. Interestingly, the PFP column was the only column in which the impurity eluted after the API when mobile phase A was at pH 4.5. For all other columns, this pattern occurred only when the pH of mobile phase A reached 6.8. Most important was the ability of the 2D screening method to resolve the impurity quickly and accurately, while DAD was unable to detect the original co-eluting impurity.
FIGURE 3: 2nd dimension chromatograms for the impurity screen of API 1. Chromatographic conditions are described within the text. (a) 0.1% TFA, (b) 25 mM ammonium acetate at pH 4.5, (c) 25 mM ammonium acetate at pH 6.8. Chromatogram (b) gave the best resolution between API and impurity. Of note is the reversal of elution order for the PFP column for the pH 4.5 mobile phase.

2D-LC to Compliment Mass Spectrometric Peak Purity
As MS detection is reliant on differing mass-to-charge ratios for detection, it cannot differentiate stereoisomers. API 2 is a cyclic compound with seven chiral centers making it likely that diastereomers will be observed in manufacturing. To evaluate the 2D-LC screening platform for its ability to resolve diastereomeric impurities from the API, a mixture of four diastereomers of API 2 were combined with the API and the chromatographic condition was modified to force coelution of the API and these diastereomers in the 1st dimension. 2D-LC screening was then used to resolve these diastereomers in the 2nd dimension.
Separation of API 2 from its impurities was the most challenging out of the eight API/impurity mixtures studied. The initial screen of all mobile phases and columns failed to produce baseline resolution between the four diastereomeric impurities and the API. Resolution between the API and the most resolved impurity did not reach a satisfactory level (Rs > 1.5) for either 0.1% TFA or 25mM ammonium acetate pH 6.8. Figure 4 displays the best result of the screen which was 25 mM ammonium acetate pH 4.5 on the C18 column where all the diastereomers were at least partially resolved.
FIGURE 4: (a) 2nd dimension chromatograms for API 2 using 25 mM ammonium acetate pH 4.5. These results constitute the best resolution achieved with the screening protocol. In no chromatogram were all four impurities resolved from the API. (b) Results of HiRes heart cutting using the modified method on the C18 column. Peak area percentages are relative to the API peak.
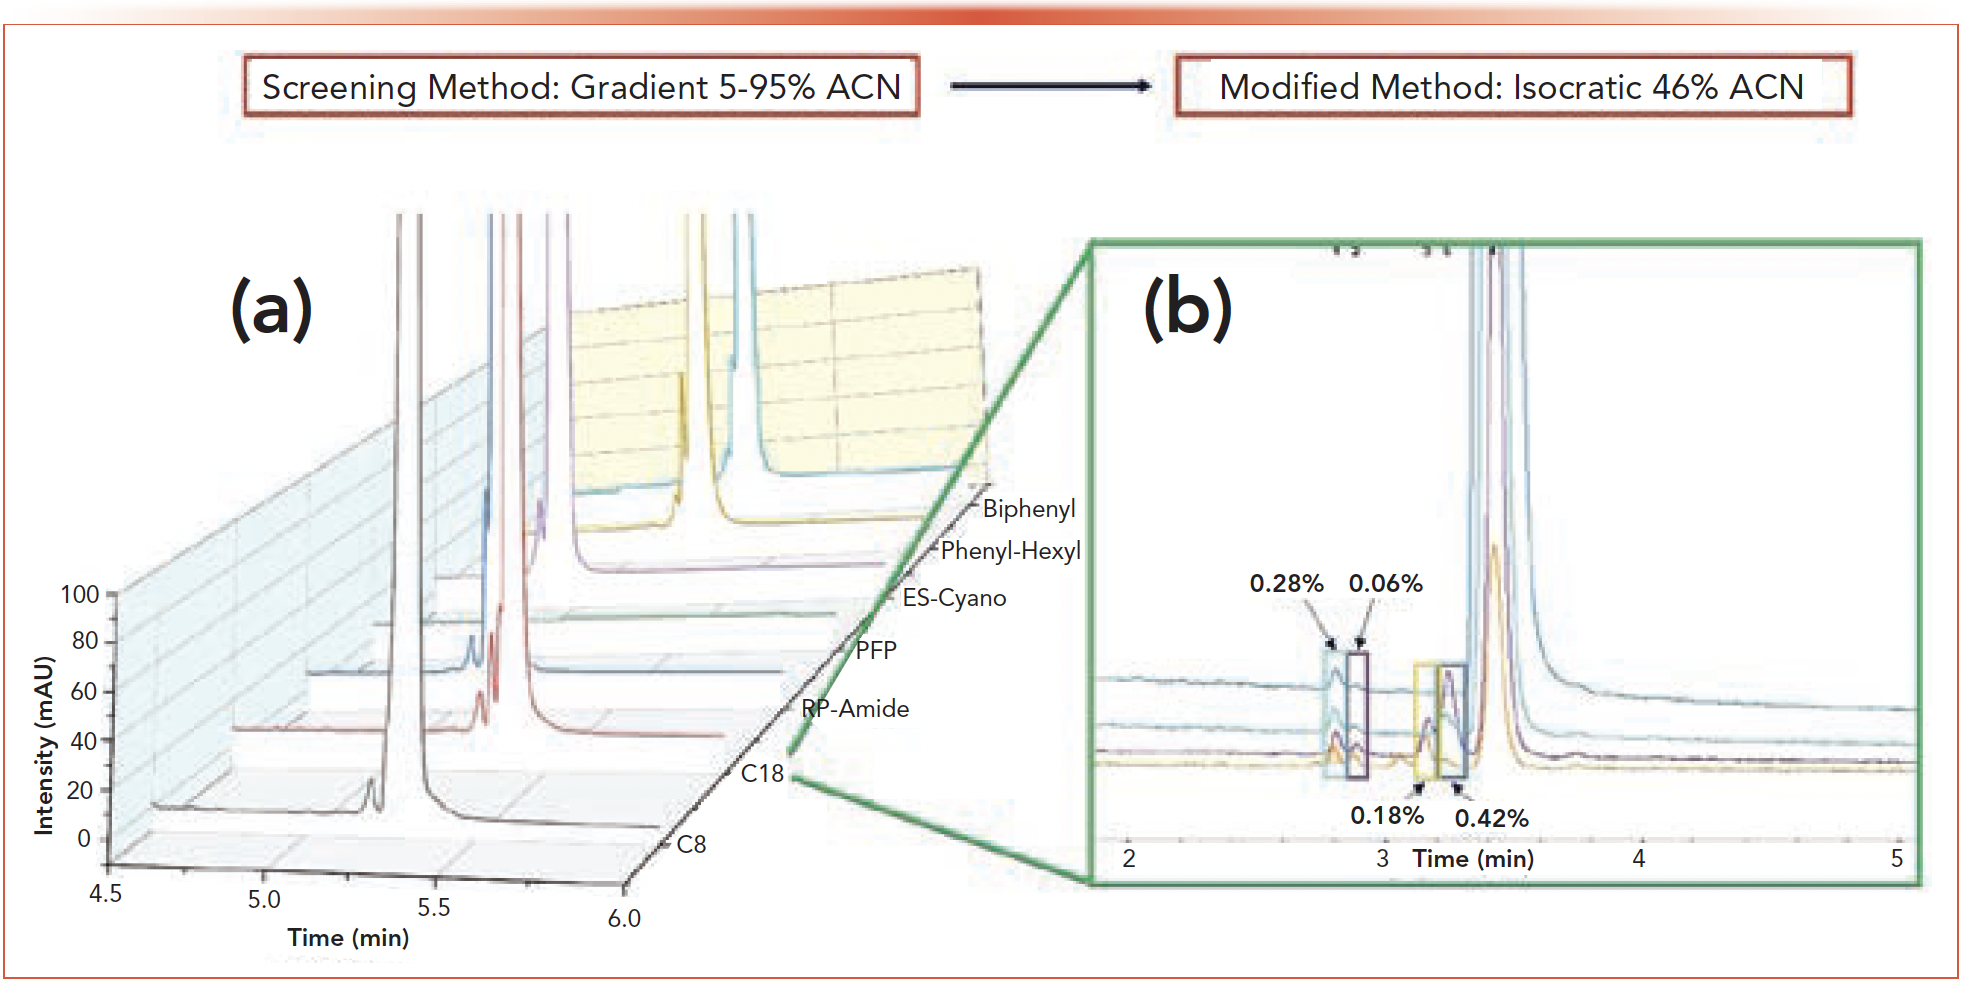
In order to quantitate the diastereomeric impurities, modifications to the 2D gradient were needed. Following the screening protocol, the combination of 25 mM ammonium acetate pH 4.5 and the C18 column were maintained in the 2nd dimension as they produced the best results in the initial screen (note, the 1st dimension utilized unadjusted ammonium acetate). An isocratic elution at 46% ACN resulted in an optimized 2D separation providing enough resolution between the API and the four impurities that HiRes heart cutting chromatograms could be acquired for quantitation. The HiRes chromatograms showing the separation of the impurities/API and the relative peak-area percentages of the impurities is shown in Figure 4. Notable in these chromatograms is the detection of the smallest of the diastereomers at 0.06% of the area of the API. Separation and identification of peaks of this size co-eluting with much larger API peaks shows the power of 2D-LC in impurity identification.
Peculiarities in 2D-LC Peak Purity Analyses
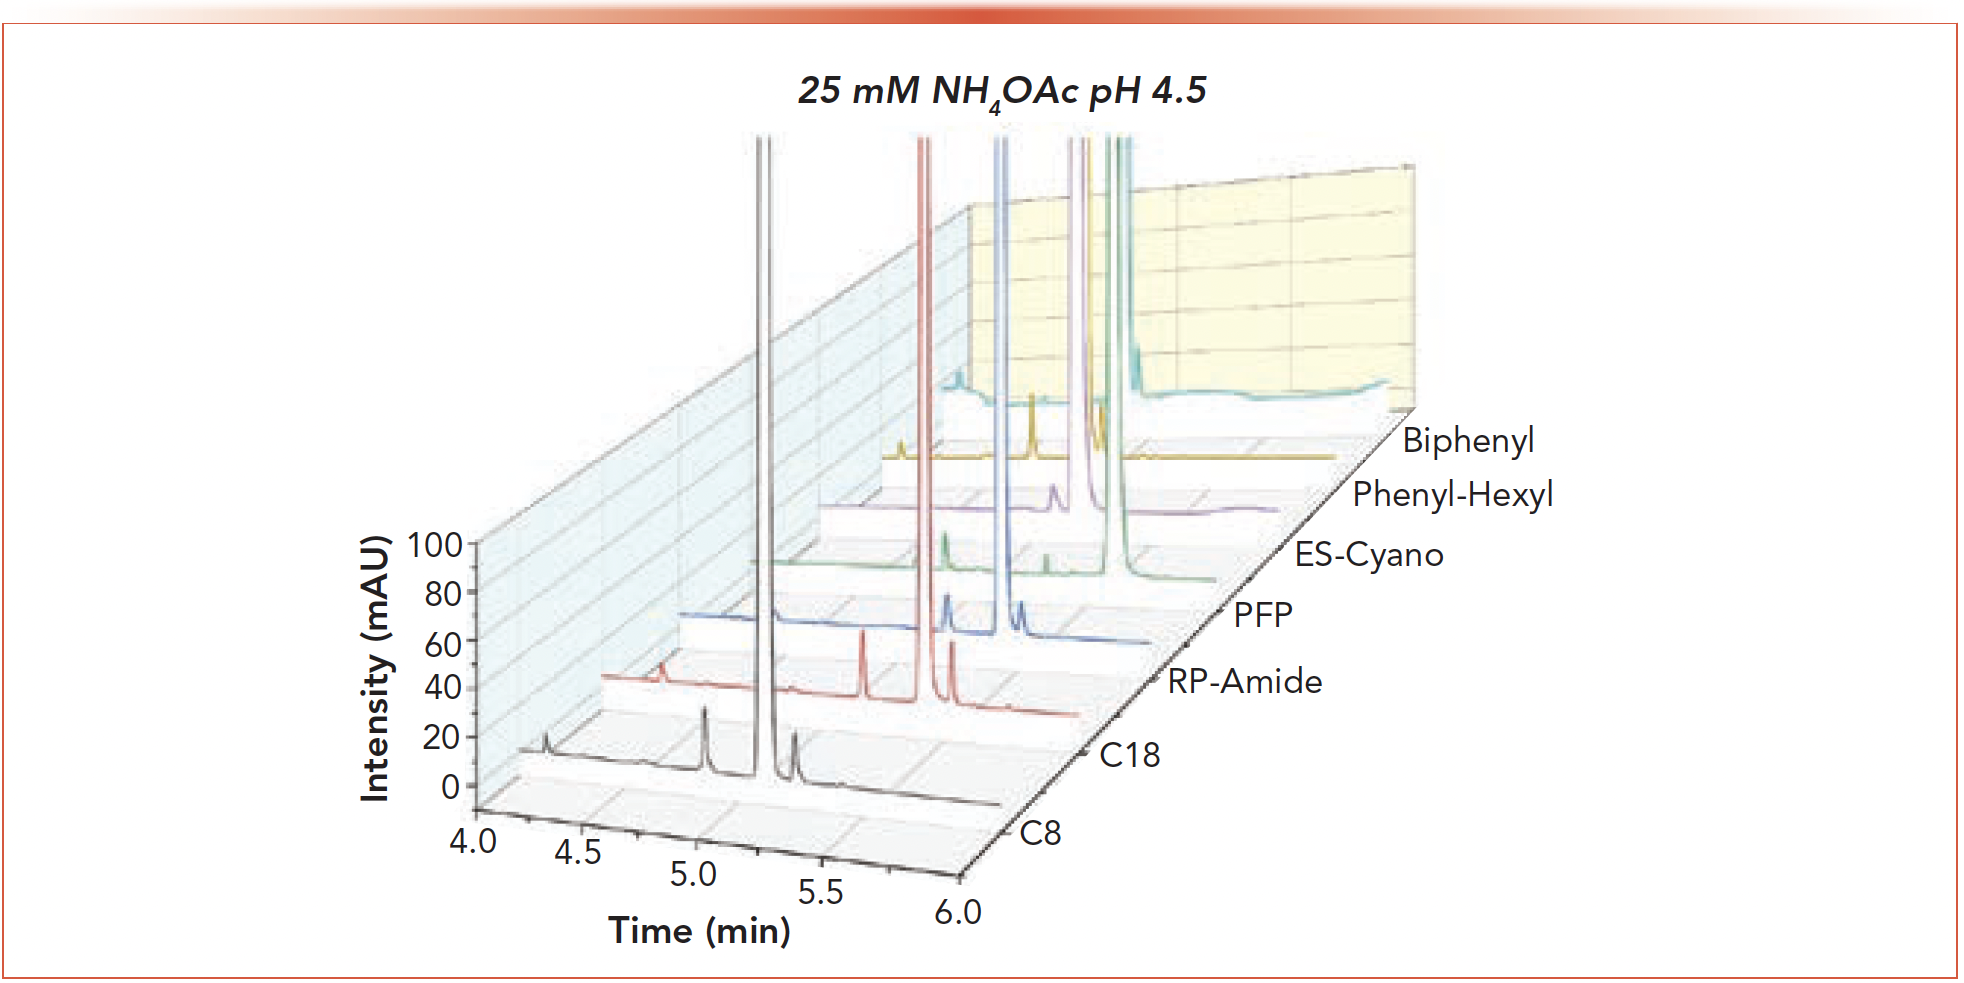
The separation of API 3 from a mixture of two of its impurities (impurity 1 and impurity 2) was a simple task for the 2D screening instrument. Figure 5 displays the chromatograms for each column with 25 mM ammonium acetate at pH 4.5 which proved to be the optimum mobile phase A. Baseline resolution between the API and impurities 1 (eluting before the API) and 2 (eluting after the API) was achieved with all but the PFP column. As with the previous samples, quantitation of the impurities was achieved with HiRes heart cutting of the API. The most interesting aspect of API 3 was not the eventual application of the screening protocol but the identification of an instrumental issue that raised alarms about the purity of the API.
FIGURE 5: 2nd dimension chromatograms for API 3 using 25 mM ammonium acetate pH 4.5. The peak being eluted before the API is impurity 1 while the peak eluting after the API is impurity 2.
Prior to modifying the 1st dimension method to force coelution of the API and impurities 1 and 2, a test heart cut was made on the pure API peak. The 2nd dimension chromatogram resulted in several impurities being detected at significant levels (>1% of the API peak area) indicating an impure API peak (Figure 6a). An inquiry into the genesis of the aberrant peaks began by acquiring high resolution fragmentation mass spectra of each peak in the 2nd dimension chromatogram. The mass spectra revealed that the aberrant peaks were known oxidative impurities that were previously identified molecules which were well resolved in the 1st dimension.
FIGURE 6: Troubleshooting the presence of aberrant peaks in the second dimension. (a) Initial 2nd dimension chromatogram of API 3 with suspected aberrant peaks highlighted by red box. (b) The identity of the aberrant peaks was confirmed using mass spectrometry. Comparison of the structures to the degradation mix ran with 1D-HPLC also confirm the identity of the peaks. (c) Fractions were collected after analysis in the 1st dimension and rerun through the full experiment with the 1st dimension method applied to the 2nd dimension. The lack of degradant peaks in the top chromatogram and the presence of these peaks in the bottom chromatogram confirm the peaks are arising from the 2D instrument. (d) Source of the degradants was found to be UV degradation due to the 1st dimension DAD detector. Switching the lamps off on the 1st dimension detector removed the aberrant peaks in the 2nd dimension.
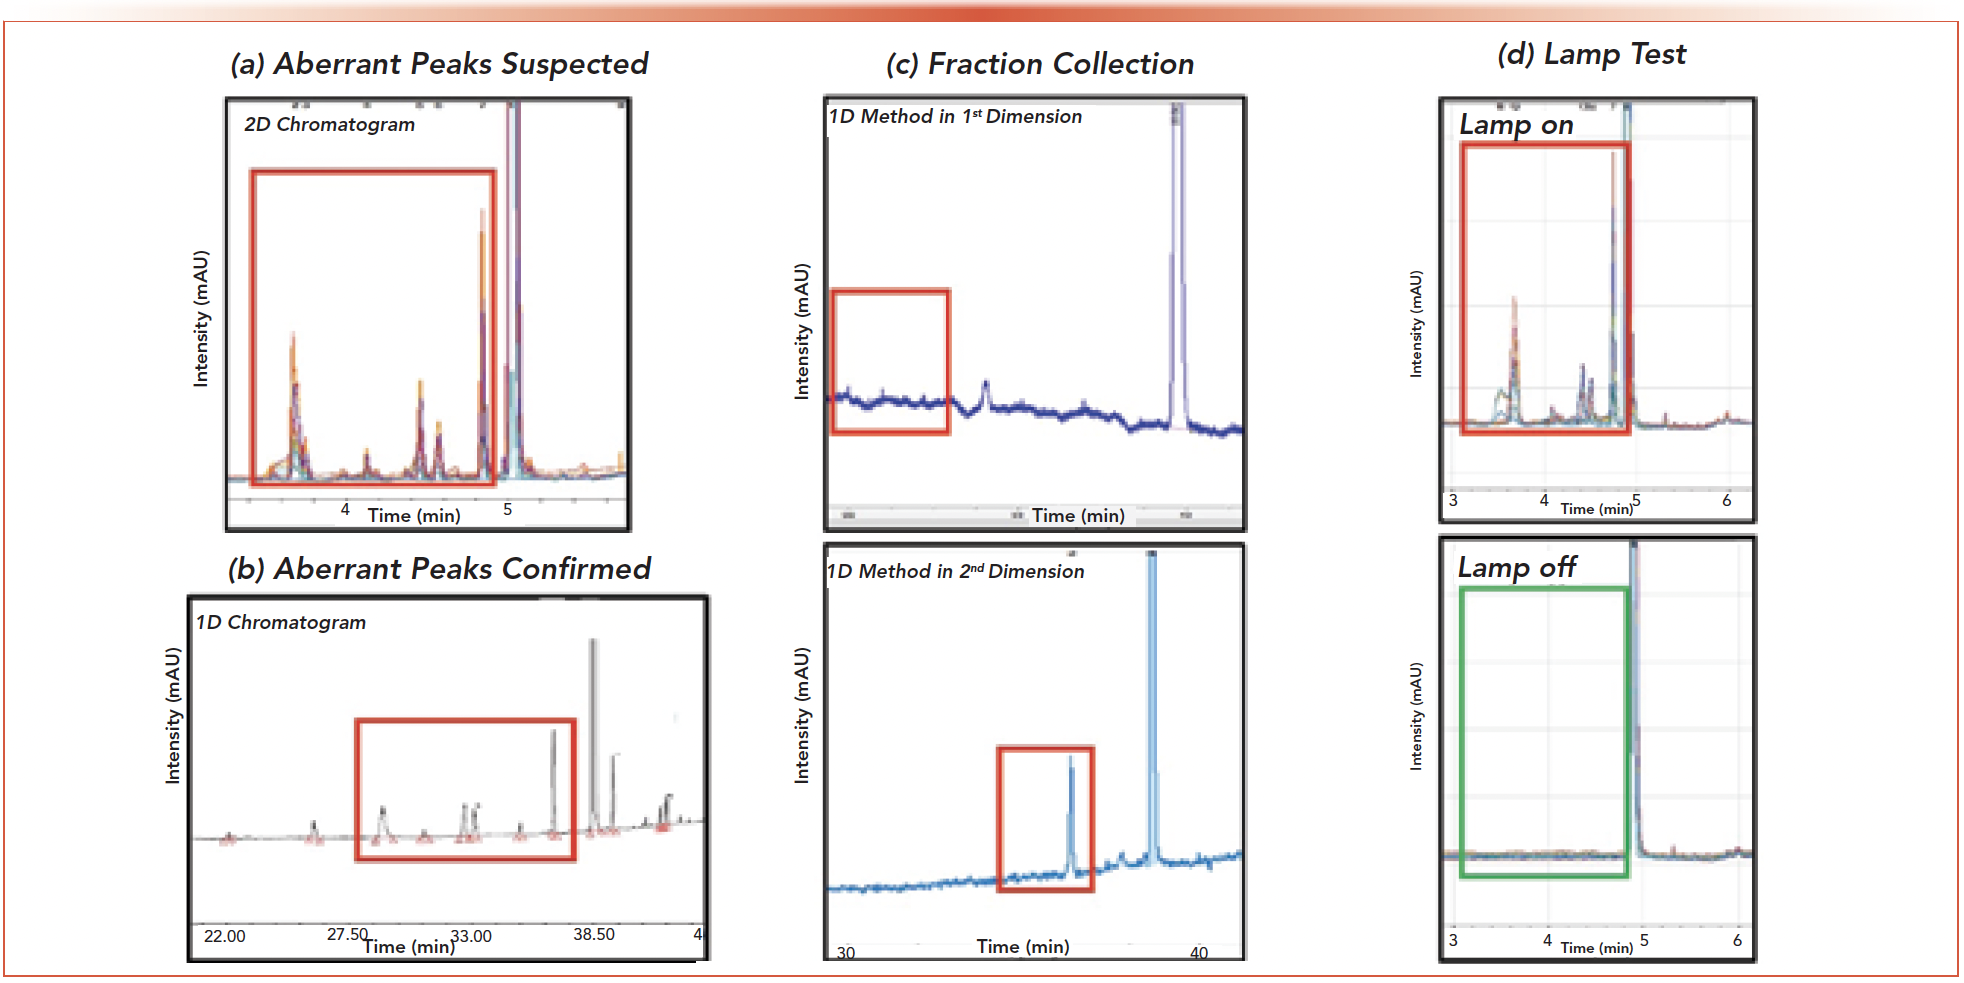
To determine whether the degradants were being formed within the 2D system or were co-elutions in the 1st dimension, the same method was run in the 1st and 2nd dimensions. Peaks in the 2nd dimension corresponding to the impurity spiked API sample were observed while no secondary peaks were seen in the 1st dimension. This established the likelihood that the degradation was indeed occurring in the 2D instrumentation. The presence of oxidative degradants in the 2nd dimension chromatogram led to the hypothesis that storage of each cut in the stainless-steel capillaries of the heart cutting valve could accelerate degradation of the API. Exposure to stainless steel is well known to increase the rate of oxidative degradation of pharmaceuticals (14). This hypothesis was tested by holding successive cuts within the stainless-steel capillaries for an increasing amount of time. No increase in signal associated with the degradant peaks was observed indicating that reaction with the capillaries was not likely the cause. The final piece of evidence confirming the origin of the aberrant peaks was obtained after collecting fractions of the API in the 1st dimension (without passing through the UV flow-cell) before it reached the 2nd dimension capillaries. Rerunning this fraction in the 1st dimension did not recreate the degradant peaks whereas performing the full 2D experiment with the collected fractions did. These tests confirmed that the instrument itself was indeed the culprit behind origin of the aberrant peaks.
Determination of the source of the aberrant peaks therefore required further testing of the instrumentation. Final resolution of this issue came when the 1st dimension diode array detector was turned off. After switching off the 1D DAD, the 2nd dimension chromatogram showed no detection of the large aberrant impurities. This evidence points to photodegradation of the API in the DAD flow cell as the culprit. Radical generation causing unwanted aberrant signals is not an uncommon phenomenon. The generation of radical induced degradation has previously been observed after HPLC DAD detection but may be commonly overlooked (15,16). While avoiding diode array detection is impractical, users of 2D systems should be aware of this possibility and be prepared to test the system with the 1st dimension DAD off or by installing specialized apertures to reduce the light intensity.
Analysis of 2nd Dimension Chromatographic Parameters
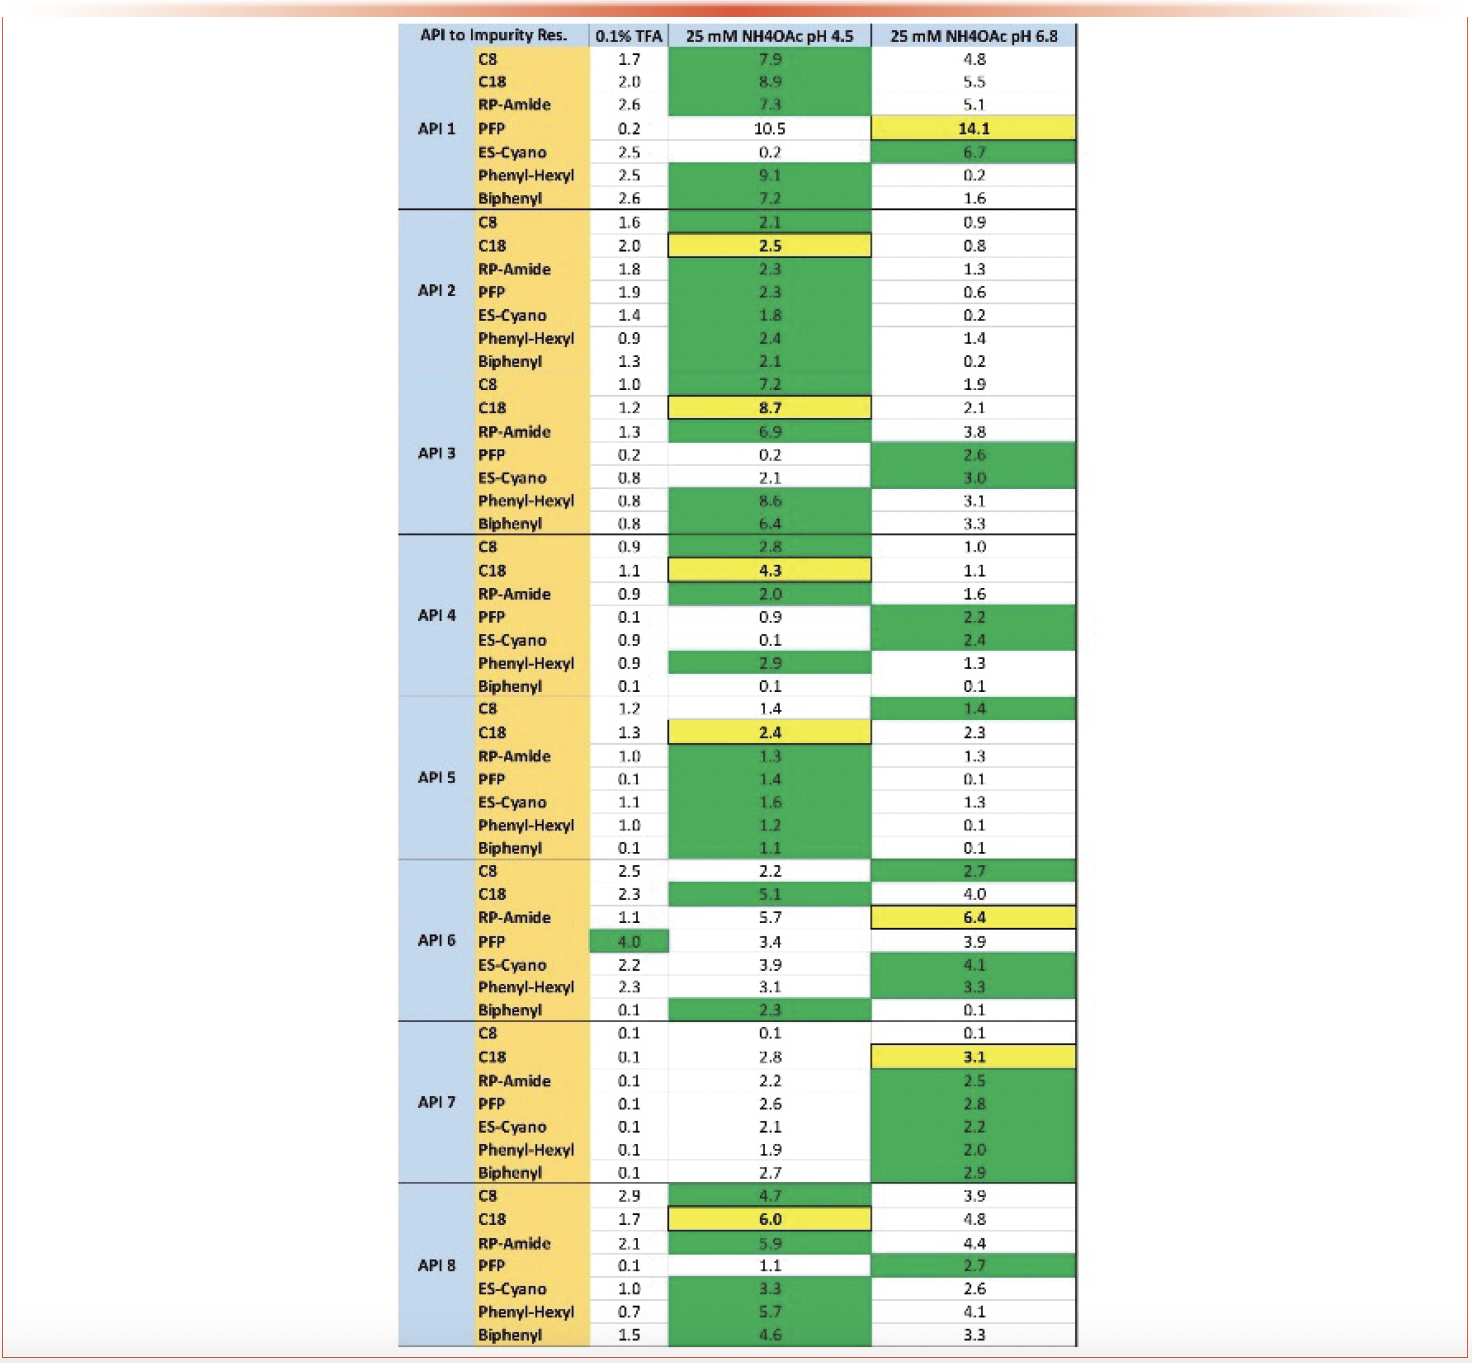
Application of the 2D-LC screening protocol to determine peak purity of APIs proved a successful and simple to utilize method. Of the eight API/impurity combinations tested the screening protocol was able to separate and quantitate the impurities in all cases. A summary of the APIs tested and the resolution achieved by each column/mobile phase combination are provided in Figure 7. The mobile phase that produced the optimum resolution for the majority of samples analyzed was 25 mM ammonium acetate at pH 4.5. Where mobile phase has a significant effect on the resolution of impurities in the separation, column stationary phase had less of an effect. It is worth noting that this evaluation was limited to eight APIs with their impurities forced to be co-eluted. In more realistic scenarios it is important to explore both mobile phase and stationary phase orthogonality. Of the 1st dimension columns used, 9 of 10 were C18 columns of various brand and make, and the last was a C8 column. In the 2nd dimension, the C18 stationary phase provided the best resolution in nine of ten samples studied. The resolution achieved by the C18 column were followed closely by the RP-Amide and PFP columns, but a large gap between these columns and the remainder persisted. While the C18 was the most optimal column for resolution in the 2nd dimension, the PFP stationary phase proved a good second-place option. A more streamlined screening system can be maintained with only PFP, RP-Amide, and C18 columns in the 2nd dimension which may be sufficient in most cases.
FIGURE 7: Compilation of the results of the 2D-LC purity screen for each of the API/impurity combinations. Numbers provided are the critical pair calculated resolutions between the API and the nearest impurity peak. Highlighted in green is the mobile phase A that gave the greatest resolution for each column. The yellow highlight shows the best column/mobile phase combination for each mixture.
Conclusions
2D-LC was utilized to quickly and accurately resolve API/impurity mixtures in the 2nd dimension that DAD and MS purity had difficulty differentiating. This is not to argue that 2D-LC is not without its issues. The presence of aberrant peaks in the 2nd dimension of one API sample created a difficult to solve problem that required an investigation to resolve. A screening method involving switching pH in the range of 2–7 and a column set of several orthogonal stationary phases in the 2nd dimension separated impurities in all the cases studied. Switching pH was the most important factor in obtaining resolution between the peaks of interest while column stationary phase had less of an effect. Overall, the addition of 2D-LC screening to determine purity provides another tool for peak purity determination, which can lead to stronger evidence of the specificity of related substances methods used in the analysis of pharmaceuticals.
Disclosures
All authors are employees of AbbVie and may own AbbVie stock. The design, study conduct, and financial support for this research were provided by AbbVie. AbbVie participated in the interpretation of data, review, and approval of the publication.
References
(1) Stoll, D.R.; Rutan, S.C.; Venkatramani, C.J. Peak Purity in Liquid Chromatography, Part I: Basic Concepts, Commercial Software, and Limitations. LCGC N. Am. 2018, 36 (2), 100–110.
(2) Stoll, D.R.; Rutan, S.C.; Venkatramani, C.J.; Cook, D.W. Peak Purity in Liquid Chromatography, Part II: Potential of Curve Resolution Techniques. LCGC N. Am. 2018, 36 (4), 248–255.
(3) Kruve, A.; Rebane, R.; Kipper, K.; et al. Tutorial review on validation of liquid chromatography–mass spectrometry methods: Part I. Anal. Chim. Acta 2015, 870, 29–44. DOI: 10.1016/j.aca.2015.02.017
(4) Pirok, B.W.J.; Gargano, A.F.G.; Schoenmakers, P.J. Optimizing separations in online comprehensive two-dimensional liquid chromatography. J. Sep. Sci. 2018, 41 (1), 68–98. DOI: 10.1002/jssc.201700863
(5) Feng, J.; Guo, Z.; Shi, H.; Gu, J; Jin, Y.; Liang, X. Orthogonal separation on one beta-cyclodextrin column by switching reversed-phase liquid chromatography and hydrophilic interaction chromatography. Talanta 2010, 81 (4), 1870–1876. DOI: 10.1016/j.talanta.2010.03.007
(6) Criscuolo, A.; Zeller, M.; Cook, K.; Angelidou, G.; Fedorova, M. Rational selection of reverse phase columns for high throughput LC–MS lipidomics. Chem. Phys. Lipids 2019, 221, 120–127. DOI: 10.1016/j.chemphyslip.2019.03.006
(7) Valkó, K.; Snyder, L.R.; Glajch, J.L. Retention in reversed-phase liquid chromatography as a function of mobile-phase composition. J. Chromatogr. A 1993, 656 (1), 501–520. DOI: 10.1016/0021-9673(93)80816-Q
(8) Lindsey, R.K.; Rafferty, J.L.; Eggimann, B.L.; Siepmann, J.I.; Schure, M.R. Molecular simulation studies of reversed-phase liquid chromatography. J. Chromatogr. A 2013, 1287, 60–82. DOI: 10.1016/j.chroma.2013.02.040
(9) Snyder, L.R.; Dolan, J.W.; Carr, P.W. The hydrophobic-subtraction model of reversed-phase column selectivity. J. Chromatogr. A 2004, 1060 (1), 77–116. DOI: 10.1016/j.chroma.2004.08.121
(10) Pirok, B.W.J.; Stoll, D.R.; Schoenmakers, P.J. Recent Developments in Two-Dimensional Liquid Chromatography: Fundamental Improvements for Practical Applications. Anal. Chem. 2019, 91 (1), 240–263. DOI: 10.1021/acs.analchem.8b04841
(11) Newby, J.J.; Legg, M.A.; Rogers, B.; Wirth, M.J. Annealing of silica to reduce the concentration of isolated silanols and peak tailing in reverse phase liquid chromatography. J. Chromatogr. A 2011, 1218 (31), 5131–5135. DOI: 10.1016/j.chroma.2011.05.080
(12) Barhate, C.L.; Wahab, M.F.; Breitbach, Z.S.; Bell, D.S.; Armstrong, D.W. High efficiency, narrow particle size distribution, sub-2 μm based macrocyclic glycopeptide chiral stationary phases in HPLC and SFC. Anal. Chim. Acta 2015, 898, 128–137. DOI: 10.1016/j.aca.2015.09.048
(13) Manallack, D.T. The pKa Distribution of Drugs: Application to Drug Discovery. Perspect. Medicinal Chem. 2007, 1, 25–38.
(14) Chen, M.; Cook, K.D. Oxidation Artifacts in the Electrospray Mass Spectrometry of Aβ Peptide. Anal. Chem. 2007, 79 (5), 2031–2036. DOI: 10.1021/ac061743r
(15) Schweikart, F.; Hulthe, G. HPLC–UV–MS Analysis: A Source for Severe Oxidation Artifacts. Anal. Chem. 2019, 91 (3), 1748–1751. DOI: 10.1021/acs.analchem.8b05845
(16) Wang, C.; Chen, S.; Brailsford, J.A.; Yamniuk, A.P.; Tymiak, A.A.; Zhang, Y. Characterization and quantification of histidine degradation in therapeutic protein formulations by size exclusion-hydrophilic interaction two dimensional-liquid chromatography with stable-isotope labeling mass spectrometry. J. Chromatogr. A 2015, 1426, 133–139. DOI: 10.1016/j.chroma.2015.11.065
John T. Lawler, Michael W. Lesslie, Corianne E. Randstrom, Yanqun Zhao, and Zachary S. Breitbach are with AbbVie Inc., Small Molecule Analytical R&D Department of AbbVie Inc., in North Chicago, Illinois. Direct correspondence to: zachary.breitbach@abbvie.com

Common Challenges in Nitrosamine Analysis: An LCGC International Peer Exchange
April 15th 2025A recent roundtable discussion featuring Aloka Srinivasan of Raaha, Mayank Bhanti of the United States Pharmacopeia (USP), and Amber Burch of Purisys discussed the challenges surrounding nitrosamine analysis in pharmaceuticals.
Extracting Estrogenic Hormones Using Rotating Disk and Modified Clays
April 14th 2025University of Caldas and University of Chile researchers extracted estrogenic hormones from wastewater samples using rotating disk sorption extraction. After extraction, the concentrated analytes were measured using liquid chromatography coupled with photodiode array detection (HPLC-PDA).
Silvia Radenkovic on Building Connections in the Scientific Community
April 11th 2025In the second part of our conversation with Silvia Radenkovic, she shares insights into her involvement in scientific organizations and offers advice for young scientists looking to engage more in scientific organizations.


