A Multiphase Sampling and Analytical Approach for Investigating Airborne PFAS Transmission
The authors evaluated a sampling and analytical system to measure differing modes of atmospheric per- and polyfluorinated substances (PFAS) transmission. The sampling was conducted with the FM4 sampling module, which features particulate collection followed by polyurethane foam sorption followed by activated carbon disc adsorption, a configuration designed to capture PFAS-laden particulate matter (one-micron to ten-microns), as well as aerosol, volatile, and ionic PFAS species in a single sampling event. Individual sampling media fractions were subsequently analyzed by gas chromatography coupled with tandem quadrupole mass spectrometry (GC–MS/MS) and liquid chromatography coupled with tandem quadrupole mass spectrometry (LC–MS/MS) for 33 ionic and 20 neutral PFAS species. A multi-day field sampling event conducted in an outdoor urban environment demonstrated that the system was able to capture and differentiate a number of airborne PFAS species. The study showed that simultaneous, multi-phase sample collection coupled with GC–MS/MS and LC–MS/MS analysis can be a useful approach to further elucidate the mode and manner of atmospheric PFAS transmission.
Investigations of new environmental per- and polyfluorinated substances (PFAS), contaminant sources, and dispersion modes continue to expand. Early studies targeted a small number of PFAS analytes (primarily long chain carboxylic and sulfonic acids) and largely focused on water-borne dispersion arising from PFAS manufacturing and industrial applications such as fire suppression foams (1). However, improved analytical methods based on tandem mass spectrometry have greatly increased the understanding of environmental PFAS contamination. More recently, focus has shifted to environmental PFAS compounds that display a much wider range of functionalities with more diverse chemical properties (2). This has expanded the view of how PFAS are dispersed in the environment.
Some non-ionic PFAS (particularly fluorotelomers) possess significant volatility and still others (both ionic and non-ionic) can be adsorbed upon airborne particulates (3). Highly polar ionic PFAS can become concentrated (up to 62,000-fold (4)) at the air-water interface of small bubbles, and then be dispersed as aerosols upon bursting. This phenomenon underlies the assertion that sea spray aerosol transport is responsible for the wide distribution of PFAS in remote arctic regions (5). Airborne transport also introduces the potential for dispersion of PFAS from aerated waste management facilities (6) and from indoor use of PFAS-containing stain repellents and anti-fogging agents (7).
These multiple modes of dispersion and potential sources have increased interest in airborne PFAS transmission but have also made it more difficult to study the phenomenon. PFAS analytical chemistry has made great strides, but fewer advances are seen in PFAS air sample collection. Notably, in 2021, the U.S. Environmental Protection Agency (EPA) introduced Other Test Method 45 (OTM-45), which features a multimedia air sampling configuration for measuring selected PFAS from stationary sources (8). However, the sampling apparatus is quite complex and difficult to run and is not amenable to high throughput PFAS analysis. A further advance has been reported by Wu and coauthors (9), which features a novel, integrated sampler design which can simultaneously collect both particulate and vaporous contaminants from ambient air, and has improved applicability for PFAS sampling from stationary sources.
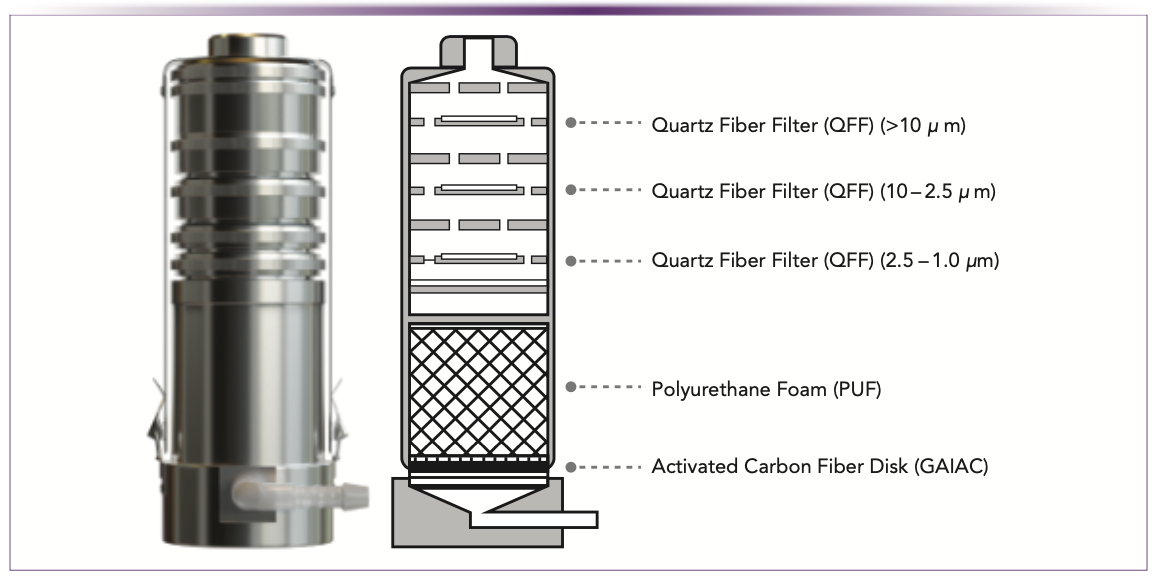
In this paper, we present field testing results from the deployment of a commercially available sampling device of the same design. The FM4 sampler simultaneously collects different airborne PFAS fractions (particulate, vapor, and ionic) on separate sorption media (quartz fiber filter, polyurethane foam and activated carbon fiber disc) for subsequent analysis. The analytical techniques employed (10) feature gas chromatography coupled with tandem quadrupole mass spectrometry (GC–MS/MS) for neutral PFAS analytes and liquid chromatography coupled with tandem quadrupole mass spectrometry (LC–MS/MS) for ionic PFAS.
The data presented below illustrate how the analysis of PFAS components captured on the various sampling media can differentiate chemically diverse PFAS species and suggest potential atmospheric transport modes. Results are presented from multiday field sampling events, which show distinctly different atmospheric PFAS compositions and suggest further opportunities for the application of this approach.
Experimental: Consumables
Standards and Reagents
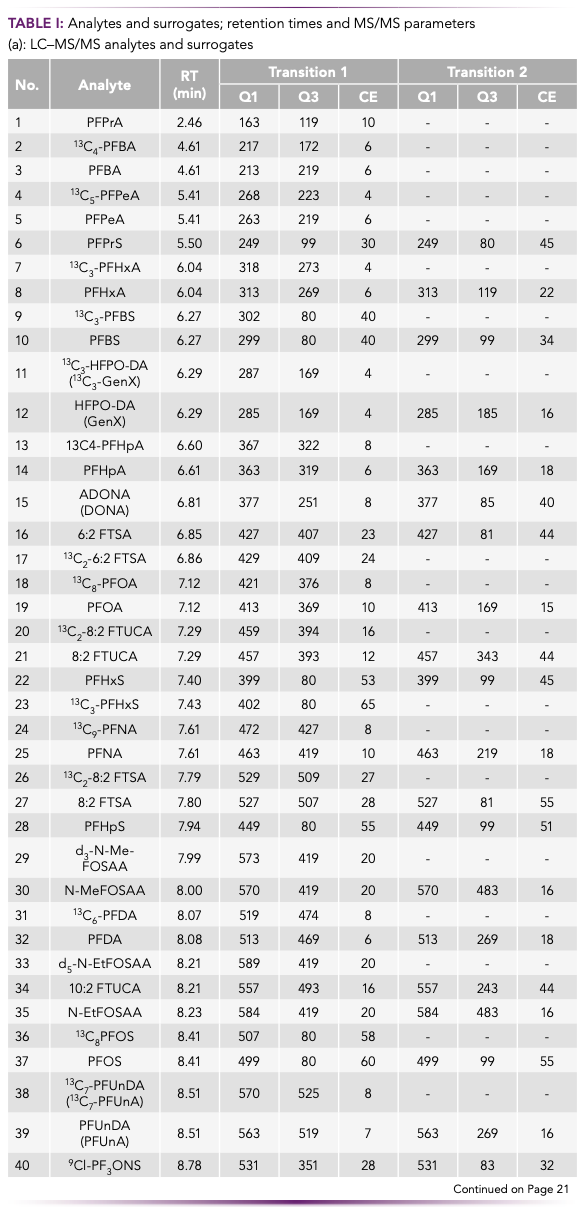
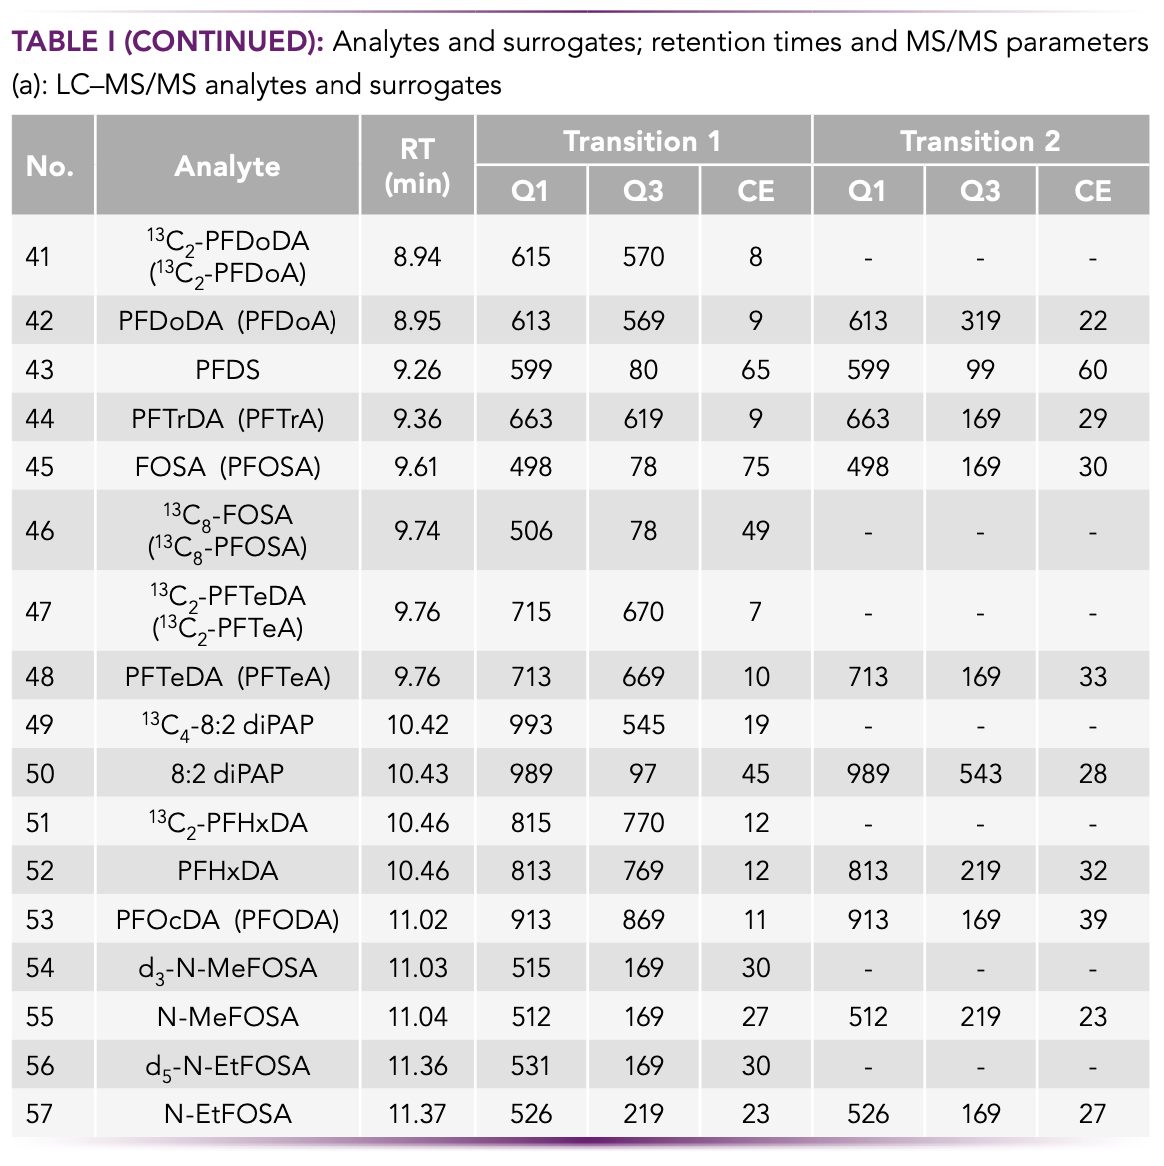
Target PFAS analytes and internal standards were obtained from Wellington Laboratories, Cambridge Isotope Laboratories, Biosynth Carbosynth, and Sigma-Aldrich, and are presented in Table I along with chromatographic retention times and MS/MS transition parameters. LC–MS grade methanol and acetonitrile were obtained from Kanto Chemical Co., ethyl acetate and ammonium acetate were obtained from Fujifilm Wako Pure Chemical Corporation, and dichloromethane was obtained from Kishida Chemical Co., Ltd.
FM4 Sorption Media
Quartz fiber filter (QFF) media (47 mm) of three classes (>10 μm, 10–2.5 μm and 2.5–1.0 μm), Polyurethane foam (PUF) sorption media (47 mm x 50 mm) and activated carbon fiber discs (GAIAC-47 mm) were obtained from GL Sciences, Inc.
Chromatographic Columns
LC column: 1.9 μm, 2.1 mm I.D. x 100 mm InertSustain AQ C18 and GC column: 0.25 mm i.d. x 30 m, df = 0.25 μm InertCap Pure-WAX were both obtained from GL Sciences, Inc.
Experimental - Instrumentation
Air Sampling Device
The FM4 air sampling devices (10) were acquired from GL Sciences, Inc. and were operated at a flow rate of 20 L/min. A schematic diagram is presented in Figure 1.
FIGURE 1: Schematic diagram of the FM4 sampler.
LC–MS/MS Instrumentation
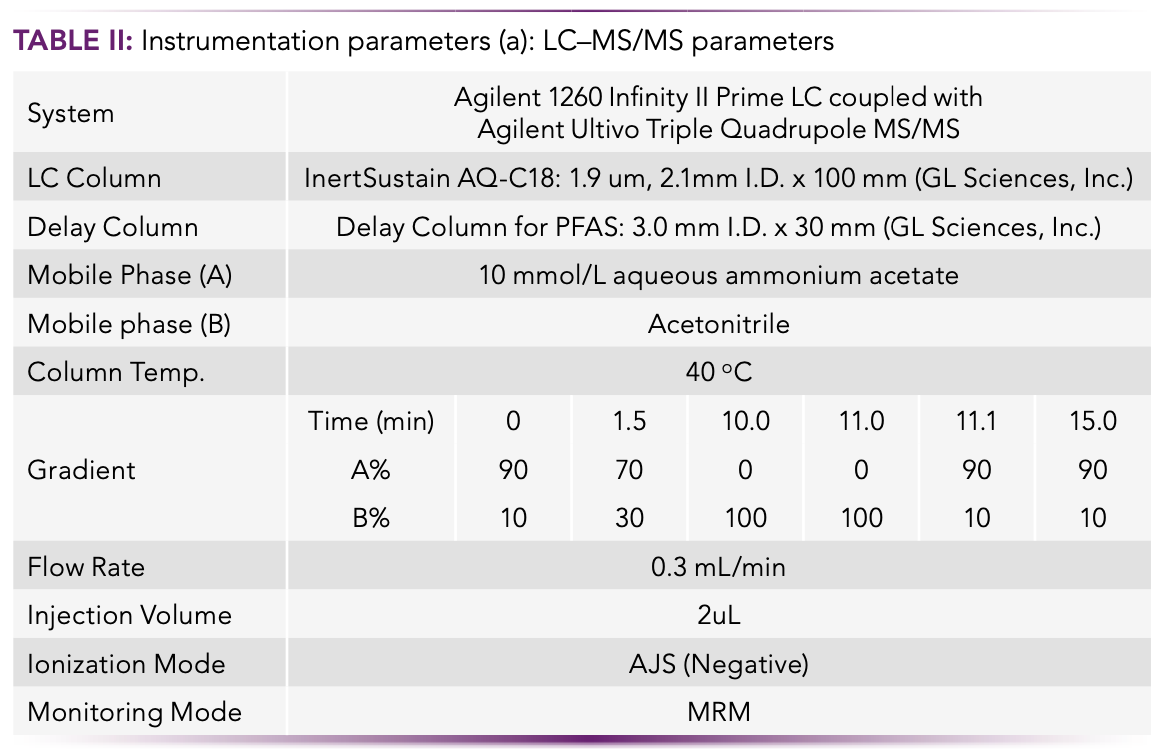
The instrumentation parameters for the LC–MS/MS target analytes were developed with an Agilent 1260 Infinity Prime LC coupled with an Agilent Ultivo Triple Quadrupole LC–MS/MS, and are presented in Table II. The analytical methodology followed ISO 21675:2019.
GC–MS/MS Instrumentation
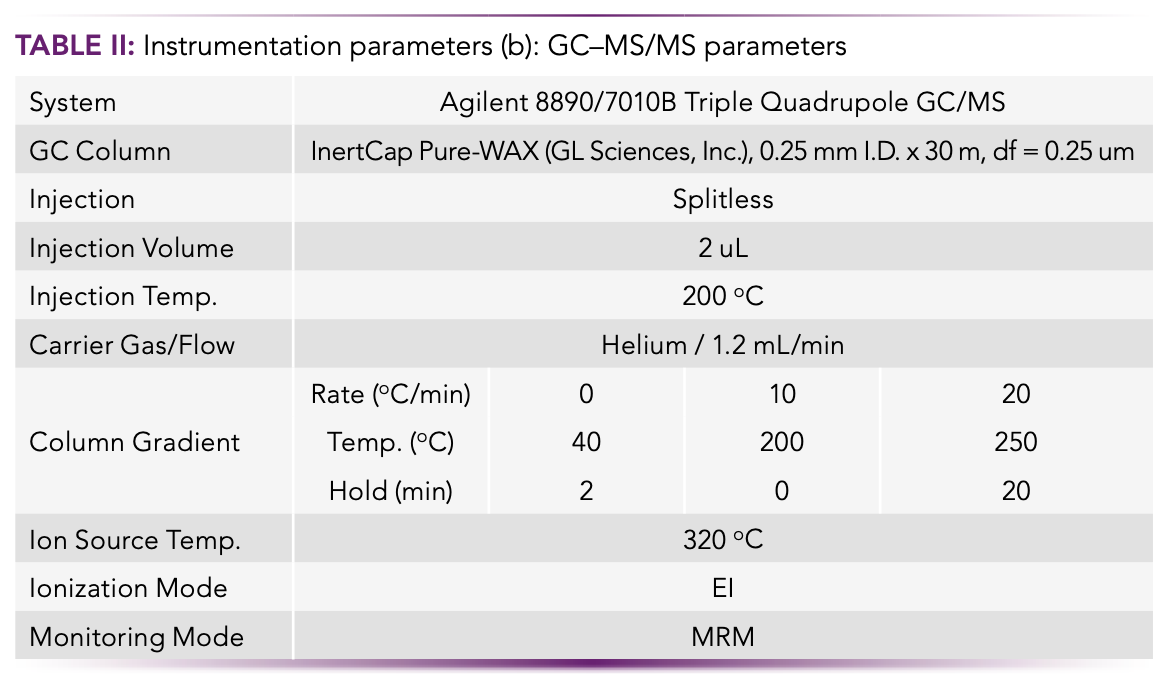
The instrumentation parameters for the GC–MS/MS target analytes were developed with an Agilent 8890/7010B Triple Quadrupole GC–MS/MS, and are presented in Table IIb. The analytical methodology followed the procedures described more fully in reference (10).
Preparation and Extraction of Sampling Media
The sampler and media were precleaned to remove PFAS artifacts. QFF media were baked for 3 h at 350 oC to remove volatile contaminants. The PUF filters and GAIAC discs were sequentially cleaned with water, methanol, ethyl acetate and dichloromethane, and dried in a vacuum oven. Metal components of the FM4 sampler were cleaned by sonication in 50% water:ethanol.
For LC–MS/MS analysis, QFF media were extracted and vortexed three times with 4 mL of methanol and the combined 12 mL of extract was then reduced in volume to 1 mL by nitrogen gas evaporation at 40 oC. PUF media and GAIAC disks were each extracted three times with 10 mL of 1:1 dichloromethane:ethyl acetate and the combined 30 mL of extract was then reduced in volume to 1 mL by nitrogen gas evaporation at 35 oC and directly analyzed by GC–MS/MS. The remaining extract was then evaporated to near dryness with nitrogen gas at 40 oC and taken up in 1 mL of methanol for LC–MS/MS analysis.
Results and Discussion
Method Chromatographic Performance
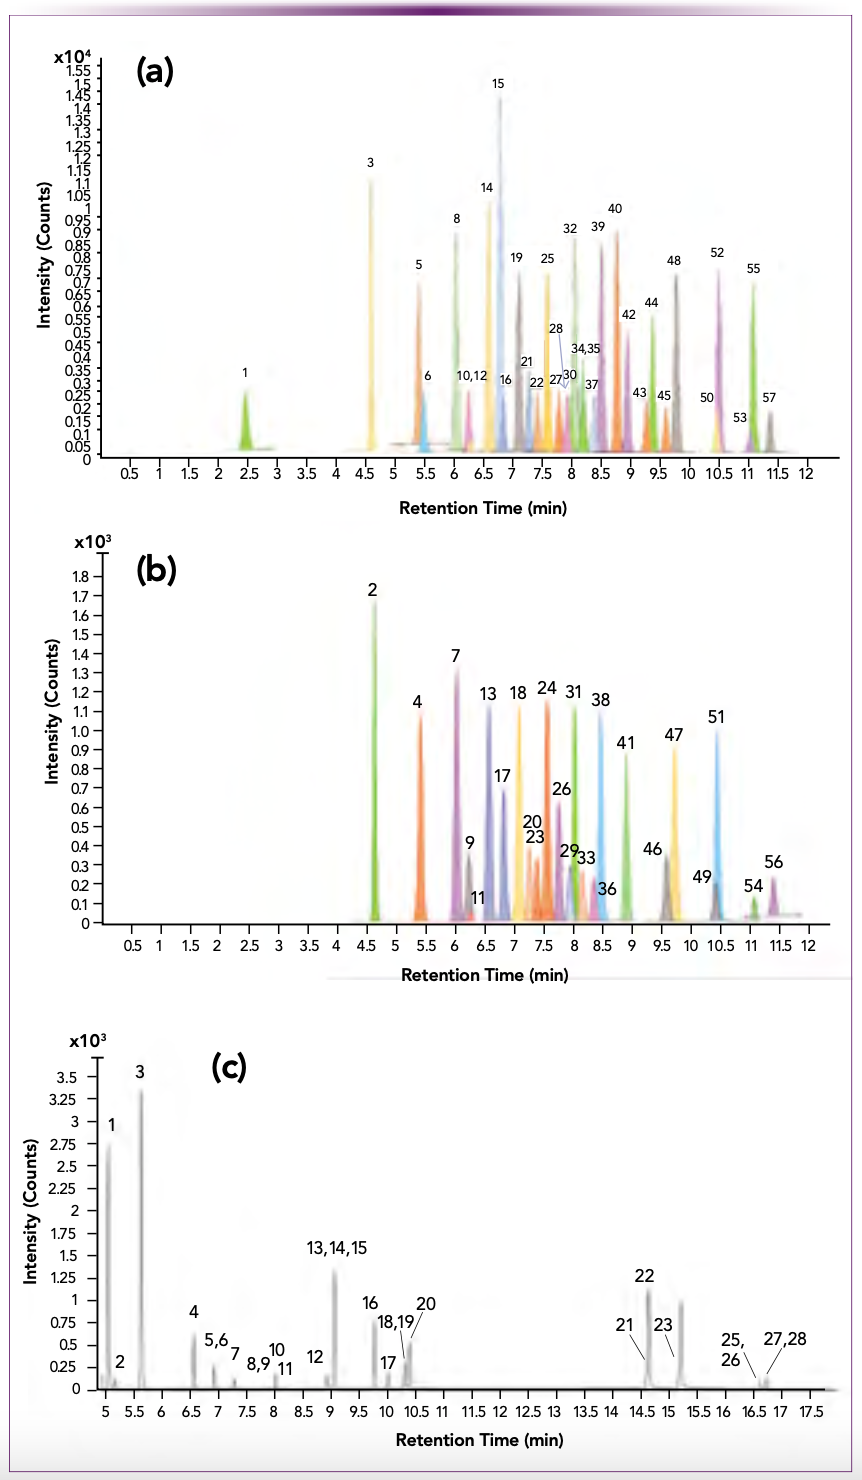
Typical MRM chromatograms are displayed in Figure 2. Chromatograms for the 33 LC–MS/MS target analytes (Figure 2a) are displayed separately from the 24 stable isotope surrogates (Figure 2b) to better show the distribution of the surrogates amongst the analytes. The number aside each peak corresponds to the analyte numbering system in Tables Ia and Ib. Chromatograms for the 20 GC–MS/MS target analytes and 8 surrogates are displayed together in Figure 2c. The numbers aside each peak correspond to the analyte numbering system in Table Ib. Note that the neutral PFAS analytes N-MeFOSA and N-EtFOSA are analyzed by both GC–MS/MS and LC–MS/MS, but FOSA (PFOSA) is analyzed by LC–MS/MS.
FIGURE 2: LC–MS/MS and GC–MS/MS chromatograms. (a) LC– MS/MS target analyte chromatograms, (b) LC–MS/MS surrogate chromatograms, and (c) GC–MS/MS analyte and surrogate chromatograms.
Method Quantification
Target PFAS analytes were quantified by external calibration. Calibration curves for LC–MS/MS analytes were generated at 2, 19, 50, 200, 1000, and 5000 pg/L and for GC–MS/MS at 25, 50, 100, 250, 500, 1000, 2000, 5000, 20,000, and 50,000 pg/L. All linear regression points differed by less than 20% from known value. The limit of quantification was calculated as the smallest concentration of the standard on the calibration curve that could be accurately measured within ±20% of its theoretical value at a signal-to-noise ratio of 10 or greater. To verify the stability of the instrument, a mixed standard solution adjusted to 1000 pg/mL for LC–MS/MS and 5 ng/mL for GC–MS/MS was measured for each analysis batch. If the concentration of the mixed standard solution was not within ±20% of the corresponding theoretical value, a new calibration curve was prepared. The material blank (procedural blank) and material recovery (procedural recovery) were analyzed for every batch of samples. The target compounds can also be quantified by the internal standard method, and loss in the sampling and extraction processes can thereby be corrected to a limited extent. However, in the field sampling data presented below the results were not so corrected, owing to the limited number of commercially available isotopically labeled internal standards.
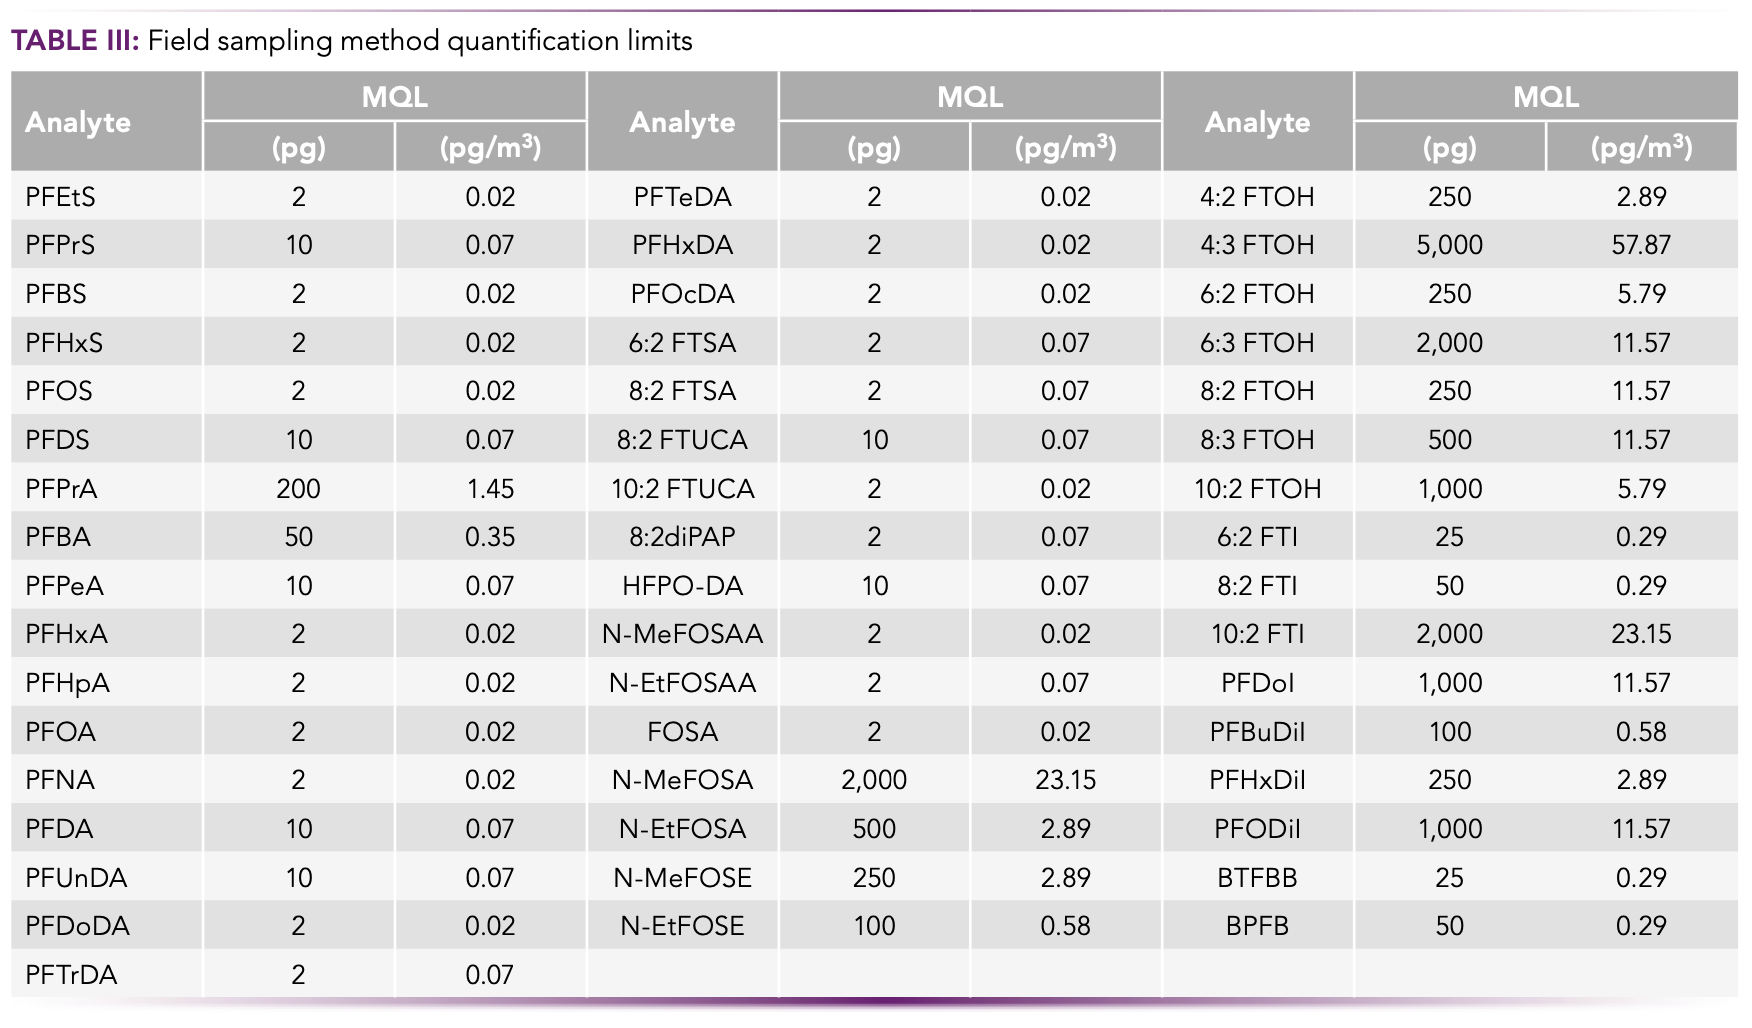
Method quantification limits (MQLs) were developed for all 49 target analytes. The MQLs in the blank test of each material and the measurement of real samples are presented in Table III. The MQLs from the blank tests are expressed as pg (total quantity). The MQLs from the field measurements are expressed as pg/m3 (volumetric mass), based upon a 72-h sampling event with the sampler operating at a flow rate of 20 L/min. Volumetric mass MQLs for the 48-h and 24-h sampling events are higher by factors of 2 and 3 respectively, owing to the reduced volume of air processed. The LC–MS/ MS field sampling MQLs were generated on an Agilent 1269 Infinity II LC interfaced with a Sciex Triple Quad 4500 MS/MS system and, for GC–MS/MS, on a Shimadzu GC–MS-TQ8050 system. Both LC–MS/MS and GC–MS/MS MQLs followed the analytical methodology and instrumentation parameters previously described in the Experimental section.
Sampling Method Performance Characterization
Material recovery tests were performed by directly spiking native and surrogate standards onto each sorption matrix to establish the efficiency of the analytical extraction process. Native analyte recoveries for most analytes and media were between 70% and 120%. Exceptions were the FTUCAs and FDIAs where recoveries ranged from 33% to 75% (average of 50%) with the longer chain analytes showing higher recoveries.
Media blank tests (n = 5) performed on pre-treated media showed no mean extractable quantities greater than 20 pg for most analytes with the exception of PFHxA in PUF and GAIAC (60 pg and 82 pg, respectively) and BPFB in GAIAC (51 pg).
Travel blank tests (n = 2) were performed with fully prepared FM4 samplers transported to the sampling site and returned to the laboratory without air collection. All field travel blanks were generally clean and showed analyte levels consistent with the media blanks. The only exception was 6:2 FTOH which was below the MQL in the media blank, but appeared in the travel blanks at a mean level of 73 pg in the GAIAC media, suggesting an external contamination source.
Finally, recovery tests were performed to evaluate the loss of target analytes during the field sampling process. A surrogate standard mixture was spiked directly onto the sampling media and ambient air was sampled for 24 h, 48 h, and 72 h (n = 6 for each). Recoveries were similar to the material recovery tests (70% to 120%), showing that PFAS retained by the media are not lost during the sampling process. The exceptions were the short chain PFCAs and FOSAs where recoveries ranged from 31% to 68% (average of 52%). These results are approximately 30% to 50% lower than in the material recovery tests, showing that such analytes could be partially lost during sampling and suggesting that field sampling results could be biased low. The longer chain PFDAs, however, did not exhibit reduced recovery. Although these recovery results were adequate for the scoping objectives of this study, future research studies using PFAS-fortified aerosol might be better served by quantifying specific analyte recoveries.
Field Sampling Results
Several field sampling events were conducted to evaluate the ability of the sampling device and the associated analytical protocol to characterize atmospheric PFAS composition. The sampling site was located in a mixed rural and residential area of Tsukuba city, Ibaraki Prefecture, Japan, approximately 35 miles northeast of Tokyo. There is no heavy industry in the immediate area and there are no known PFAS-contaminated sites nearby.
Sampling was conducted in a covered, open-air structure. Three FM4 samplers (n = 3) were operated simultaneously at a flow rate of 20 liters per min for a period of 24 h. The samplers were then shipped to the laboratory in Tsukuba city, where the sorption media were removed and analyzed per the prescribed protocol. Twenty- five days later, the same three samplers (cleaned and replenished) were returned to the Tsukuba sampling site and a duplicate 24-hour sampling and analytical event was conducted. Comparisons of the two 24-h sampling events are presented in Figure 3a and Figure 3b. The duplicate sampling and analytical procedures were then repeated as a 48-h event and finally as a 72-h event. However, only the results for the 24-h sampling events are presented here, as these data adequately illustrate the utility of procedure.
FIGURE 3: Comparison of the two 24-h sampling events. (a) PFAS analyses from the first sampling event (n = 3) with weather: southwest wind; mostly clear/sometimes foggy; 10 to 24 oC (16 oC average); (b) PFAS analyses from the second sampling event (n = 3) with weather: northwest wind; clear; -3 to 11 oC (3 oC average).
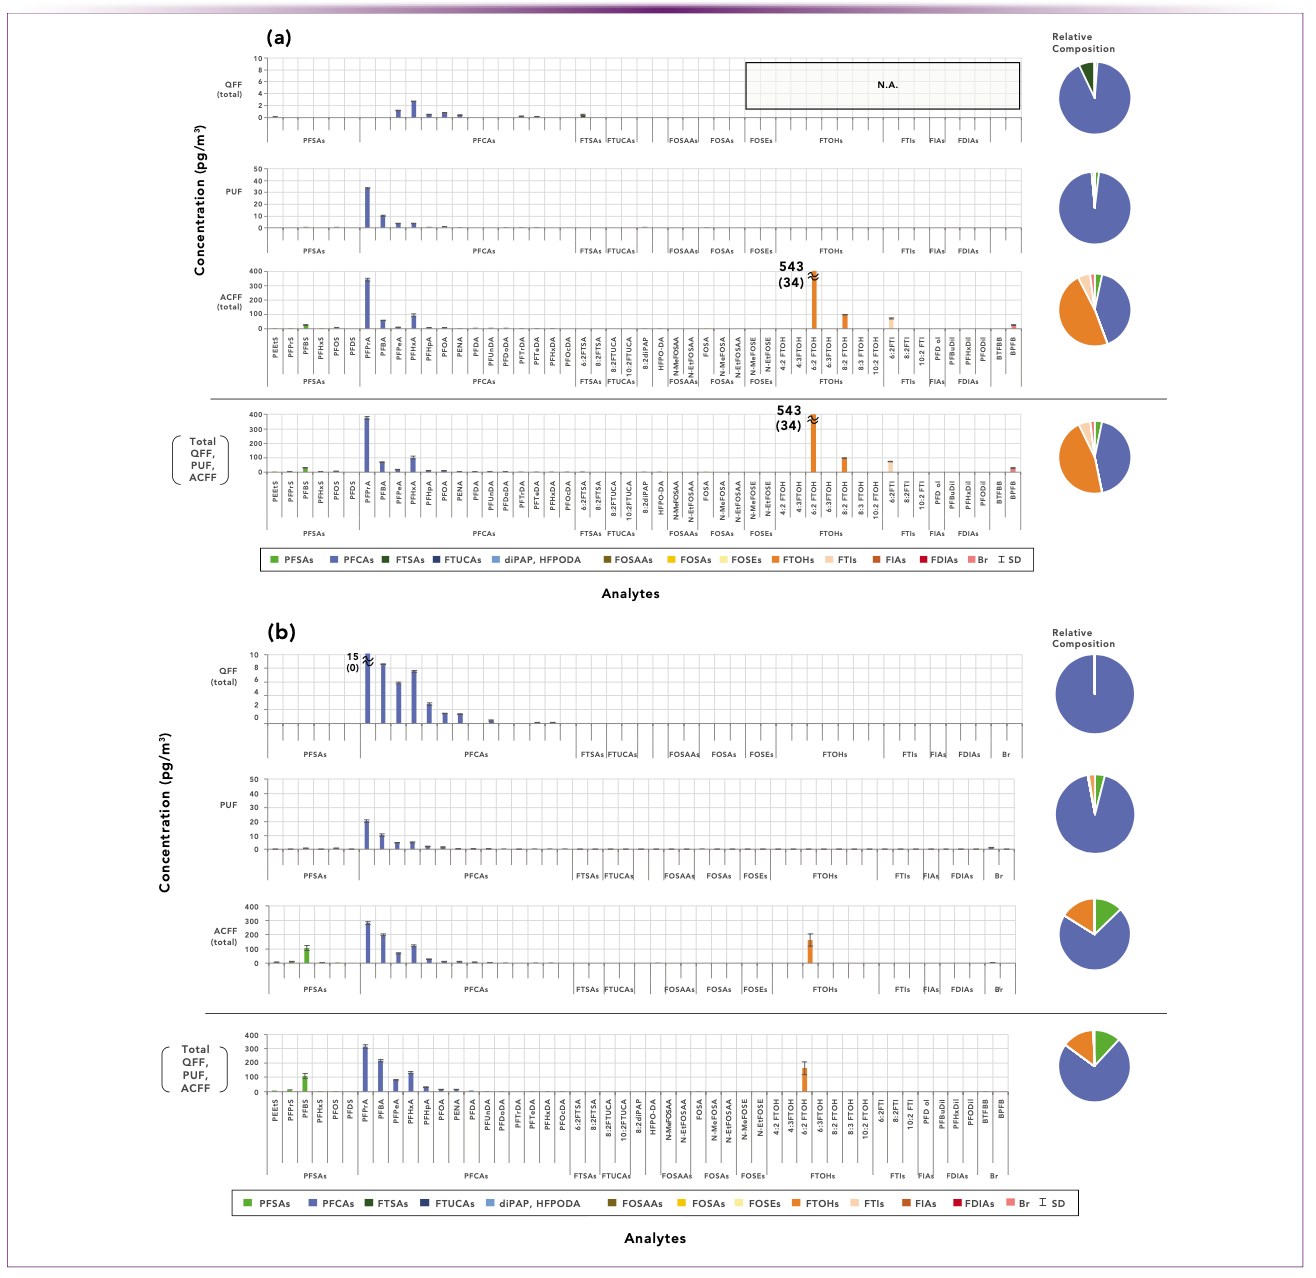
Note that the southwest wind direction on Day 1 (Figure 3a) placed the sampling site downwind from the highly populated and industrialized Tokyo-Yokohama area, whereas on Day 2 (Figure 3b), with a northwest wind, the site was downwind from the less urbanized Tochigi prefecture. A comparison of the colored composition wheels from the two sampling events, shows that the general atmospheric PFAS composition and specific PFAS concentrations from the two events were markedly different.
Examining the individual analyte concentrations, the atmospheric composition on Day 1 appears equally weighted toward fluorotelomer alcohols (FTOHs) and perfluorocarboxylic acids (PFCAs), whereas PFCAs predominate on Day 2. After removing the Day 1 contribution from 6:2 FTOH (a previously recognized travel blank contributor), the Day 1 data still show a much higher contribution from FTOHs, owing to the presence of 8:2 FTOH.
Also noticeable are the distinctly different PFCA patterns in the two sampling events. Day 2 shows a generally descending pattern of PFCA concentrations from short chain (PFPrA) to long chain (PFUnDA) in all media, whereas the Day 1 PFCA contribution predominantly comes from PFPrA in PUF and ACFF, but not in QFF. Additionally, the Day 2 descending PFCA pattern is quite pronounced on the QFF media wherein ionic PFAS are presumably sorbed on 1–10-micron particles. Surprisingly, no PFPrA was seen in the QFF media on Day 1, whereas it predominates the QFF results on Day 2. However, the descending pattern continues on the PUF and ACFF media suggesting that the bulk of the nonvolatile ionic PFAS are present in aerosol particles (less than 1 micron) which are partially entrained in the PUF media, but more fully captured by the ACFF.
Other compositional differences are noticed, such as the 3X higher level of PFBS and the 5X higher level of PFBA on Day 2. Also of interest is the presence of 8:2 FTOH on Day 1, which was undetected on Day 2, as well as the presence of 6:2 FTI, owing to the unusual chemical nature of this fluorotelomer analyte. One could continue to tease out differences from the two 24-h sampling events, but the primary conclusion is that two distinctively different atmospheric PFAS compositions were sampled.
The same can be said of the data from the 24-h and 72-h sampling events which are not presented here but which show equally intriguing differences. For example, the 72-h Day 2 event displays the same distinctive descending PFCA pattern seen in the 24-h Day 2 event. However, this pattern is completely absent in the other 72-h event and both 48-h events. In addition, compared with the 24-h event, PFCA concentrations in the 72-h events are 2–3 times higher in the PUF and ACFF fractions, suggesting that the particulate:aerosol ratios were significantly different for the two events.
Moreover, the 72-h Day 1 concentration of 8.2 FTOH (80 pg/m3) is quite similar to the 24-h Day 1 event but is 3–4X higher than the 72-h Day 2 event and for both 48-h events. Notably, HFPO-DA appears in both the 48-h Day 1 and Day 2 events at concentrations of 25 pg/m3 and 70 pg/m3, respectively, but was not observed at all in the 24-h and 72-h events. Finally, a visual comparison of all six color composition wheels shows that the 48-h Day 2 event sampled a distinctly different atmospheric PFAS composition compared to the other five events.
Changes in meteorological conditions (such as wind direction) and the potential contribution of transitory sources certainly played a role in the varying atmospheric PFAS analyte contributions and their measured concentrations. However, this study was not designed to definitively identify the causes of these variations; that should be the subject of further investigation. Rather, the primary purpose of this study was to demonstrate the variable complexity of atmospheric PFAS contamination and to highlight the utility of the multistage sampling and analytical approach for investigating potential sources, impacts and potential remediations.
Conclusions
This paper described the characterization and field testing of a multistage field sampling device combined with LC–MS/MS and GC–MS/MS analysis for the determination of 54 PFAS analytes in air at the low pc/m3 level. Field-testing experiments demonstrated the ability of the approach to quantitatively characterize local atmospheric PFAS composition and to differentiate the PFAS compositions from different sampling events. This sampling and analytical approach should have application for the investigation of airborne PFAS sources and transmission modes and for the evaluation of potential mitigation and remediation approaches.
Acknowledgments
The FM4 sampling module was developed by Futamura Chemical Co., Ltd. under a joint research agreement with National Insti- tute of Advanced Science and Technology (AIST). Part of this research was performed by the Environment Research and Technology Development Fund (1G-2102) of the Environmental Restoration and Conservation Agency of Japan.
References
(1) Brennan, N. M.; Evans, A.T.; Fritz, M. K.; et al. Trends in the Regulation of Per- and Polyfluoroalkyl Substances (PFAS): a Scoping Review. Int. J. Environ. Res. Public Health 2021, 18 (20), 10900. DOI: 10.3390/ijerph182010900
(2) United States Environmental Protection Agency. PFAS Strategic Roadmap: EPA’s Commitments to Action 2021-2024, October, 2021. https://www.epa.gov/system/files/documents/2021-10/pfas-roadmap_final-508.pdf (accessed 2023-03-19).
(3) Timshina, A. S.; Sobczak, W. J.; Griffin, E. K.; et al. Up in the Air: Polyfluoroalkyl Phosphate Esters (PAPs) in Airborne Dust Captured by Air Conditioning (AC) Filters. Chemosphere 2023, 325, 138307. DOI: 10.1016/j.chemosphere.2023.138307
(4) Johansson, J. H.; Salter, M. E.; Acosto Navarro, J. C.; et al. Global Transport of Perfluoroalkyl Acids via Sea Spray Aerosol. Environ. Sci. Process Impacts 2019, 21, 635–649, DOI: 10.1039/C8EM00525G
(5) Muir, D.; Bossi, R.; Carlsson, P.; et al. Levels and Trends of Poly- and Perfluoroalkyl Substances in the Arctic Environment - An Update. Emerging Contaminants 2019, 5, 240–271. DOI: 10.1016/j.emcon.2019.06.002
(6) Lin, H.; Lao, J; Wang, Q.; et. al. Per- and Polyfluoroalkyl Substances in the Atmosphere of Waste Management Infrastructures: Uncovering Secondary Fluorotelomer Alcohols, Particle Size Distribution, and Human Inhalation Exposure. Environ. Int. 2022, 167, 107434. DOI: 10.1016/j.envint.2022.107434
(7) Vasquez, K., Understudied Class of PFAS found in Healthcare Facilities. Chem. Eng. News 2022, 100 (44), 8. https://cen.acs.org/environment/persistent-pollutants/Understudied-class-PFAS-found-healthcare/100/web/2022/12
(8) United States Environmental Protection Agency. Other Test Method 45 (OTM-45) Measurement of Selected Per- and Polyfluorinated Alkyl Substances from Stationary Sources, January, 2021. https://www.epa.gov/sites/default/files/2021-01/ documents/otm_45 _semivolatile_pfas_1-13-21.pdf
(9) Wu R; Lin, H.; Yamashita, N; et al. Simultaneous Analysis of Neutral and Ionizable Per- and Polyfluoroalkyl Substances in Air. Chemosphere 2021, 280, 130607. DOI: 10.1016/j.chemosphere.2021.130607
(10) Technical Guide. FM4: Air Sampler for PFAS; GL Sciences, 2022.
Steve Suh is with GL Sciences, Inc. in Torrence, California. Reika Takahara, Manabu Takayanagi, Hiroshi Hayashida, and Zhonghua Shen are with GL Sciences, Inc. in Tokyo, Japan. David Kennedy is with David Kennedy and Associates, in Rio Verde, Arizona. Direct correspondence to: stevesuh@glsciencesinc.com

New Method Explored for the Detection of CECs in Crops Irrigated with Contaminated Water
April 30th 2025This new study presents a validated QuEChERS–LC-MS/MS method for detecting eight persistent, mobile, and toxic substances in escarole, tomatoes, and tomato leaves irrigated with contaminated water.
Accelerating Monoclonal Antibody Quality Control: The Role of LC–MS in Upstream Bioprocessing
This study highlights the promising potential of LC–MS as a powerful tool for mAb quality control within the context of upstream processing.
University of Tasmania Researchers Explore Haloacetic Acid Determiniation in Water with capLC–MS
April 29th 2025Haloacetic acid detection has become important when analyzing drinking and swimming pool water. University of Tasmania researchers have begun applying capillary liquid chromatography as a means of detecting these substances.
Prioritizing Non-Target Screening in LC–HRMS Environmental Sample Analysis
April 28th 2025When analyzing samples using liquid chromatography–high-resolution mass spectrometry, there are various ways the processes can be improved. Researchers created new methods for prioritizing these strategies.

.png&w=3840&q=75)

.png&w=3840&q=75)


.png&w=3840&q=75)


.png&w=3840&q=75)


