Dealing with Wandering First-Dimension Peaks in 2D-LC Separations
The retention of large molecules, such as peptides and proteins, is strongly dependent on mobile-phase composition and temperature. Consequently, the retention times (tR) of these molecules often fluctuate from one separation to the next. In two-dimensional liquid chromatography (2D-LC), this fluctuation can be challenging to deal with, especially if only one or a few specific peaks in the first dimension (1D) separation are targeted for further separation. In this instalment, we describe instrumental concepts that are useful for coping with this challenge.
In October of 2019, I invited Dr. Patrik Petersson to contribute an “LC Troubleshooting” article describing some tips and tricks for minimizing fluctuating first dimension (1D) retention times in two-dimensional liquid chromatography (2D-LC) separations of peptides. While all of the advice described in that instalment is still relevant, Dr. Petersson has subsequently worked with Dr. Stephan Buckenmaier to develop new instrumentation concepts that make it easier to cope with shifting first dimension retention times (tR). In this instalment, they demonstrate the utility of these concepts in the context of determining impurities in peptide materials using 2D-LC. —Dwight Stoll
Characterizing peptide products requires superior separation performance because of the complexity of these samples and the difficulties associated with separating related components such as isomers (1–3). Chromatography and mass spectrometry (MS) are powerful separation techniques individually, but coupling them strongly amplifies the performance of the analytical platform. Two-dimensional liquid chromatography (2D-LC) can enhance the separation further because the second dimension can improve upon any resolution that has been achieved in the first dimension, which works best if the selectivities employed in the two dimensions are complementary.
In our work on the characterization of related impurities in peptides, we focus on multiple heartcutting (MHC) 2D‑LC–MS workflows (3–6). With MHC, the link between the time scales of the two dimensions is decoupled because first dimension (1D) fractions can be stored while others are processed in the second dimension. Thus, both dimensions can be operated under optimal conditions. For example, MHC 2D-LC was employed to further separate 13 first-dimension fractions of a forcibly degraded insulin sample taken from a 1D reversed-phase separation that used a mobile phase containing a high concentration of salt. High ionic strength solvents are frequently used in the biopharmaceutical industry because they provide an alternative selectivity to trifluoroacetic acid (TFA)-based solvents, and can reduce column overloading effects often observed with ionizable compounds, thereby improving peak shape and resolution (3,7,8). The second dimension added to this one-dimensional (1D) method markedly improved the resolution. Because the second dimension was operated under MS-compatible conditions, it allowed for the determination of impurities by MS in real-time.
However, a general problem with LC separations of high-molecular-weight compounds such as peptides is that they are affected very strongly by small changes in chromatographic conditions, such as variations in the mobile-phase composition or temperature. Such fluctuations in tR lead to problems in heartcutting 2D-LC because the target 1D peak one tries to sample keeps moving. Moreover, this “wandering peak” problem can be more serious when using very shallow gradients, which are required to separate peptide impurities (5).
Another complication is that the widths of 1D peaks vary in these separations. A sole impurity peak might be relatively narrow while the main peak is typically overloaded and very broad (8). This occurrence means that for a given loop volume in the 2D-LC interface (40 µL), one cut could be enough to determine the purity of a narrow 1D peak, but multiple cuts have to be taken across a broad main peak, which can lead to a corresponding number of 2D cycles and therefore a lengthy overall 2D-LC analysis time.
In this instalment, two concepts are discussed that help address these challenges and thus further improve the usability and robustness of 2D-LC–MS for the analysis of related impurities in peptide products. First, an approach was introduced to cope with injection‑to‑injection variability in 1D retention times of peaks that are targeted for 2D separation. Data obtained from the analysis of forcibly degraded bovine insulin show that triggering sampling of the 1D separation using the observation of specific features in the online signal of the 1D detector can solve this “wandering peak” problem and correct time-based sampling events on the fly. Second, a procedure is introduced that injects multiple cuts (5 × 40 µL) from the 1D separation into the 2D column before a single 2D elution program elutes all of the injected material at once for a single 2D chromatogram. This “multi-inject” approach can significantly decrease the 2D-LC analysis time, and possibly increase the detection sensitivity of the method.
Results from Approach #1: Dynamic Compensation for Fluctuation of 1D Retention Time
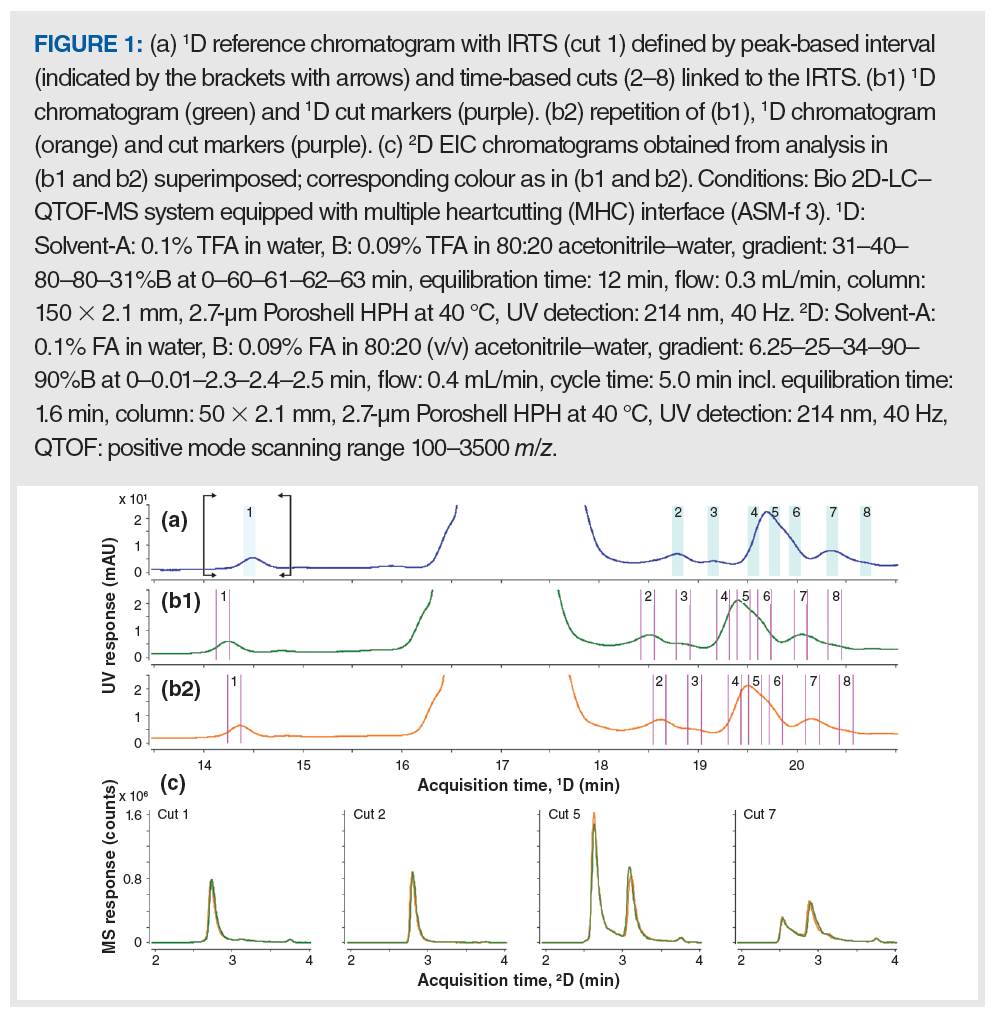
Demonstration of the Concept: Figures 1(a) and 1(b) show 1D chromatograms obtained from reversed‑phase separations of a forcibly degraded bovine insulin sample using a gradient from 31 to 40%B in 60 min (0.15% B/min). Such shallow gradients are often employed to separate related impurities in peptides and proteins, but are prone to retention shifts like those shown in Figure 1 (5). In MHC 2D-LC, sampling from the 1D separation occurs in relation to a previously collected 1D reference chromatogram. When using time-based sampling, cuts are made according to a table of events specified by the operator. The problem arises when the target 1D peak moves in a subsequent separation (relative to the reference chromatogram), and cuts are taken in the wrong spots. In the peak-based sampling mode, the decision to sample the 1D effluent is made whenever the 1D detector signal fulfils set criteria (signal threshold or slope), which is very useful to compensate for 1D tR variations, but it is sometimes not viable for analyzing peptide impurities because of high sample complexity and poor separation (3,5).
Here, we introduce the concept of dynamic peak parking (DPP), which aims to adjust time-based sampling events dynamically to compensate for fluctuations in 1D retention. Figure 1(a) shows the chromatogram used as the “reference” upon which sampling events are based, as defined in the 2D-LC method. The heartcuts are indicated by the highlights incorporating the cut numbers. To use DPP, a peak was selected as an internal retention time standard (IRTS), which is bracketed by an interval within which this compound was expected to be eluted in subsequent separations. Recognition of the IRTS peak, and sampling of cut 1, was triggered when the 1D detector reached the 4 mAU threshold. In the later part of this chromatogram, seven time-based cuts (cuts 2–8) were specified and linked to the IRTS. All of the timed events needed to make the seven cuts were adjusted “on the fly” by applying a time shift corresponding to the difference between the tR of the IRTS peak in the reference chromatogram, and the retention time observed live during the 2D-LC separation. A suitable IRTS should thus exhibit the same, or at least very similar, retention properties as those compounds linked to it. The IRTS selected here was a deamidation product of bovine insulin.
Figure 1(b) shows 1D chromatograms along with 1D cut markers (purple) that indicate where cuts were sampled in real time. These chromatograms were acquired on different days from that in panel A, which was the reference chromatogram used for the initial method setup. Figure b1 (green) shows the first analysis of the day, and Figure b2 (orange) shows a repetition.

The peaks in both chromatograms in Figure 1(b), in comparison to those in the chromatogram in Figure 1(a), are shifted to earlier retention times, but to different extents. The differences in retention were −0.25 and −0.14 min in panels b1 and b2, respectively. These values were detected for the IRTS and applied to the time-based cuts as is evident from the corresponding 1D cut markers. Without this compensation, the desired peak targets defined by time-based cuts would have been missed.
Figure 1(c) shows representative 2D chromatograms for cuts 1, 2, 5, and 7 obtained from the 1D separations in panels b1 (green trace) and b2 (orange trace). The near congruency of the 2D peaks indicates that each compound observed in the second dimension has been sampled at the same time with respect to its peak apex in the 1D, despite the significant shift in 1D tR.
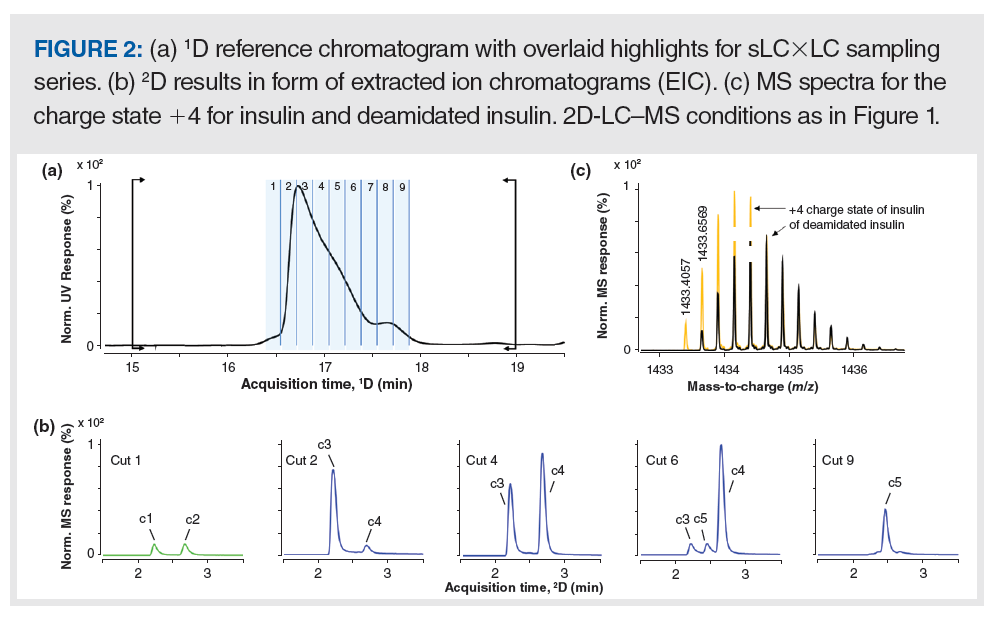
In-Depth Analysis of the Main Peak: In the selective comprehensive sampling mode of 2D-LC (sLC×LC, sometimes called HiRes sampling [9]) several adjacent fractions are taken from the 1D separation in contrast to heartcutting where isolated cuts are typically distributed across the 1D separation time. sLC×LC is a good technique to determine the purity of the main peak because the abundance of the main component relative to the impurities coeluted in the front or tail of the main peak is reduced; therefore, the likelihood of resolution in the 2D separation is increased (10). Here, sLC×LC separations were carried out with peak-based triggering.

Figure 2(a) shows a portion of a 1D reference chromatogram with nine cuts of the sLC×LC series sampling the entire band of the main peak for further separation in the second dimension. Figure 2(b) shows 2D chromatograms for cuts 1, 2, 4, 6, and 9 in the form of extracted ion chromatograms (EIC) obtained by summing the isotopic peaks of insulin, taking into account the charge states from +3 to +6. Figure 2(c) shows spectra for the charge state +4 of the bovine insulin and a corresponding deamidation product superimposed. The 1D peak profile in panel a suggested at least three components under the main peak as indicated by shoulders in the front and rear of the peak, which was confirmed by deconvoluted MS data (max. entropy algorithm) providing monoisotopic masses of 5729.6 Da (at the apex of the main peak), 5730.6 Da (at the rear), and 5658.6 Da (at the front). These monoisotopic masses were assigned to the intact bovine insulin, a deamidation product, and a loss of alanine at the C-terminus of the b-chain, respectively. In the second dimension, five compounds (c1 to c5 in Figure 2[b]) were found. Compound c1 was identified as insulin-Ala, c2 was a corresponding deamidation product of c1, c3 was the intact insulin, and c4 and c5 were two deamidation products of insulin. This process demonstrates the importance of the improved chromatographic separation provided by the second dimension. Isobars cannot be distinguished by MS, and it is also not trivial to discriminate the intact molecules from corresponding deamidation products when these enter the MS system at the same time (that is, when coelution occurs in the LC separation) because the second isotope of the intact mass approximately coincides with the monoisotopic mass of the deamidated species, as shown in Figure 2(c). On the other hand, c1 and c3, and c2 and c4 would have been coeluted in the second dimension if not already separated in the first dimension, and the abundances of c1 and c2 were low in cut 2. Even so, the high resolution quadrupole time-of-flight (QTOF) data facilitated their separation by extracting the corresponding masses. Thus, the combination of the two separation techniques (2D-LC and MS) is invaluable for the full characterization of the impurities in this sample.
Results from Approach #2: “sLC×LC Multi-Inject” and Peak-Based Sampling Help Handle Wandering 1D Peaks and Reduce Overall 2D-LC Analysis Time
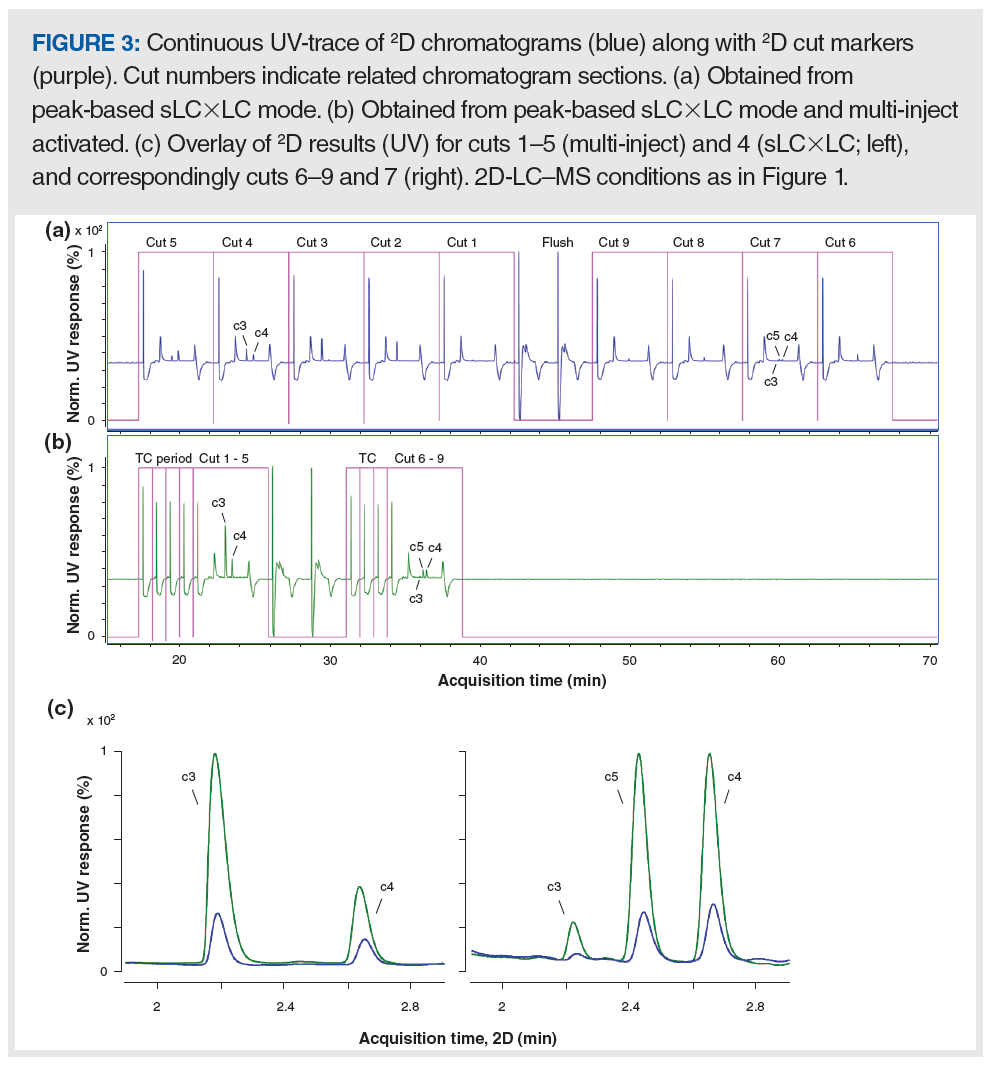
The “multi-inject” concept allows one to flexibly set the volume sampled from the 1D separation without the need for instrument hardware modifications (11), and it can be used to save time and improve detection sensitivity in 2D-LC experiments. Figure 3 shows the continuous string of 2D-UV chromatograms along with 2D cut markers (purple trace, which denotes the start and end times for each 2D separation) obtained for the series of nine cuts taken from the 1D separation shown in Figure 2(a). Figure 3(a) shows results from standard sLC×LC operation, whereas Figure 3(b) shows the results obtained when the “multi-inject” mode was used. In standard sLC×LC mode, the second dimension runs through nine consecutive 2D cycles, and the last 2D separation is complete at approximately 68 min. In “multi-inject” mode, the full content of each MHC deck (that is, five loops in deck A, or four loops in deck B) is first transferred to the 2D column (marked in Figure 3[b] with TC [transfer-to-column]) before all of the analyte is transferred from one deck and is retained by the 2D column before it is eluted within a single 2D elution cycle. In this case, the deck valves were fitted with multiple 40 µL sampling loops. Thus, when “multi-inject” is used, any 1D peak volume between 40–200 µL can be sampled from the 1D, and the content of each deck is eluted all at one time from the second dimension without replumbing the instrument hardware. The 2D cut markers show that the total 2D-LC analysis time was markedly reduced from 68 to 39 min when using the “multi-inject” approach. The 200 µL (cuts 1–5) and 160 µL (cuts 6–9) injection volumes by far exceeded the void volume of the 2D column used here (approximately 100 µL), thus the 1D effluent (1D mobile phase sampled containing the compounds of interest) temporarily acts as the 2D mobile phase upon transfer to the 2D column. In some cases, this phenomenon can seriously compromise the quality of the 2D separation. Thus, from a chromatographic performance point of view, it is important that the compounds analyzed are focused at the 2D column inlet. To support this, active solvent modulation (ASM) was used in this work, with an ASM-f of 3. Readers interested in the function of ASM are referred to a prior publication (4).

Figure 3(c) shows an overlay of cuts 1–5 and 4 obtained, respectively, using the “multi-inject” (green trace) or standard sLC×LC (blue trace) approaches (left panel), and similarly, cuts 6–9 were obtained using the “multi-inject” approach, while cut 7 was obtained using the “standard sLC×LC” approach (right panel). The green traces ameliorate any concerns about the effect of such large injection volumes on the 2D separation because the peak shape and resolution are very good. Indeed, similar peak shapes were obtained in both experiments, with a maximum increase in peak width of approximately 10% when using “multi‑inject” compared to sLC×LC. Excellent agreement was observed with respect to peak area. For multi-inject compared to sLC×LC (summing all areas obtained per compound, which in sLC×LC includes all nine 2D cycles, and in multi-inject just two 2D cycles), 99.1%, 100.9%, and 100.8% were calculated for peaks c3, c5, and c4, respectively.
Here, the “multi-inject” approach successfully reduced the 2D-LC analysis time by approximately 30 min (the 1D can be shortened accordingly, flushing out anything still retained in the 1D column after sampling of the main peak is complete). The degree of time savings becomes even more significant when longer 2D cycle times are used. It is not unusual to use more than 30 min per 2D cycle in experiments aiming for the separation of isomers of peptide and protein-related impurities.
Summary
In heartcutting 2D-LC analyses, fluctuations in the retention times of peaks of interest in the 1D separation lead to failed 2D-LC separations if time-based sampling is used and the target peak moves outside of the sampling window. One solution to this is to use peak-based triggering where sampling starts and ends based on features in the 1D detector signal; however, this approach is not always useful for complex samples that produce crowded 1D chromatograms. A new approach, described here, involves dynamic adjustment of time-based sampling events based on the evolution of the 1D chromatogram in real time relative to a reference chromatogram. sLC×LC, in conjunction with the “multi-inject” approach and peak-based sampling, provides a means to deal with fluctuating 1D retention, enables large sampling volumes, and facilitates reduction of the total 2D-LC analysis time by reducing the number of 2D cycles used to elute all of the analyte injected into the second dimension. These approaches are powerful tools that can further improve the robustness of 2D-LC methods, especially when employed in the analysis of biopharmaceuticals because the retention of these molecules is often sensitive to small changes in elution conditions.
References
- J. De Vos, D. Stoll, S. Buckenmaier, S. Eeltink, and J.P. Grinias, Anal. Sci. Adv. 2, 171–192 (2021). https://doi.org/10.1002/ansa.202100007.
- D.R. Stoll, D.C. Harmes, J. Danforth, E. Wagner-Rousset, D. Guillarme, S. Fekete, and A. Beck, Anal. Chem. 87, 8307–8315 (2015). https://doi.org/10.1021/acs.analchem.5b01578.
- P. Petersson, K. Haselmann, and S. Buckenmaier, J. Chromatogr. A 1468, 95–101 (2016). https://doi.org/10.1016/j.chroma.2016.09.023.
- D.R. Stoll, K. Shoykhet, P. Petersson, and S. Buckenmaier, Anal. Chem. 89, 9260–9267 (2017). https://doi.org/10.1021/acs.analchem.7b02046.
- P. Petersson, LCGC Europe 32(10), 536–542 (2019).
- S.M.C. Buckenmaier, U. Freisler, J. Trafkowski, K. Shoykhet, K.E. Witt, and M.M. Dittmann, Chromatography Today 20–26 (2015).
- J.K. Field, M.R. Euerby, K.F. Haselmann, and P. Petersson, J. Chromatogr. A 1641, 461986 (2021). https://doi.org/10.1016/j.chroma.2021.461986.
- M.M. Fallas, S.M.C. Buckenmaier, and D.V. McCalley, J. Chromatogr. A 1235, 49–59 (2012). https://doi.org/10.1016/j.chroma.2012.02.027.
- S.R. Groskreutz, M.M. Swenson, L.B. Secor, and D.R. Stoll, J. Chromatogr. A 1228, 31–40 (2012). https://doi.org/10.1016/j.chroma.2011.06.035.
- C.J. Venkatramani, J. Girotti, L. Wigman, and N. Chetwyn, J. Sep. Sci. 37, 3214–3225 (2014). https://doi.org/10.1002/jssc.201400590.
- S.W. Simpkins, J.W. Bedard, S.R. Groskreutz, M.M. Swenson, T.E. Liskutin, and D.R. Stoll, J. Chromatogr. A 1217, 7648–7660 (2010). https://doi.org/10.1016/j.chroma.2010.09.023.
About The Co-Authors
Stephan Buckenmaier is Principal Research Scientist in the Liquid Phase Separation Division of Agilent Technologies in Waldbronn, Germany.
Patrik Petersson is Principal Scientist at Novo Nordisk in Copenhagen, Denmark.
About The Column Editor
Dwight R. Stoll is the editor of “LC Troubleshooting”. Stoll is a professor and the co-chair of chemistry at Gustavus Adolphus College in St. Peter, Minnesota, USA. His primary research focus is on the development of 2D-LC for both targeted and untargeted analyses. He has authored or coauthored more than 75 peer-reviewed publications and four book chapters in separation science. Direct correspondence to: amatheson@mjhlifesciences.com

New Method Explored for the Detection of CECs in Crops Irrigated with Contaminated Water
April 30th 2025This new study presents a validated QuEChERS–LC-MS/MS method for detecting eight persistent, mobile, and toxic substances in escarole, tomatoes, and tomato leaves irrigated with contaminated water.

.png&w=3840&q=75)

.png&w=3840&q=75)


.png&w=3840&q=75)


.png&w=3840&q=75)


