Where Has My Efficiency Gone? Impacts of Extracolumn Peak Broadening on Performance, Part 2: Sample Injection
Dispersion of analyte peaks outside of chromatography columns can seriously erode the resolution provided by good columns. Here, we focus on the contribution of the sample injection step to the total level of extracolumn dispersion in an LC system.
In last month’s instalment of “LC Troubleshooting” (1), we reviewed the basic concepts of extracolumn dispersion (ECD), and how the level of ECD associated with a particular instrument can impact the apparent quality of a separation (for example, as measured by resolution). We emphasized the point that smaller (that is, shorter and narrower) columns packed with smaller particles are more sensitive to the effects of ECD than larger columns packed with larger particles. We discussed ECD in an aggregate sense, without getting into details about the level of ECD that different liquid chromatography (LC) system components contribute to the total peak variance observed at the detector (σ2observed). After all, it is the total observed variance that directly affects the resolution of adjacent peaks in a chromatogram.
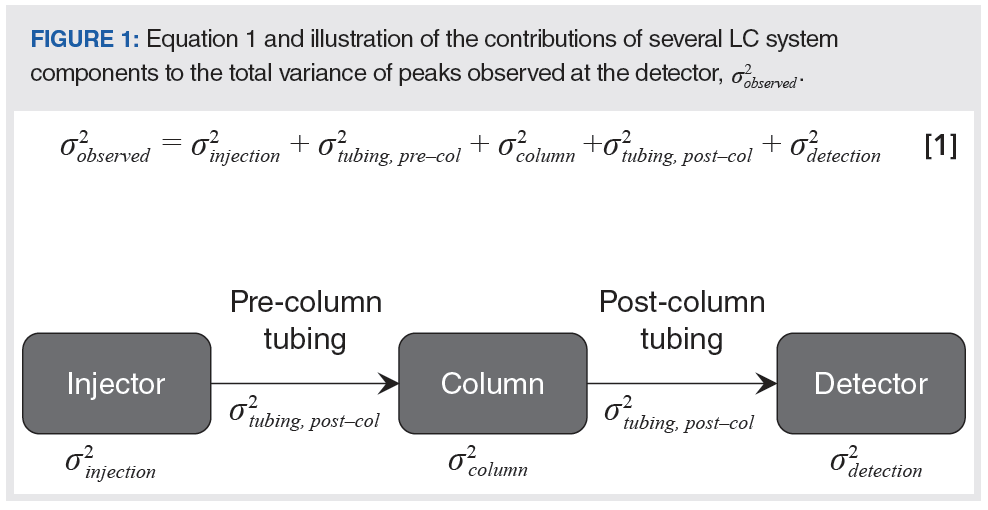
In this month’s instalment, we begin to discuss in detail the contributions to the total observed variance made by specific system components. Figure 1 illustrates the contributions of different system components to the total observed variance, starting with the injection step and ending with the detection step. In principle, the total observed peak variance is simply the sum of the variances contributed by each of the system components. This is only rigorously correct if the dispersion in each element of the system is independent of the others (2), but, under most conditions, equation 1, shown in Figure 1, is accurate enough to guide method development and system optimization (3).
In this instalment of “LC Troubleshooting”, we start by focusing on the variance associated with the injection of the sample into the mobile phase stream, and eventually the column.
Different Approaches to Injection in Modern LC
A detailed overview of the operational principles of different types of high performance liquid chromatography (HPLC) autosamplers was given recently by Steiner and associates in this magazine (4). In this article, we are mainly focusing on the extracolumn contributions to total peak variance associated with different injection approaches. Drawings of the two injector designs most commonly used in modern LC instruments are shown in Figure 2. In the so‑called fixed-loop approach (panels a and b), sample is drawn from a vial by an automated syringe and subsequently transferred to a sample loop, in either a pushed loop mode, as illustrated in Figures 2(a) and 2(b), or pulled through the needle directly into the sample loop (pulled loop design) (4). During the sample loading (“load” position), the desired sample is first drawn into the syringe. The loop—drawn in yellow in Figure 2—is at this point also not in the mobile phase flow path from the pump to the column. After fluidically connecting the syringe to the loop, the desired sample volume is pushed out of the syringe into the loop. Then, the valve is switched to the “inject” position; at this point, the sample that had been loaded into the loop is displaced from the loop into the column where sample components can be separated.
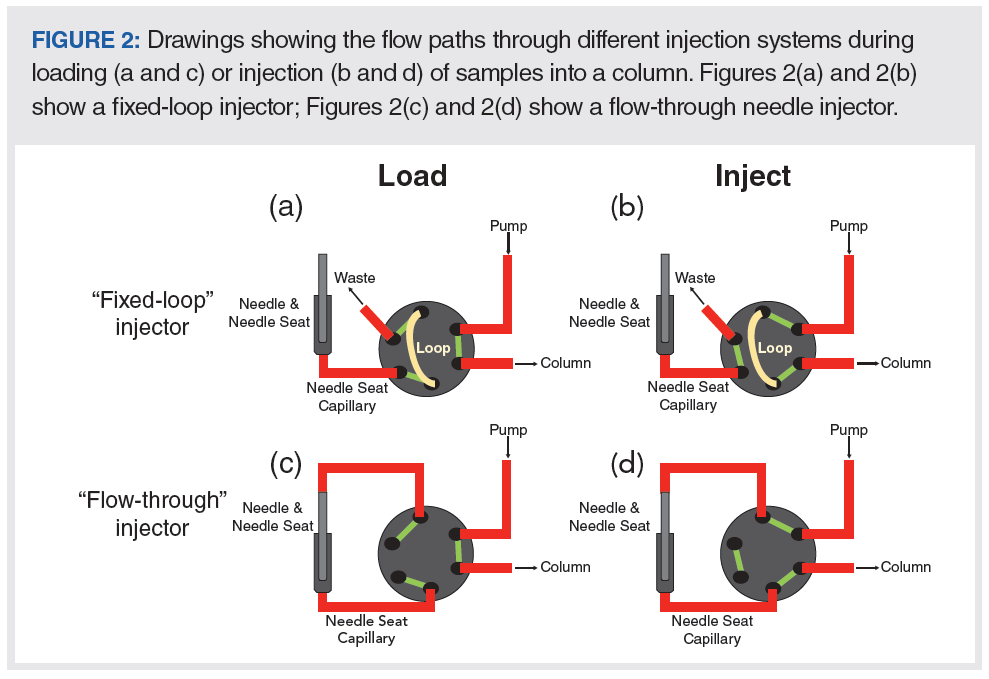
In the so-called flow-through approach shown in Figures 2(c) and 2(d), also known as split-loop design (4), the mobile-phase flow path bypasses the injector needle in the “load” position, allowing the sample to be drawn from a vial into the needle using an automated syringe. Once the desired volume of sample has been drawn into the needle, the valve is switched to the “inject” position. This connects the needle to the mobile-phase flow path, pushing the sample through the needle seat capillary and into the column.
Each of these approaches has advantages and disadvantages compared to the other. One of the primary advantages of the fixed-loop approach is that there is the potential to decrease the variance associated with the injection step (σ2injection) if a small loop is used. A significant downside to this approach is that the injection volume is fixed, as the name suggests. Significantly changing the injection volume requires a physical change of the capillary used as the loop. It is possible to use partial filling of the loop, which does help to extend the practically useful range of injection volumes available with a fixed‑loop. Conversely, one of the primary advantages of the flow through approach is that the injection volume can be changed over a wide range of volumes under software control, without changing any instrument components. However, this comes at the cost of increased ECD, since the flow path between the sample and the column includes a needle seat capillary that simply is not required in the fixed‑loop approach. Some instrument vendors provide “low‑dispersion” kits where this needle seat capillary has a lower inner diameter to reduce ECD, or have changed their instrument design such that the needle is integrated directly onto the injection valve, eliminating this capillary entirely.
We note here that in two‑dimensional liquid chromatography (2D-LC) separations, the interface that delivers fractions of first dimension (1D) effluent to the second dimension (2D) column for further separation is most similar to the fixed-loop injector shown in Figure 2. In this case, fixed-loops are used, and typically the interface valve has two positions that enable injection of sample from one loop into the 2D column while a second loop is filled with 1D effluent in parallel. The major difference with 2D-LC compared to the diagram in Figure 2 is that the sample loop is filled naturally as mobile phase flows out of the 1D column, rather than filling the loop with a syringe. Typically, the loops used in 2D-LC are much larger (for example, 40 to 80 µL) than those used in fixed-loop injectors for 1D-LC (typically less than 10 µL in ultrahigh-pressure liquid chromatography [UHPLC] systems).
Contributions of Injection Parameters to Peak Dispersion
In the simplest case of a fixed-loop injector with: 1) no seat capillary; and 2) an overfilled loop such that the distribution of sample inside the loop is homogeneous, the introduction of the sample into the mobile phase stream is conceptually close to introduction of a rectangular “sample plug”. For a truly rectangular plug, the contribution of the injection step to the observed peak variance (in volume units) would be given by equation 2:

where Vinjection is the volume of the sample loop itself (5). In practice, however, we observe variances that are usually much larger than those predicted by equation 2. A more general form of this expression replaces the factor 1/12 with 1/θinjection, and forms equation 3:

For fixed-loop injectors operated in the full-loop mode, values of θ injection= 4–8 are observed in practice. The situation with flow‑through injectors is a bit more complicated due to the addition of the needle seat capillary in the flow path between the sample to be injected and the column. Recent work has shown that two distinct factors contribute to the total variance contributed by the injection process for flow-through injectors—a factor related to the physical volume of the injected sample, as in equation 3, and a factor related to hydrodynamic dispersion of the sample due to parabolic flow in the needle seat capillary (6). These contributions to the total injection variance can be expressed using equation 4:

where the σ2v, hydrodynamic term accounts for hydrodynamic dispersion in the needle seat capillary.
Careful measurements of σ 2v, injection made using a flow-through injector over a range of conditions show that for injection volumes less than about 2 µL, θ injection is about 1 (6). In the range 2 < V injection< 10 µL, θ injection increases roughly linearly with increasing V injection, and then appears to plateau at a value of θ injection~ 8 for V injection > 10 µL.
The hydrodynamic component of the variance is related to the dimensions of the seat capillary, as well as the properties of the mobile phase and the molecular weight analyte through their effects on the diffusion coefficient of the analyte, as shown by equation 5:

where Lseat and dseat are the length and diameter of the seat capillary, F is the flow rate, and Dm is the diffusion coefficient of the analyte in the sample solvent. This equation shows why it is beneficial to reduce the length and diameter of the needle seat capillary in cases where reducing ECD is desired to avoid robbing a very good column of its inherent efficiency. Readers interested in learning about these relationships in more detail are referred to recent literature on the topic (2,6).
The Sample Solvent Matters, Too: The relationships in the preceding section provide relatively straightforward means to estimate the contribution of the injection step to the total, observed peak variance. However, up to this point in our discussion, we’ve made two important assumptions that are required for these expressions to accurately reflect what happens in a real system: 1) the separation is isocratic; and 2) the sample solvent is nominally identical to the mobile phase into which it is injected. When gradient elution is used, the situation changes substantially; this is one of the topics we will address in next month’s instalment of “LC Troubleshooting”.
Of course, in real applications it is frequently unrealistic, or highly undesirable, to go to the trouble of matching the sample solvent to the mobile-phase composition, so it is important to acknowledge that the contribution of the injection step to the overall ECD of a system may be larger or smaller than that estimated, using equations 3 and 4 above in cases where the sample solvent is very different from the mobile-phase composition. In previous instalments of “LC Troubleshooting”, we have addressed the sample solvent issues in some detail, but there has also been quite a bit of research published on this topic over the last few years. Figure 3 shows an example of how simply inverting the ratio of organic solvent to water in the sample solvent can have a dramatic effect on a separation, making the difference between a chromatogram that looks quite nice and useful, and a chromatogram that is effectively useless (7). This example shows the effect on a reversed-phase separation; however similar effects can occur for most modes of LC separation, including hydrophilic interaction chromatography (HILIC) (8).
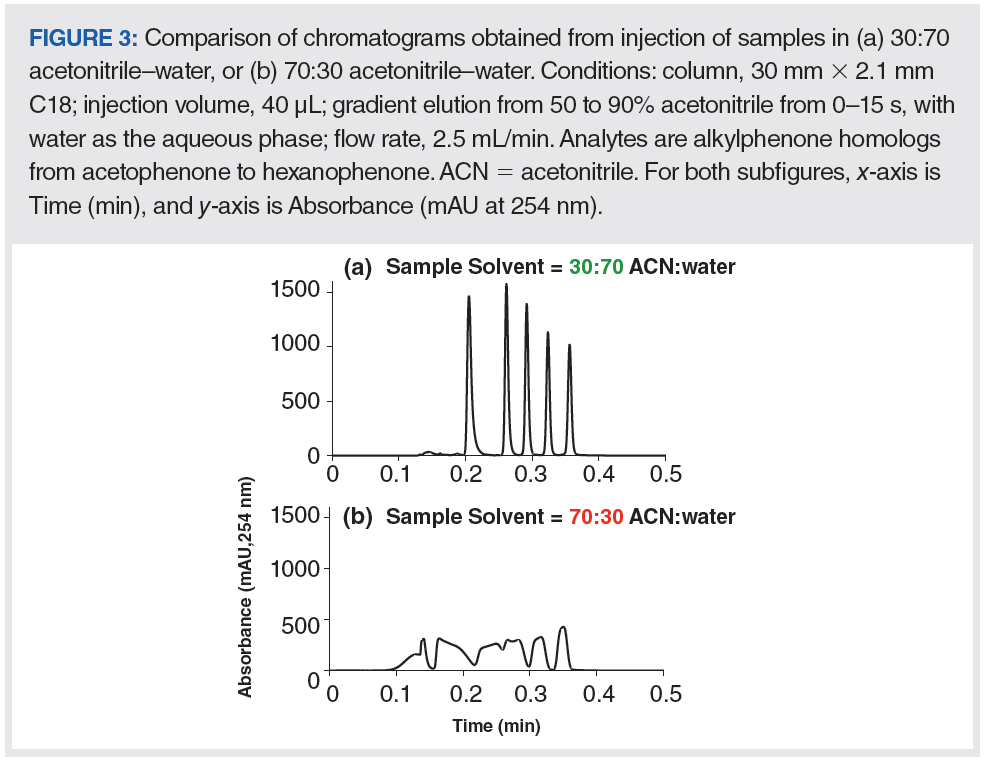
In recent years, several groups, including our own, have worked to develop simulations that can predict both the negative and positive effects of a mismatch between the sample solvent and the mobile phase. The published approaches for these simulations range from very detailed models that yield considerable insight into the origins of poor peak shapes, such as those observed in Figure 3(b), to simpler approaches that are not quite as accurate, but are computationally much less intensive and can be calculated using a spreadsheet (9–12). The most recent of these articles by Pepermans and associates provided a very useful rule of thumb to help users anticipate whether or not they will encounter an effect like that shown in Figure 3; this guideline is expressed as equation 6:

where Vm is the column dead volume, and ks is the retention factor of the analyte in the sample solvent (12). Specifically, equation 6 predicts that when this inequality is true, that distortion of the analyte peak will be so severe that part of the analyte will migrate all of the way through the column in the sample solvent, and breakthrough as a peak detected at the column dead time; most of the rest of the analyte will elute at the expected time based on its retention factor in the mobile phase. For example, for a column with a dead volume of 100 µL, if a sample solvent is used such that the analyte would have a retention factor of 0.5 if the sample solvent were used as the mobile phase, then a breakthrough peak will be observed at the column dead time for injection volumes larger than 50 µL. While equation 6 is very useful as a guide to avoiding problems of this kind, its use does require knowledge of the dependence of analyte retention on solvent composition; this is also true of the more detailed simulations described to date.
If the sample is dissolved in a mobile phase which has a higher elution strength than the initial mobile phase, the effect of this solvent mismatch can be mitigated by drawing mobile phase plugs with lower elution strength before or after the sample plug into the needle. Mixing of these weak solvent plugs with the sample solvent in the precolumn tubing and the column inlet causes the analyte bands to be compressed at the head of the column. This method is called “Performance Optimizing Injection Sequence” (13) and is based on the sandwich injection approach that was introduced to prevent sample precipitation in connecting tubing in polymer analysis (14). This technique was reported to be most useful for compounds in the range of 0.4 < k < 8, with the most benefit realized in the range 0.4 < k < 3 (13). Even if the sample solvent matches the initial mobile phase, this technique can significantly reduce contributions of σ 2injection and σ 2tubing, pre-col contributions to ECB (3). This technique can readily be applied with modern flow-through injectors using a injection program and an additional sample vial containing the weak solvent (3,13).
Summary
In this instalment of “LC Troubleshooting”, we have discussed in some detail the impacts of injector design and configuration, as well as sample composition, on the contribution of the sample-injection step to the overall ECD observed in a LC system. Understanding and estimating these effects can help us avoid situations where ECD seriously erodes the inherently high separation efficiency of a good column. In next month’s instalment, we will focus on the contributions to ECD from other system components, including connecting tubing and detectors, and discuss differences in the impact of ECD on resolution when using either isocratic or gradient elution.
References
- D. Stoll and K. Broeckhoven, LCGC Europe 34(5), 181–188 (2021).
- G. Desmet and K. Broeckhoven, TrAC Trends Anal. Chem. 119, 115619 (2019). https://doi.org/10.1016/j.trac.2019.115619
- K. Vanderlinden, K. Broeckhoven, Y. Vanderheyden, and G. Desmet, J. Chromatogr. A 1442, 73–82 (2016). https://doi.org/10.1016/j.chroma.2016.03.016
- C. Paul, F. Steiner, and M. Dong, LCGC North Am. 37(8), 514–529 (2019).
- J. Sternberg, in Advances in Chromatography (Marcel Dekker, New York, New York, USA, 1966), pp. 205–270.
- K. Broeckhoven, K. Vanderlinden, D. Guillarme, and G. Desmet, J. Chromatogr. A 1535, 44–54 (2018). https://doi.org/10.1016/j.chroma.2017.12.032
- D.R. Stoll, LCGC Europe 31(11), 608–613 (2018).
- D.R. Stoll, LCGC North Am. 37(1), 18–23 (2019).
- L.N. Jeong, R. Sajulga, S.G. Forte, D.R. Stoll, and S.C. Rutan, J. Chromatogr. A 1457, 41–49 (2016). https://doi.org/10.1016/j.chroma.2016.06.016
- D.R. Stoll, R.W. Sajulga, B.N. Voigt, E.J. Larson, L.N. Jeong, and S.C. Rutan, J. Chromatogr. A 1523, 162–172 (2017). https://doi.org/10.1016/j.chroma.2017.07.041
- F. Gritti, M. Gilar, and J. Hill, J. Chromatogr. A 1608, 460414 (2019). https://doi.org/10.1016/j.chroma.2019.460414
- V. Pepermans, S. Chapel, S. Heinisch, and G. Desmet, J. Chromatogr. A 1643, 462078 (2021). https://doi.org/10.1016/j.chroma.2021.462078
- C.A. Sanchez, J. Anspach, and T. Farkas, J. Chromatogr. A 1228, 338–348 (2012). https://doi.org/10.1016/j.chroma.2012.01.038
- Y. Mengerink, R. Peters, M. Kerkhoff, J. Hellenbrand, H. Omloo, J. Andrien, M. Vestjens, and S. van der Wal, J. Chromatogr. A 876, 37–50 (2000). https://doi.org/10.1016/S0021-9673(00)00179-5
ABOUT THE AUTHOR
Ken Broeckhoven received his Ph.D. in 2010 from the Vrije Universiteit Brussel (VUB), in Brussels, Belgium. Following postdoctoral research at VUB and work as a visiting researcher in the separation processes laboratory at ETH Zurich in Switzerland, he became a research professor at VUB in 2012. He was subsequently promoted to assistant professor and then to his current position as an associate professor in 2017.
ABOUT THE COLUMN EDITOR
Dwight R. Stoll is the editor of “LC Troubleshooting”. Stoll is a professor and the co-chair of chemistry at Gustavus Adolphus College in St. Peter, Minnesota, USA. His primary research focus is on the development of 2D-LC for both targeted and untargeted analyses. He has authored or coauthored more than 75 peer-reviewed publications and four book chapters in separation science and more than 100 conference presentations. He is also a member of LCGC’s editorial advisory board. Direct correspondence to: amatheson@mjhlifesciences.com

Polysorbate Quantification and Degradation Analysis via LC and Charged Aerosol Detection
April 9th 2025Scientists from ThermoFisher Scientific published a review article in the Journal of Chromatography A that provided an overview of HPLC analysis using charged aerosol detection can help with polysorbate quantification.
Removing Double-Stranded RNA Impurities Using Chromatography
April 8th 2025Researchers from Agency for Science, Technology and Research in Singapore recently published a review article exploring how chromatography can be used to remove double-stranded RNA impurities during mRNA therapeutics production.


