What Are Options to Improve My Separation? Part III: Options to Consider to Improve Resolution of Complex Mixtures
Many high performance liquid chromatography (HPLC) users are confronted with questions about how to improve upon the performance of an existing or recently developed method. These days, we have many technological options to consider, but how do we choose one (or a few) to try? The variables that are most important for improving the separation of complex samples are quite different from those that are most convenient for improving the resolution of simpler samples. Considering these differences can help avoid wasting time and resources when trying to improve separation performance.
In the January 2023 installment of "LC Troubleshooting," I kicked off a series of articles aimed at addressing the general question, "How do I improve my separation?" Given the diversity of analytical challenges that are addressed using high performance liquid chromatography (HPLC), there are several variants of the general question. In the first part of the series (1), I reviewed some basic and foundational concepts that are relevant to these discussions. In Part II (2), I first discussed the idea of sample complexity, the likelihood of fully resolving samples with different approaches to improving resolution of simple mixtures (primarily thermodynamic adjustments), including changes to the mobile and stationary phases. In this third part in the series, I will address the other end of the spectrum, focusing on complex sample mixtures and options for improving resolution with these samples. As with the other parts of this series, building up knowledge of how different factors affect resolving power from a theoretical point of view, as well as what changes are possible within practical constraints, is powerful when we are confronted with a separation that needs to be improved, or when an existing separation is not performing as expected.
How Do We Define a "Complex Mixture"?
In Part II of this series, I defined a simple mixture as a sample containing less than five compounds, and a complex mixture as any sample containing more than 11 compounds. These numbers are somewhat arbitrary, but they at least give us a concrete basis for discussion, and we will continue with them here. Thus, the remainder of this installment is focused on considerations relevant to samples containing more than 100 compounds, but many of the ideas are also applicable to samples of intermediate complexity, in the range of 5 to 100 compounds in the sample.
What Are My Chances of Separating the Mixture I Have?
In Part II of this series, I wrote about how the statistical theory of peak overlap (SOT) developed by Davis and Giddings can be sample mixtures and options for improving used to quantify the likelihood of fully resolving simple mixtures (3). The same framework can be used to quantify the likelihood of separation for complex samples as well, but, in this case, the likelihood of fully resolving all the components of the sample is so low that it is not very informative, and we need a different performance metric to help us understand the impact of changes we might make. One option is to calculate the fraction (s/m) of all the components in the sample (m) that are observed in a chromatogram as singlet, or “pure” peaks (s) (that is, no coelution). The number of singlets is given by Equation 1, thus the fraction s/m is given by simply dividing s by m.

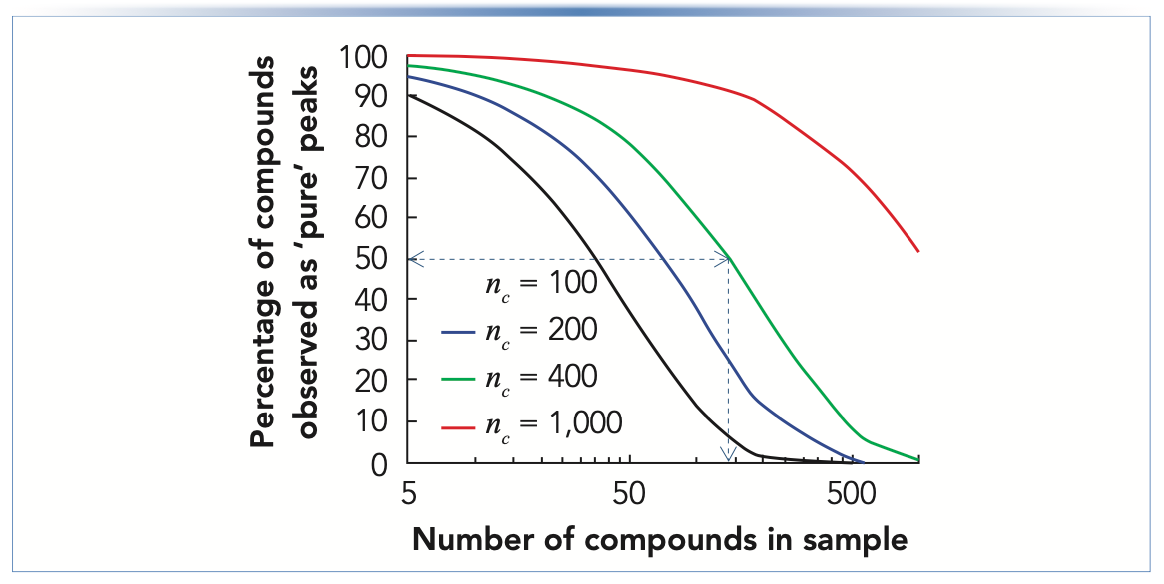
Figure 1 shows the fraction s/m (on a percent scale) for different combinations of sample complexity (m), and peak capacity (nc) offered by the separation method. The vast majority of separations of complex mixtures involve gradient elution conditions due to the large range in analyte properties encountered with the mixture. Under these conditions, peak capacities on the order of 100 to 200 are readily achieved using conventional LC with analysis times less than one hour for most types of analytes. Achieving peak capacities much higher than this usually requires special measures (for example, high pressures, high temperatures, or very long analysis times), and is typically only possible with certain analyte types, such as peptides, but values in the range of 200 to 400 are still possible using a single column. Moving even further, beyond a peak capacity of 400, usually requires two-dimensional separation (see below for further discussion). In Figure 1, we see just how bad the prospects are for fully resolving complex mixtures. Even with a peak capacity of 400 (green line), only about 50% of the compounds in the sample will be resolved as “pure peaks” when the sample contains 150 compounds (follow blue dashed lines). Significantly increasing the fraction of compounds in the mixture that are really separated from everything else in the sample requires a dramatic increase in the peak capacity.
FIGURE 1: Fraction (percent scale) of sample components (m) observed as singlets (s) for different combinations of sample complexity and peak capacity provided by the LC method. Adapted from reference (4).
Does Changing the Selectivity Help?
Figure 2 shows simulated separations of a 100-component mixture, in 30 min, with peak capacities of 100 (panels 2a and 2b) or 400 (panel 2c). The widths of pure peaks are all the same (as is approximately observed in many gradient elution separations), the height of each pure peak is assigned a value of 1, and retention times are randomly distributed. This makes it easy to visualize which peaks in the chromatogram are nominally pure (peak apex at 2 units on the y-axis), and where there are areas of moderate to severe overlap. When two compounds are perfectly coeluted, the peak apex of the two-component peak occurs at 3 units, if three compounds are perfectly coeluted, the peak apex occurs at 4, and so on, because the peak heights are additive. In panel 2a, we see that there are only about 15 peaks (out of 100 components in the sample) with a height of exactly 1, which is consistent with Figure 1 that provides estimates of the percentage of components in the sample that will be observed as pure peaks.
FIGURE 2: Simulated separations of a 100-component mixture using methods with peak capacities of (a,b) 100, or (c) 400. The heights of “pure," non-overlapping peaks are 1. The retention times of all 100 components are identical in (b) and (c), but different in (a).
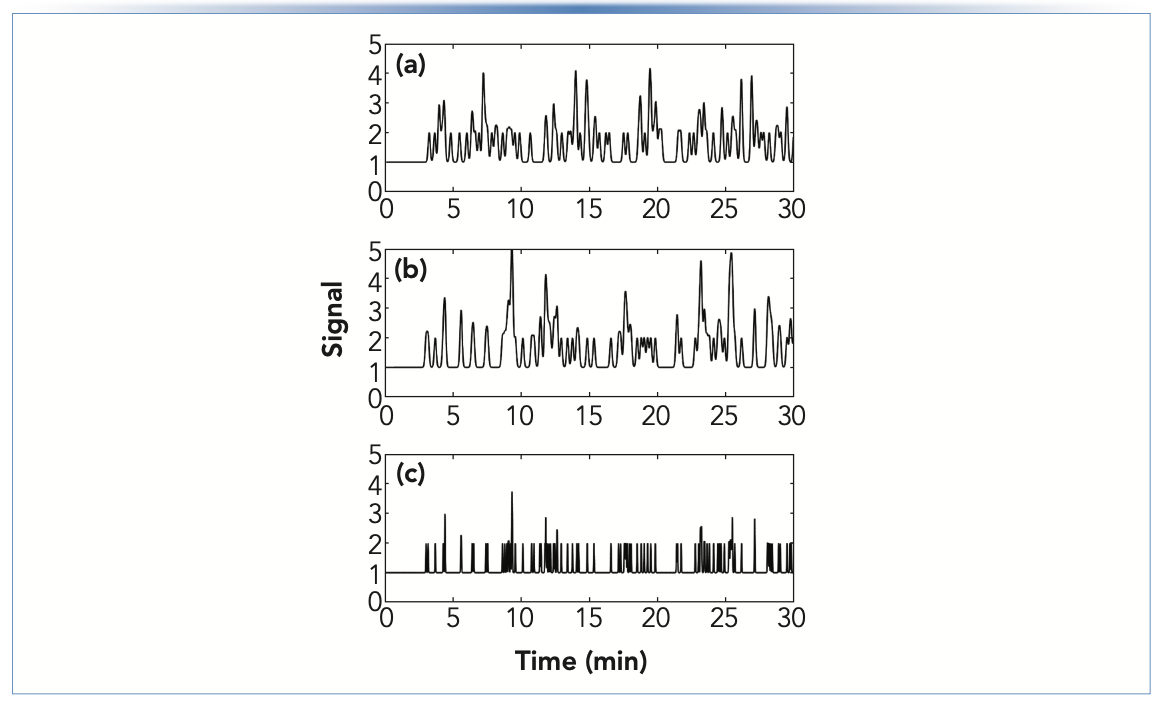
In Part II of this series, I emphasized the importance of changing the stationary phase chemistry as a means of adjusting separation selectivity when working with simple mixtures, and giving ourselves a chance to significantly improve the resolution of a pair of compounds that are not well separated using the original column. So, one might reasonably ask if the same game can be played here, when dealing with more complex samples. Figure 2b shows another simulated chromatogram using all the same parameters as in panel 2a (that is, analysis time, peak capacity, and number of components in the sample), except that the retention times of the peaks have been redistributed using a new set of random numbers to mimic a change in stationary phase chemistry. As we can see from the appearance of the new chromatogram in panel 2b, the areas of overlap have changed, but the degree of overlap (that is, the number of pure peaks, and the number of areas of severe overlap) is nominally unchanged. And so this is the disappointing answer when working with complex mixtures—that changing the selectivity of the separation (through changes in mobile or stationary phase chemistry) can impact the resolution of specific compounds, but, on average, it will not improve the overall separation much. This is because adjusting the retention times of the compounds by changing the selectivity merely rearranges which compounds are resolved, and which ones are overlapped.
Options for Increasing the Peak Capacity
Readers interested in a thorough, contemporary discussion of the concept of peak capacity and the influence of different chromatographic variables on the production of peak capacity are referred to a recent book chapter (5). Here, I summarize the most influential relationships that dictate the peak capacities that are achievable under practically relevant conditions, and the major levers that are within reach in routine method development.
To a good approximation, peak capacity is proportional to the square root of chromatographic efficiency (nc ∞/N). This means that anything we can do to increase N will also increase nc, but with a weak half-power dependence. Moreover, the relationships between N and important variables such as analysis time (tanal) and operating pressure (P) also extend to nc. In 2022, Ken Broeckhoven and I wrote a series of "LC Troubleshooting" articles aimed at explaining the concept of kinetic plots and how they can be used to both develop and troubleshoot LC methods (6–8). One of the important concepts in the kinetic plot framework for optimizing chromatographic efficiency is the so-called Knox-Saleem Limit (KSL). The KSL describes conditions where the particle size is chosen to maximize the efficiency for a particular analysis time by working with the longest possible column that allows one to work at the van Deemter optimum flow rate without exceeding the maximum system pressure. As the name suggests, these conditions enable the absolute maximum efficiency (Nmax) that can be obtained at that analysis time (and a certain temperature, operating pressure, and molecule type). It is physically impossible to do better than the Nmax number that is calculated at the KSL, and this framework yields a set of surprisingly simple, yet instructive relationships that are useful in setting our expectations with respect to peak capacity. At the KSL:
- Nmax ∞/tanal; nc ∞ tanal1/4: These relationships show us that, under KSL conditions, increasing the analysis time will lead to an increase in the peak capacity. However, the dependence of peak capacity on analysis time is very weak (one quarter power), and we should be careful to manage our expectations about how helpful simply increasing the analysis time can be. For example, doubling the peak capacity requires a 16-fold increase in the analysis time!
- Nmax ∞/P; nc ∞ P1/4: These relationships again show that increasing the system operating pressure has the potential to increase the achievable peak capacity, but the dependence is also quite weak. Again, this relationship is very helpful for managing our expectations. The prospect of increasing peak capacity by 50% by working at higher pressures is realistic, but the idea that we could increase peak capacity fivefold by working at higher pressures is not.
Whatever means we use to achieve higher peak capacities, the comparison of chromatograms in panels (b) (nc = 100) and (c) (nc = 400) of Figure 2 provides a qualitative sense for the potential impact of the increased peak capacity because the only difference here is in the peak widths; the retention times in the two cases are exactly the same. The major difference we observe is that there are fewer instances of severe peak overlap as indicated by fewer peaks with signals greater than 2. This, in turn, carries a variety of benefits, including greater quantitative accuracy, and reduction of matrix effects (for example, ionization suppression when using electrospray ionization with mass spectrometric detection). Increasing the peak capacity fourfold has not completely eliminated overlap, but it has made overlap less frequent. Completely eliminating overlap requires peak capacities that greatly exceed the number of components in the sample.
Moving to Two-Dimensional Separations
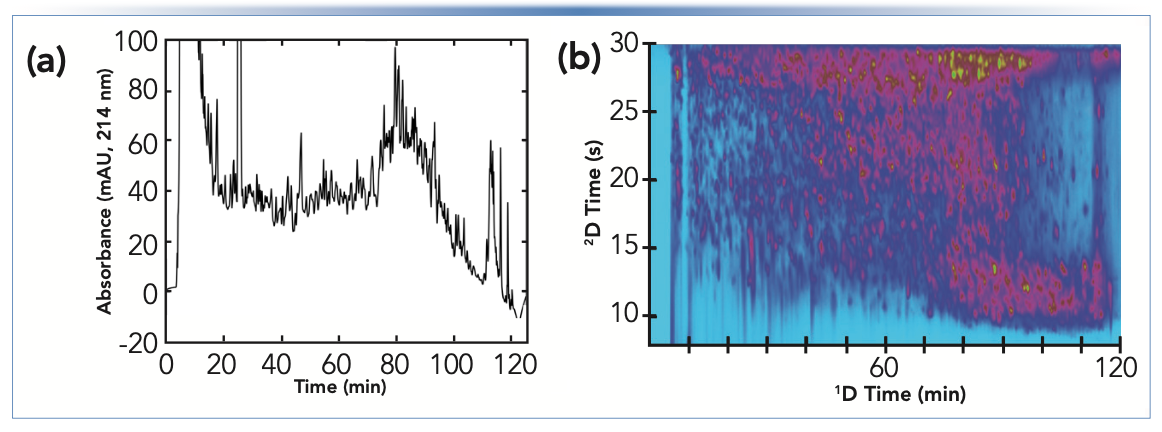
As stated above, the upper limit of the peak capacity that can be achieved with current technology under practically relevant conditions and a single LC column is about 400 for most samples. Significantly increasing the peak capacity beyond this requires a move to multidimensional separation, where there is the potential to increase peak capacity several times without significantly increasing the analysis time. Readers interested in this possibility, and how this is accomplished in practice, are referred to recently published guidance (9). Figure 3 shows an example of what is possible, both in terms of the increase in peak capacity upon moving to a two-dimensional LC (2D-LC) separation, and the impact of this increase on the resolution of a complex sample (peptides). In this case, the 2D separation provides a 20-fold increase in peak capacity without increasing the analysis time. Whereas the chromatogram is very crowded in the 1D separation, which undoubtedly involves severe peak overlap, in the 2D case compounds are generally much better separated, with large areas of unoccupied baseline between neighboring peaks.
FIGURE 3: Comparison of (a) 1D and (b) 2D-LC separations of the same sample, which contains several hundred peptides produced by digesting a E. coli cell lysate with trypsin. Note that nc for (a) is ~400 and for (b) is ~ 6000. Dr. Gregory Staples is acknowledged for providing the peptide sample.
Summary
Many HPLC users are confronted with questions about how to improve upon the performance of an existing method. In this installment, I have discussed options to consider when confronted with the need to improve the separation of a complex sample (defined here as more than 100 components). Unlike the case of improving the resolution of simple samples, making adjustments to the selectivity of the separation (through changes in mobile or stationary phase chemistry) does not help much when dealing with complex samples, because changing the selectivity merely moves peaks around without affecting the average resolutions for pairs of peaks. More impactful for complex samples are changes that increase peak capacity of the separation, including increasing analysis time and increasing the pressure used to drive the separation (along with accompanying changes in particle size, flow rate, and column length). These changes have the potential to increase peak capacity by a factor of two or three, but typically not much more than that. Substantially increasing the peak capacity (more than five-fold) usually requires a move to multi-dimensional separation.
References
(1) Stoll, D. R. What Are My Options to Improve My Separation? Part I: Foundational Concepts. LCGC North Am. 2023, 41 (1), 8–12. DOI: 10.56530/lcgc.na.ra9970y5.
(2) Stoll, D. R. What Are Options to Improve My Separation? Part II: Likelihood of Separation, Adjusting Selectivity for Simple Mixtures. LCGC North Am. 2023, 41 (2), 44–49,62. DOI: 10.56530/lcgc.na.qz2990k6.
(3) Davis, J. M.; Giddings, J. Calvin. Statistical Theory of Component Overlap in Multicomponent Chromatograms. Anal. Chem. 1983, 55 (3), 418–424. DOI: 10.1021/ac00254a003.
(4) Stoll, D. R.; Carr, P. W. Two-Dimensional Liquid Chromatography: A State of the Art Tutorial. Anal. Chem. 2017, 89 (1), 519–531. DOI: 10.1021/acs.analchem.6b03506.
(5) Carr, P. W.; Stoll, D., R. “Speed and Performance in Liquid Chromatography,” in Multi-Dimensional Liquid Chromatography: Principles, Practice, and Applications; CRC Press, 2022.
(6) Broeckhoven, K.; Stoll, D. R. But Why Doesn’t It Get Better? Kinetic Plots for LC, Part I – Basic Concepts. LCGC North Am. 2022, 40 (1), 9–12, 19. DOI: 10.56530/lcgc.na.sm2490k6
(7) Broeckhoven, K.; Stoll, D. R. But Why Doesn’t It Get Better? Kinetic Plots for LC, Part II – Making and Interpreting the Plots. LCGC North Am. 2022, 40 (2), 58–62. DOI: 10.56530/lcgc.na.gs2977o8
(8) Broeckhoven, K.; Gunnarson, C.; Stoll, D. R. But Why Doesn’t It Get Better? Kinetic Plots for LC, Part III – Pulling It All Together. LCGC North Am. 2022, 40 (3), 111–115. DOI: 10.56530/lcgc.na.vi2966r2
(9) Stoll, D. R., Carr, P. W., Eds., Multi-Dimensional Liquid Chromatography: Principles, Practice, and Applications; CRC Press, 2023.
About the Column Editor
Dwight R. Stoll is the editor of "LC Troubleshooting." Stoll is a professor and the co-chair of chemistry at Gustavus Adolphus College in St Peter, Minnesota. His primary research focus is on the development of 2D-LC for both targeted and untargeted analyses. He has authored or coauthored more than 75 peer-reviewed publications and four book chapters in separation science and more than 100 conference presentations. He is also a member of LCGC's editorial advisory board. Direct correspondence to: LCGCedit@mmhgroup.com

Polysorbate Quantification and Degradation Analysis via LC and Charged Aerosol Detection
April 9th 2025Scientists from ThermoFisher Scientific published a review article in the Journal of Chromatography A that provided an overview of HPLC analysis using charged aerosol detection can help with polysorbate quantification.
Removing Double-Stranded RNA Impurities Using Chromatography
April 8th 2025Researchers from Agency for Science, Technology and Research in Singapore recently published a review article exploring how chromatography can be used to remove double-stranded RNA impurities during mRNA therapeutics production.


