Ultra-Fast Separations of Pharmaceutical Compounds with 10 mm Columns Packed with Sub-2 µm Particles
LCGC Europe
Very short columns filled with 1.9 µm particles were evaluated for the ultra-fast analysis of pharmaceutical formulations. Local anæsthetic, mydriatic and anti-hypertensive agents were chosen as analytes and a method was developed and validated for each of these substances, according to ICH guidelines. Excellent quantitative performance was obtained using an optimized chromatographic system that reduces the importance of extra-column effects and cuts the analysis time to less than 15 s.
The launch of porous sub-2 μm particle stationary phases, combined with the simultaneous commercialization of compatible chromatographic instruments for these column geometries,1,2 has increased the amount of liquid chromatography (LC) development, particularly in the field of high-throughput separations.
Because chromatographic efficiency and mobile phase flow-rate are inversely proportional to particle size, a significant decrease in analysis time can be achieved while maintaining or enhancing chromatographic performance.3,4 However, one major constraint remains: the significant backpressure generated by small particles in optimal flow-rate conditions. This approach is known as UPLC (ultra performance liquid chromatography) or ultra high pressure liquid chromatography (UHPLC), according to the system provider. Numerous applications can be found in the literature with column lengths usually ranging from 50–150 mm5–8 and, less frequently, with shorter column lengths.9
In the pharmaceutical industry, the quality control (QC) of a formulation remains relatively simple because the number of active compounds, excipients and impurities is generally limited. As mentioned in various Pharmacopoeia, the separation is often performed with a conventional HPLC column (i.e., 150–250 mm in length) packed with 5 μm particles.10 However, there is a need to both control a large number of samples every day and reduce the response time delivery. Therefore, the use of short columns packed with sub-2μm particles is of the utmost interest.
Thanks to the simple matrix nature and the low number of analytes, a chromatographic efficiency lower than 5000 plates is often sufficient to perform the quality control of pharmaceutical drugs. Consequently, a 10 mm column packed with 1.9 μm was evaluated to increase the throughput, without compromising the analytical performance. To our knowledge, the use of such short columns packed with sub-2 μm particles has never been reported before. In the first part of this study, the compatibility of these columns in pharmaceutical analysis is highlighted and chromatographic performance assessed on the basis of Van Deemter curves and pressure plots. Then, these supports were used for the QC of three pharmaceutical formulations including local anaesthetic, mydriatic and anti-hypertensive agent. Qualitative and quantitative performance was evaluated and methods validated following regular guidelines (ICH).
Experiment
Chemicals: Butylparaben was obtained from Sigma-Aldrich (Steinheim, Germany). Standards of bupivacaine HCl and atropine sulphate were kindly provided by Sintetica SA (Mendrisio, Switzerland), while clonidine was purchased from Fluka (Buchs, Switzerland). Degradation products, namely tropic acid and 2,6-dimethylaniline were both supplied by Fluka.
Injectable solution of clonidine 0.6 mg/mL was kindly provided by the "Pharmacie Interhospitalière de la Côtequot; (Morges, Switzerland). Bupivacaïne 0.5% and rapidocaïne 0.5% were obtained from Sintetica SA. Atropine 0.5 mg/mL was purchased from Amino AG (Neuenhof, Switzerland).
Acetonitrile was of HPLC gradient grade from Panreac Quimica (Barcelona, Spain). Water was obtained from a Milli-Q Waters Purification System from Millipore (Bedford, Massachusetts, USA). Phosphate buffers 50 mM at pH 7.0 and 7.4 were prepared with an adapted quantity of anhydrous di-potassium hydrogen phosphate and potassium dihydrogen phosphate from Fluka. Buffer solutions were prepared using the Phoebus software 1.0 from Analis (Namur, Belgium) and pH measured with a Metrohm pH meter (Herisau, Switzerland).
Equipment: Chromatographic experiments were performed on Waters Acquity UPLC system (Milford, Massachusetts, USA). This instrument included a binary solvent manager with a maximum flow-rate of 2 mL/min, an autosampler with an injection loop volume of 2 μL (1 μL was injected in partial loop mode), a UV/vis programmable detector, a column manager with an oven (set at 30 ºC). For all separations, the UV detector time constant was set at 25 ms and the data sampling rate at 80 Hz.
The wavelength was set at 254 nm for clonidine, atropine and bupivacaïne and 230 nm for lidocaïne. Empower Software v2.0 was used for data acquisition, data handling and instrument control. Columns used throughout this study were Hypersil Gold (150 × 4.6 mm i.d., 5 μm, 50 × 2.1 mm i.d., 1.9 μm in standard analytical column format and 10 × 2.1 mm i.d., 1.9 μm in a high throughput format), (Thermo Scientific, Runcorn, UK).
Validation: In optimal conditions established for each drug, method validation was performed in agreement with ICH guidelines. Three methods were validated in terms of selectivity, trueness, precision and accuracy. According to SFSTP 2003,11 the concept of accuracy profile introduced by Hubert et al.12 and Boulanger et al.13 was used for testing the quantitative performance.
The linear regression model using only two calibration standards at the target concentration level of active compounds (CAL 100%) was selected. The validation was achieved with three series of 13 experiments including two blanks, 2 CAL 100% and 3 independent preparations of VAL 80, VAL 100 and VAL 120% (SFSTP 2003, protocol V1).
Three series of analysis were recommended to determine intra- and inter-day variations on the basis of peak area measurements. This procedure was applied for the three compounds of interest and results were expressed in terms of trueness (bias) and precision (standard deviation). Accuracy calculated as confidence interval12 was then considered using the general requirements for a pharmaceutical formulation (95–105% of recovery).
Preparation of Solutions
Standard solutions: Two standards were independently prepared: calibration standards (CAL) and reconstituted dosage form, also called validation standards (VAL). Solutions used for CAL were exempt of potential impurities and contained known concentrations of active compound (i.e., clonidine, bupivacaïne or atropine). VAL were samples reconstituted within the expected matrix (NaCl 0.9% for injectable form), in the absence of potential impurities.
Stock solutions of clonidine, atropine and bupivacaïne at 1 g/L were prepared by dissolving 50 mg of each standard in 50 mL of pure water (VAL) and 50 mL of pure water containing 0.9% NaCl (CAL). As reported in ICH guidelines,14 three concentrations of each drug were used for preparing VAL corresponding to low (80%), target (100%) and high (120%) concentration levels.
Sample solutions: Two independent clonidine vials at 0.6 mg/mL were diluted 2-fold with pure water to obtain concentration equivalent to VAL100%. A similar procedure was applied with bupivacaïne 0.5% and atropine 0.5 mg/mL, with dilution by a factor 10 and without dilution, respectively. Finally, the solution was homogenized and injected in triplicate in the chromatographic system.
Software: Variance component analysis was performed for intra- and inter-batch variability, using Statgraphics Centurion v.15.0.10 (Statpoint inc., Virginia, USA). This procedure was selected because it allows estimating the contribution of multiple factors to the variability of a dependent variable.
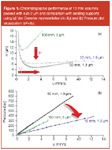
Figure 1
Results and discussion
Performance of ultra-short columns: In order to evaluate the chromatographic performance of 10 mm columns packed with 1.9 μm particles, Van Deemter curves were plotted with butylparaben in the range 20–1800 μL/min. This compound was eluted with 40:60 MeCN/water, and represented the best compromise between an acceptable analysis time and a sufficient retention (k = 7), to limit the influence of the chromatographic system.15 The curve obtained in such conditions is presented in Figure 1(a) with a H opt value closed to 6 μm (h = 3.15).
The right part of the curve demonstrated that mass transfer resistance (C-term of the Van Deemter equation) was extremely low (i.e., C = 0.25), allowing the use of high flow-rates (i.e., 400–1800 μL/min) with negligible efficiency loss (less than 15%).
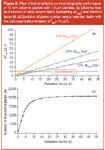
Figure 2
A comparison was assessed with Hypersil Gold 50 × 2.1 mm, 1.9 μm column. The curve shape was very similar but Hopt was better, 4.8 μm (h = 2.52) while the C-term was twice higher (i.e., C = 0.49).
The relative low efficiency observed with 10 mm columns can be explained either by an inhomogeneous packing or by the influence of the chromatographic system (extra-column volumes). For the sake of comparison, results obtained with a conventional 150 mm, 5 μm column were also reported in Figure 1(a) showing higher H opt (i.e., H opt = 11.0 μm) and C-term (i.e., C = 3.08) and lower optimal flow-rates, as expected from theory.3 It has to be noted that the C-term is always low when using columns packed with sub-2 μm particles, as it is directly proportional to dp2 . This statement is well illustrated by the behaviour of columns packed with 5 and 1.9 μm in Figure 1(a) (i.e., C = 3.08 and 0.49, respectively). However, the two-fold reduction observed for the C-term between the 50 and 10 mm columns packed with 1.9 μm particles, could be because of the different investigated flow-rate range and number of experimental data.
Regarding the induced backpressure, Figure 1(b) shows that 10 mm columns packed with 1.9 μm particles generated a pressure three-times lower than the 50 mm one (in identical conditions) while a factor five was expected (e.g., Darcy's law). The difference between theoretical and experimental values was probably because of the non negligible backpressure generated by inlet and outlet column frits and/or column fittings. It is worthy to note that ultra-short column generated a backpressure lower than conventional columns packed with sub-2 μm particles, allowing the use of a conventional instrumentation.
Influence of instrumentation: When using very short columns in ultra-fast conditions, the effect of the instrument on chromatographic performance becomes critical. Therefore, it is mandatory to evaluate the suitability of the LC system, prior to the analysis, using an appropriate characterization procedure. For this purpose, the extra-column band broadening as a result of the chromatographic system, σ2ext (expressed in volume units) should be obtained experimentally in absence of column by measuring the peak width at half height, W0.5 (in time units) of a model compound (i.e. uracil eluted with 40:60 MeCN:water), at an average flow-rate, and using the following equation: σ2ext= (W0.5*F)2/5.54. Then, it is possible to calculate the loss in efficiency attributed to the instrument, according to a procedure described elsewhere.15
Figure 2(a) depicts the loss in efficiency for the 10 mm column (V0 = 24 μL) as a function of the instrument extra-column band broadening (σ2ext ) and retention factor (k). According to theory,15,16 the effect of σ2ext is more important for early eluting peaks (low k). For examples, with a σ2ext = 10 μL2 (used instrument) and k ≥ 13, the loss in efficiency was acceptable (less than 10%); while k should be at least equal to 25 for σ2ext = 20 μL2 and the loss became unacceptable with σ2ext ≥ 40 μL2 , whatever k. As many conventional instruments possess σ2ext ≥ 100 μL2 , it is not possible to use such short columns with them and a dedicated instrument should be used to attain acceptable efficiency. Ideally, the system should possess low σ2ext (reduced injection volume and tubing, high time constant) and sufficient acquisition rate.
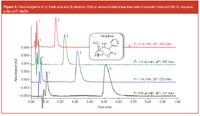
Figure 3
Figure 2(b) shows the evolution of column efficiency versus retention factor with the instrumentation (σ2ext = 10 μL2 ) used throughout this study. According to the column geometry, and considering h = 2.5, efficiency should be closed to 2100 plates. Considering the evolution of N with k, the reduced chromatographic performance of 10 mm columns (e.g., h = 3.15, k = 7) reported in Figure 1(a) can be obviously explained by the negative influence of instrumentation and not the packing quality. After subtracting the extra-column band broadening contribution for the 10 mm columns packed with 1.9 μm, Hopt and hopt values were equal to 4.92 μm and 2.59. These values are close to that of the 50 mm column packed with 1.9 μm (Hopt = 4.98 μm and h opt = 2.62). In conclusion, 10 mm columns gave performance equivalent to theoretical values but the instrumentation could be optimized to limit extra-column effects.
Qualitative Performance with Pharmaceutical Formulations
As a result of the limited efficiency of ultra-short columns (N = 2000 plates), the field of application is restricted to simple cases such as the QC of pharmaceutical formulations. Thus, three injectable formulations containing only one active substance were selected and two of them analysed in presence of a known impurity (to assess method selectivity).
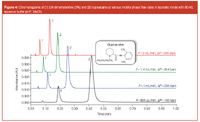
Figure 4
Figures 3, 4 and 5 present the separation of the active substance and potential impurities performed with 10 mm columns packed with sub-2 μm particles. Three pharmaceutical formulations have been considered, containing a local anaesthetic (bupivacaïne), a mydriatic (atropine) and an anti-hypertensive agent (clonidine). Bupivacaïne and atropine were analysed in presence of their potential impurities 2,6-dimethylaniline and tropic acid, respectively. These separations were performed in isocratic mode, using acetonitrile and phosphate buffer at pH 7. For clonidine and atropine (logD at pH7 is equal to 0.33 and –1.21, respectively) a mobile phase containing 10:90 MeCN/aqueous buffer was used, while 40:60 MeCN/aqueous buffer was necessary for bupivacaïne (logD at pH 7: 2.45). These separations were performed at flow-rates ranging from 600 μL/min to 2 mL/min, because no loss in efficiency was observed in this interval [Figure 1(a)]. In such conditions, the generated backpressure varied from 130–425 bar.
The separation of atropine (0.5 mg/mL) and tropic acid (50 μg/mL) presented in Figure 3 remained acceptable, with resolution comprised between 7.9 and 7.7 at flow-rates of 0.6 and 2 mL/min, respectively. Atropine was sufficiently retained (k = 6) for investigating quantitative performance, while the impurity (i.e., tropic acid) was less retained because of its high polarity (logD at pH7 equal to –2.8). The latter was nevertheless sufficiently separated from the solvent peak (k ≈ 1). In such conditions, the analysis time was very short, only 12 s at 2 mL/min.
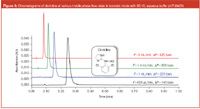
Figure 5
In Figure 4, the separation of bupivacaïne (0.6 mg/mL) and 2,6-dimethylaniline (12 μg/mL) was satisfactory, with very short analysis times, 9–27 s, and resolution comprised between 5.7 and 6.4 at flow-rates of 2 and 0.6 mL/min, respectively. Both peaks were sufficiently retained (k = 2 and 5 for impurity and main drug, respectively) to perform the quantification of active substance. Finally, Figure 5 shows the chromatogram of clonidine (0.3 mg/mL), with a very short analysis time (6–18 s, for flow-rates between 0.6 and 2 mL/min), which also demonstrates suitable performance for further quantification.
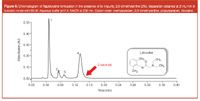
Figure 6
The chromatogram presented in Figure 6 is more complex and demonstrates the full possibilities offered by these columns in isocratic mode. The Rapidocaïne formulation contained lidocaïne in presence of an impurity (2,6-dimethylaniline) and two preservatives (methyl- and propylparaben). These four substances were baseline separated (Rsmin > 3) in about 9 seconds while the same separation is 60-fold longer in conventional HPLC.4 Nevertheless, because of the current instrumental limitations (e.g., injection cycle time) and time associated to data treatment; the interest of such ultra-fast separation (analysis time lower than 10 s) remains limited.

Table 1
Quantitative Performance with Pharmaceutical Formulations
Quantitative performance was determined, using a complete validation procedure for the three investigated pharmaceutical formulations. The validation process is a relatively time-consuming task because it is necessary to repeat a minimum sequence of 13 experiments for three independent series.12 For this reason, fast and ultra-fast separations are essential but the quality of the data shouldn't be lost. Results obtained in terms of trueness (systematic error) and precision (random error) are shown in Table 1. The total error reported as a confidence interval (df = 6, α = 0.05) according to SFSTP 2003, is presented in Figure 7, using the accuracy profile representation.17
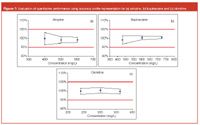
Figure 7
According to the quality of chromatograms obtained at flow-rates ranging between 0.6–2 mL/min, quantitative performance could be evaluated in the whole flow-rate range. Nevertheless, the validation procedures were performed at 600 μL/min only, because the analysis time at 2 mL/min (≤12 s) was not attractive considering the inter-injection time (about 45 s).
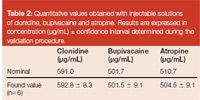
Table 2
Quantitative performance of the three methods was excellent and equivalent to that obtained with a conventional LC system. Trueness was always in the range 99–100.3%, whatever the compound and the concentration level, and intermediate precision (intra-series variability, n = 9) lower than 1.5%. Both criteria are fully acceptable and fulfil regulatory recommendations where results should be included within the range 95–105% of the target value for a pharmaceutical formulation. The three profiles were included inside the limits and confirmed that the 10 mm columns packed with sub-2 μm represents a good alternative to the traditional support for quantitative assay of simple drug mixture.
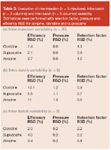
Table 3
Finally, two independent commercial formulations of each atropine, bupivacaïne as well as clonidine were injected and results of the nominal and found values (average value of the two ampoules injected in triplicate) were reported in Table 2. All measurements were included within accepted value, taking into account the confidence interval calculated from the validation procedure and considering s2r and s2g determined with the regular ANOVA-based variance decomposition.18,19
Column Stability, Intra- and Inter-Batch Variability
Only two different columns were used for the whole study. Both have been used for about 300 injections (which represents 7000 column volumes), with 80% of the injections performed in phosphate buffer pH7 conditions. After these experiments, a small decrease of overall performance was observed but both columns remained fully usable.
The inter-injection, intra- and inter-batch repeatability of these short columns were evaluated, by repeating 5 injections of clonidine, atropine and bupivacaïne with 6 columns from 2 independent batches. Results were summarized in Table 3 and expressed in terms of relative standard deviation (RSD) for backpressure, efficiency and retention factor. The observed variation on k and δP were always acceptable with inter-injection, intra-batch and inter-batch RSD always lower than 2.2 and 1.2%, respectively. These values are fully acceptable and close to that of a conventional HPLC system. Regarding efficiency variation, values were comprised between 1.4 and 11%, which are acceptable because they correspond to an absolute variation of about 200 plates.
Conclusion
This work highlights the potential of 10 mm columns packed with sub-2 μm particles for the analysis of simple drug products. As shown throughout the manuscript, qualitative performance of these columns are perfectly compatible with the usual pharmaceutical requirements, with efficiency around 1500–2000 plates and analysis time in the range 5–30 s. Regarding quantitative performance, trueness, precision and accuracy were equivalent to that of a conventional HPLC, while analysis times were drastically reduced (about 60-fold) compared with conventional HPLC.
However, such results were only obtained with a suitable instrumentation, compatible with ultra-fast separations. The inter-injection time remains a clear limitation of actual LC systems and there is a need to reduce cycle times to improve their compatibility with ultra-fast separation.
Further research with ultra-short columns packed with sub-2 μm particles will focus on the compatibility and performance of such column geometry in gradient mode, with UV detection and mass spectrometry (MS).
Acknowledgements
Authors would like to thank Andy Wells, Dafydd Milton and Harold Ritchie from Thermo Fisher Scientific (Runcorn, UK) for the generous gift of the columns used throughout this work.
Davy Guillarme gained his PhD in analytical chemistry from the University of Lyon (France) in 2004. He is now Maitre Assistant in the Department of Pharmaceutical Sciences, University of Geneva, University of Lausanne, Switzerland. His interests include the development of new approaches to perform fast and ultra-fast separations in liquid chromatography and the possibility of hyphenating these techniques with alternative detection modes.
Cedric Schelling is responsible for quality assurance in the Department of Pharmaceutical Sciences, University of Geneva, University of Lausanne, Switzerland. He is in charge of the trainee education and service analysis. He is also involved in several research projects in liquid chromatography.
Serge Rudaz gained his PhD in pharmacy from the University of Geneva, Switzerland in 1997. He is now lecturer in the Department of Pharmaceutical Sciences, University of Geneva, University of Lausanne, Switzerland. His research is focused on sample preparation, capillary electrophoresis and liquid chromatography. He is also iinterested in the development and use of methods for mathematical and statistical analysis of data produced from chemical instrumentation (design of experiments, method validation and data mining) including metabolomic approaches.
Jean-Luc Veuthey obtained his PhD in analytical chemistry from the University of Geneva, Switzerland in 1987. He is full professor in the Department of Pharmaceutical Sciences, University of Geneva, University of Lausanne, Switzerland. His interests include the development of LC and CE hyphenated to several detection modes for the analysis of drugs and metabolites. The sample preparation and the validation of the procedures are also particularly studied in his laboratory.
References
1. M. E. Swartz, LCGC N. Am., Suppl., 8–14 (2005).
2. J.R. Mazzeo et al., Anal. Chem., 77, 460A–467A (2005).
3. D.T.T. Nguyen et al., J. Chromatogr. A, 1128, 105–113 (2006).
4. D. Guillarme et al., J. Chromatogr. A, 1149, 20–29 (2007)
5. D.T.T. Nguyen et al., J. Sep. Sci., 29, 1836–1848 (2006)
6. R. Russo et al., J. Chromatogr. Sci., 46, 199–208 (2008).
7. S.A.C. Wren and P. Tchelitcheff, J. Pharm. Biomed. Anal., 40, 571–580 (2006).
8. L. Novakova, L. Matysova and P. Solich, Talanta, 68, 908–918 (2006).
9. I.S. Lurie, J. Chromatogr. A, 1100, 168–175 (2005).
10. US Pharmacopeia 28 (2005).
11. B. Boulanger et al., J. Pharm. Biomed. Anal., 32, 753–765 (2003).
12. P. Hubert et al., STP Pharma pratiques, 13, 101–138 (2003)
13. P. Hubert et al., Anal. Chim. Acta, 391, 135–148 (1999)
14. International Conference on Harmonisation of Technical Requirements for registration of Pharmaceuticals for Human Use. Q2(R1): Validation of Analytical procedures: Text and methodology (2005)
15. D. Guillarme et al., Eur. J. Pharm. Bio., 66, 475–482 (2007)
16. A. Pruss et al., J. chromatogr. A, 1016, 129–141 (2003)
17. S. Rudaz et al., Anal. Chim. Acta, 492, 271–282 (2003)
18. E. Rozet et al., J. Chromatogr. A, 1158, 111–125 (2007)
19. L. Geiser, S. Rudaz and J.L. Veuthey, Electrophoresis,24, 3049–3056 (2003).
Polysorbate Quantification and Degradation Analysis via LC and Charged Aerosol Detection
April 9th 2025Scientists from ThermoFisher Scientific published a review article in the Journal of Chromatography A that provided an overview of HPLC analysis using charged aerosol detection can help with polysorbate quantification.
Removing Double-Stranded RNA Impurities Using Chromatography
April 8th 2025Researchers from Agency for Science, Technology and Research in Singapore recently published a review article exploring how chromatography can be used to remove double-stranded RNA impurities during mRNA therapeutics production.


