Microemulsion HPLC
LCGC Europe
Microemulsion liquid chromatography (MELC) is a recent development offering reduced sample preparation times for complex samples and generic separation conditions applicable to a wide range of solutes. This article introduces the concepts of MELC and discusses the possible benefits and future applications.
What is MELC?
Microemulsions are stable, isotropically clear solutions consisting of an oil (such as octane) and water stabilized by a surfactant and co-surfactant. To form such a mixture the interfacial tension between the oil and water has to be decreased by the addition of both a surfactant and a co-surfactant. Sodium dodecyl sulphate (SDS) is a common and widely used surfactant.1,2 Medium chain alcohols, such as butanol or pentanol, are commonly used co-surfactants. Microemulsions contain nanometre-sized surfactant coated droplets of oil suspended in water — these are referred to as oil-in-water (o/w) microemulsions. Figure 1 shows a typical o/w microemulsion droplet structure.
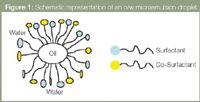
Figure 1
Water-in-oil (w/o) microemulsions are also possible where surfactant-coated droplets of water are suspended in oil. In Microemulsion liquid chromatography (MELC)1–4 a microemulsion mobile phase is used with conventional reversed-phase (RP) columns. Generally o/w microemulsions are used in MELC.
MELC is an extension of micellar liquid chromatography (MLC). In MLC a surfactant is added in excess of the critical micelle concentration (CMC) with the result that the mobile phase contains a large amount of micelles. The micelles affect the chromatography as analytes partition with the micelles rather than adsorb onto the stationary phase. In the o/w microemulsion the dispersed oil droplets are stabilized by the surfactant molecules and co-surfactant molecules.
The surfactant is present at concentrations well in excess of its CMC and the oil phase positions itself inside the resultant surfactant micelles. This reduces the interfacial tension between the oil and water. The co-surfactant molecules position themselves between the head groups of the surfactant molecules, which reduces the electrostatic repulsion between them and results in the overall ultra-low surface tension required for the spontaneous formation of the microemulsion.
O/w MELC using RP columns has been more widely documented since it first appeared in literature in 1992.5,6 W/o MELC was first reported in 1986.7
Gradient elution can also be performed in MELC and this will be covered in a later section.
Readers interested in more theoretical background are referred to a recent review paper,2 which provides a more comprehensive review of MELC background theory, applications and the effects of changing various operating and microemulsion parameters on MELC separations.
Microemulsions are also used in the capillary electrophoretic technique of microemulsion electrokinetic chromatography (MEEKC). Solutes separate because of partitioning and interacting with the droplets that move when a voltage is applied.8
Why use MELC?
Reduced sample preparation needs for complex samples: Microemulsions have great solubilizing power for both water-insoluble and -soluble compounds. They, therefore, offer the ability to directly solubilize hydrophobic samples and matrices, such as creams and waxes, without lengthy pre-extraction steps. The surfactant in the microemulsion solubilize/bind proteins, which reduces sample pre-treatment needs for analysis of biofluids such as plasma. This characteristic was widely exploited by several authors.1,3,8–11 This saves time and cost as it avoids procedures such as solvent–solvent extraction used in advance of a conventional HPLC analysis. These extractions are needed to avoid column fouling as a result of in-column precipitation of sample components. However, in MELC the samples are generally dissolved/diluted in the microemulsion, which is also used as mobile phase.
Generic conditions for rapid method development: Separation using the standard microemulsion2 is a good starting point when developing a method for a new separation where there is no previously published work. The standard microemulsion consists of 33 g SDS, 66 g butan-1-ol, 8 g n-octane in 1 L 0.05% trifluoroacetic acid (TFA). The sample for analysis is dissolved in the microemulsion and separation is performed on a C18 RP column, at ambient temperature, UV detection 254 nm and a flow-rate of 1 mL/min
Standard MELC conditions can be applied to mixtures containing a wide range of solute polarities because of the ability of the microemulsions to solubilize both water-soluble and insoluble compounds.
Alternative separation selectivity: O/w MELC also offers alternative partitioning mechanisms. The stationary phase of the RP-HPLC column is coated with the surfactant present in the microemulsion, which affects the stationary phase interactions. A secondary partitioning mechanism is created by the presence of the oil droplets and solutes partition between the aqueous phase, the oil droplets and the stationary phase of the column.
Water- insoluble compounds tend to reside in the oil droplet, while water-soluble compounds reside mainly in the aqueous phase and separation is also affected by stationary phase interactions.
Use of low detection wavelength: Many compounds do not have strong chromophores and need to be analysed at low wavelengths. MELC can be used to analyse compounds at wavelengths as low as 190 nm as the microemulsion components (oil and water) have low UV absorbance levels. This property shows a significant advantage over conventional HPLC where solutes with limited chromophores may require derivatization to be detected.
What has MELC been used for?
A number of publications on the potential use of microemulsions as a separation media in HPLC2,3,5–7,12 have used simple test mixtures, there have been a number of papers published on optimized methods applied to real samples,1,4,9–14 Table 1 summarizes current applications and the microemulsion compositions used.
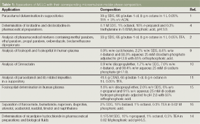
Table 1: Appications of MELC with their corresponding microemulsion mobile phase composition.
Pharmaceutical analysis: This has been the predominant area of investigation for MELC as pharmaceuticals analysts have applied MELC to solve complicated separations and/or reduce sample preparation needs.
An o/w MELC method has been developed for the determination of paracetamol content in a suppository formulation. This method gave excellent results and extremely fast analysis time when compared with the British Pharmacopoeia method.17 Table 2 shows the validation data for the optimized method, which compares very favourably with the reference method. The microemulsion enabled extraction of the paracetamol as the oil phase solubilized the hydrophobic part of the suppository.

Table 2: Validation data for analysis of paracetamol. (Reprinted from reference 1, with permission from Elsevier.)
Samples were prepared by sonicating 10 mg of suppository sample in 100 mL of microemulsion before directly injecting onto the HPLC — this compared with refluxing five suppositories in an acid solution along with numerous sample treatment procedures before titration with ammonium cerium (IV) sulphate using the BP method. In a recent paper this method was further optimized to analyse paracetamol and its related impurities.11 Figure 2 is a sample chromatogram of the suppository spiked with the internal standard propyl paraben, which shows the rapid analysis (sub 1 min) time. A similar MELC method was optimized to determine nicardipine hydrochloride in capsules and biological fluids.14
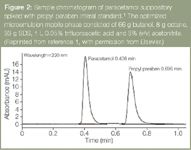
Figure 2
A MELC method has been optimized to resolve the cholesterol-lowering statin drug, simvastatin and its impurities.18 Figure 3 shows a chromatogram of simvastatin and its separated impurities. Resolution of simvastatin and its impurities in a single isocratic conventional HPLC run is virtually impossible because of its structurally similar impurities that have a wide range of polarities.
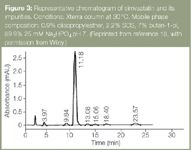
Figure 3
A MELC method was developed for the simultaneous determination of the antihistaminic drug, loratadine and its analogue desloratadine in pharmaceutical preparations.4 Using the microemulsion composition outlined in Table 1, separation was achieved in less than 10 min with a resolution factor of 3.85. The method was fully validated and from the results the method was deemed good enough to be adapted for routine analysis. Table 3 outlines the MELC results obtained for various loratadine dosage forms in comparison to a previously established HPLC method.19

Table 3: Comparison of recoveries achieved for pharmaceutical preparation using MELC with established LC method. (Reprinted from reference 4, with permission from Elsevier.)
Marsh et al.2 demonstrated the excellent linearity of the technique by injecting various different concentrations of naproxen. Also the reproducibility and robustness were examined by repeatedly injecting a given concentration of nicotine and naproxen while recording the peak area and peak retention time for each injection. Table 4 shows the results for reproducibility studies along with the assay results for a 4 mg nicotine tablet and a 500 mg naproxen tablet. The results confirmed that the method would be suitable for routine analysis.

Table 4: Recoveries achieved for pharmaceutical preparation using MELC. (Reprinted from reference 2, with permission from Wiley.)
Bioanalysis by MELC
Bioanalysis was the original application of o/w MELC when Berthod et al.5,6 reported its use for the separation of a series of alkyl benzenes and the screening of 11 drugs illegally used in sport. The presence of micelles in the mobile phase have the advantage of being able to solubilize proteins in complex matrices and eliminate lengthy pre-treatment steps thus speeding up analysis time and saving money.
Another group, Jancic et al. developed and validated an o/w MELC method for the determination of the angiotension-converting-enzyme (ACE) inhibitor, fosinoprilat, in human plasma resulting from the breakdown of fosinopril.15 The optimum mobile phase used is given in Table 1. The fosinoprilat eluted at 21 min with all unknown constituents in the plasma eluting within 12 min and no interfering peaks were observed. The MELC method avoided pre-treatment of the sample and minimized errors and losses, which makes bioanalysis very difficult. This method was also simpler and less time consuming than a previously reported method for the analysis of fosinoprilat in human plasma.20 This previous method involved the acidification of the serum samples prior to solid-phase extraction to isolate the two analytes before liquid chromatographic electrospray tandem mass spectrometric analysis.
The Use of Microemulsions in Gradient LC
In gradient MELC, reservoirs are filled with either water or microemulsion. Initially 100% water is pumped through the column and the amount of microemulsion is linearly increased until it reaches 100%. Use of gradient elution offers the possibility to fine-tune resolutions using standard gradient factors such as gradient onset.
Bryant et al.21 was the first to assess the use of gradient MELC and show that it could be used to achieve the separation of a diverse range of drug compounds. Figure 4 shows the gradient separation obtained for a range of pharmaceuticals. More recently Marsh et al.,22 separated a test mixture consisting of 15 acidic, basic and neutral compounds using gradient MELC. For comparison the separation was also performed in isocratic mode and all compounds were separated in the gradient elution, however, the two most hydrophilic compounds were not separated in the isocratic run. This result showed that gradient MELC offers another opportunity to optimize separation selectivity.
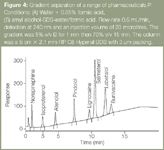
Figure 4
Another investigation into the use of the gradient microemulsion system was reported in the MELC method for the determination of paracetamol in a suppository.1 In the assessment of the stability indicating capability of the MELC method a number of gradient modes were attempted to separate paracetamol and five of its related substances. While separation of all the impurities was achieved peak retention times and resolution were irreproducible. Figure 5 shows a chromatogram of the separation using the optimum gradient mode.
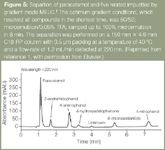
Figure 5
More recently the same group performed a more in-depth investigation and concluded that reproducible separations could only be achieved using isocratic MELC.11 The irreproducible retention times in gradient LC was found to be a result of the nature of the absorbed layer on the column packing. To achieve reproducibility the column has to be completely equilibrated with the microemulsion mobile phase and a constant adsorbed layer on the packing. This is achievable in isocratic MELC but when a concentration gradient is employed equilibration is not possible because of the dynamic nature of the surfactant adsorbed onto the column.
Operating Parameters of o/w MELC
There are a number of parameters affecting separation selectivity and retention. Table 5 shows an overview of these with accompanying references for further details.

Table 5: Operating parameters of o/w MELC.
Oil concentration/type: The effects observed for varying oil type and concentration2,4,6 are dependent on the nature of the solutes in the separation. For some hydrophobic solutes an increase in oil concentration in the microemulsion leads to a decrease in retention time. This arises because the retention time in RP-HPLC is determined mainly by the interaction between the solute and stationary phase. An increase in oil leads to an increase in the number of oil droplets for the hydrophobic analyte to partition into and, therefore, causes a decrease in retention time.2
In evaluating the use of microemulsions as eluents, El-Sherbiny et al.16 separated the test solutes, furosemide, bumetanide, naproxen, ibuprofen, atenolol, acebutolol, nadolol, timolol and naphthalene. They assessed the effect of changing the oil phase by replacing 1-octanol with diisopropyl ether, 2-octanone, n-octane and butyl acetate. These organic solvents had a wide range of polarities. Only the retention of the neutral hydrophobic solute naphthalene varied greatly with changes in the oil phase. When 1-octanol was replaced with diisopropyl ether, butyl acetate or 2-octanone the retention times increased slightly as the solutes did not partition as fully in the oil droplets.
Replacement with the more lipophilic n-octane decreased the retention time of all solutes except the hydrophobic naphthalene. They explained this by stating that the main partition mechanism is the hydrophobic interaction between the solute and the stationary phase and that the retention time decreases with increasing mobile phase hydrophobicity. They also commented that the oil phase might in some part coat the hydrophobic stationary phase, which would result in an increase in stationary phase.
Microemulsion pH
For the simultaneous determination of loratadine and desloratadine El-Sherbiny et al.4 saw an increase in retention time with increasing pH in intervals from 3–7. The authors explained the results in terms of the difference in hydrophobicity and dissociation constant as reflected in the log P and pKa values. Loratadine had a log P of 5.2 and a pKa of 5.0 while desloratadine had a log P of 3.2 and two pKa values of 4.2 and 9.7. As the pH increases both drugs become less ionized and the retention is dominated more by the differences in hydrophobicity. So, while both drugs were more retained for increasing pH values it was seen that loratadine was more strongly retained than desloratadine. The optimum separation was achieved at a pH of 3.
Sufactant and Co-Surfactant Type
The surfactant type used by Marsh et al.2 was SDS (sodium dodecyl sulphate), which is an anionic surfactant. Changing the type of surfactant to a cationic cetyltrimethylammonium bromide (CTAB) changed the retention of the polar analytes because the partitioning mechanism between the solute and the stationary phase (as there is a different adsorbed layer) was changed. They found that changing SDS to the similar anionic STS gave similar results.
Jancic el al.,9 when developing the fosinoprilat determination, stated the greatest influence on the separation was the type and concentration of the co-surfactant. They saw that replacing n-butanol with n-propanol, tetrahydrofuran or acetonitrile caused an extreme increase in retention times and, therefore, selectivity.
Surfactant and Co-Surfactant Concentration
Marsh et al.2 varied the concentration of SDS from 1.75–5% w/w. Although the CMC was reached at 0.5% w/w, at least 1.75% w/w was required to produce enough micelles to stabilize the oil and create the microemulsion. Increasing the SDS concentration from 3–4% w/w decreased solute retention times. They stated that the layer of surfactant adsorbed onto the stationary phase does not increase with a higher concentration of surfactant and so has no effect on the solutes hydrophobic stationary phase interaction. The increase in surfactant does, however, have an effect on the secondary partitioning mechanism (i.e., the interaction between the solute and microemulsion droplet).
Solutes are classified as droplet binding, droplet anti-binding or droplet non-binding. Anti-binding solutes are forced into the stationary phase by electrostatic repulsion which increases the retention time with an increasing concentration of surfactant. They noted that the solutes in their test mix were droplet binding as the retention decreased with increasing SDS concentration.
As stated by Marsh el al.,2 the co-surfactant helps stabilize the microemulsion system and increases solute mass transfer on the column. In their work they varied the concentration of butan-1-ol from 6.6–16.5% w/w (upper limit). No affect was observed on the separation up to 9% w/w, however, above 9% the chromatogram was compressed with the retention of the first peak remaining constant and decreased retention times obtained for all other peaks.
Experimental Design
Experimental design approaches can improve effectiveness and efficiency when developing and optimizing any HPLC method — especially when there are many parameters/variables to optimize.
There are many variables available when optimizing a MELC method such as surfactant type/concentration, oil type/concentration and so on. Varying all these parameters generates a vast amount of data and analysing and interpreting the large datasets can be difficult. Chemometrics can be used to generate optimum separation conditions. A MELC method9 for the separation of fosinopril sodium and fosinoprilat was optimized and characterized using chemometrics. Using experimental designs had the advantages of minimizing the risk of missing non-linear relationships within the data and also saved time.
Disadvantages of MELC
High back-pressures: Microemulsions have high viscosities that result in high back pressures. These back-pressures limit the flow-rate to 1 or 1.5 mL/min when using conventional C18 packed columns. This problem can be reduced using monolithic columns,23 which can have a three-fold decrease in back pressure, allowing the use of flow-rates up to 4 mL/min.
Column Conditioning and Equilibration
Columns require conditioning with the mobile phase before use and up to 30 column volumes may be needed to equilibrate columns with traditional HPLC solvents. Microemulsions are more viscous and contain less organics and it can take much longer for a steady baseline to be achieved. Approximately one hour was required at a flow-rate of 1 mL/min to equilibrate the column used by McEvoy et al.1 in the analysis of paracetamol. When changing parameters such as microemulsion composition or temperature, longer conditioning times are required. Also, there is a considerable amount of time required to clean the microemulsion out of the column after use. These disadvantages are reduced when methods are continuously employed in routine operations.
Conclusions
MELC can offer some advantages over conventional HPLC methods in terms of reduced sample pre-treatment needs for complex samples. Generic MELC conditions can be directly applied to a wide range of compounds because of the ability of microemulsions to solubilize a wide range of both water-soluble and insoluble solutes. Separations can be optimized using a variety of parameters and the use of microemulsion gradients also extends the selectivity optimization possibilities. To-date MELC has been applied to a limited number of complicated pharmaceutical analysis problems including quantitative analysis and separation of related impurities. MELC has also been shown to offer value in the area of bioanalysis.
MELC offers great possibilities for extending the current applications and moving into other application areas such as agrochemical and vitamin analysis. Academic researchers are encouraged to investigate the mechanisms underlying the separations and their optimization.
Richie Ryan is a PhD student in Waterford Institute of Technology (Ireland) under the supervision of Dr Sheila Donegan, Dr Joe Power and Dr Kevin Altria. His studies focus on the development and characterization of microemulsions for the separation of analytes by HPLC and CE.
Sheila Donegan is a lecturer in interfacial chemistry in Waterford Institute of Technology, where she heads a research group on surface and interfacial chemistry.
Joe Power is a senior lecturer in organic and analytical chemistry in Waterford Institute of Technology, where he is actively involved in pharmaceutical separations using microemulsions.
Eamon McEvoy has recently completed his PhD at Waterford Institute of Technology under the supervision of Kevin Altria, Sheila Donegan and Joe Power. His research was focused on the use of microemulsions as separation media for pharmaceutical applications using both LC and CE techniques.
Kevin Altria is an associate director in the Pharmaceutical Development Department of GlaxoSmithKline R&D. He is based in Harlow in the UK. He is actively involved in the development and understanding of separation methods employing microemulsions. The methods include both HPLC and CE methods. Kevin is the editor of the CE Currents column in LCGC Europe.
References
1. E. McEvoy et al., J. Pharm. Biomed. Anal., 44, 137–143 (2007).
2. A. Marsh, B.J. Clark and K.D. Altria, Chromatographia, 59, 531–542 (2004).
3. K.D. Altria et al., Chromatographia, 62, 341–348 (2005).
4. D.T. El-Sherbiny et al., J. Pharm. Biomed. Anal., 43, 1236–1242 (2007).
5. A. Berthod, J. Lacerna and I. Carretero, J. Liq. Chromatogr., 15, 3115–3127 (1992).
6. A. Berthod and M. De Carvalho, J. Anal. Chem., 64, 2267–2272 (1992).
7. M. Hernandez-Torres, J. Landy and J. Dorsey, J. Anal. Chem., 58, 744–747 (1986).
8. P.E. Mahuzier et al., LCGC Eur., 16(1), 22–29 (2003).
9. B. Jancic et al., Anal. Bioanal. Chem., 383, 687–694 (2005).
10. A. Malenovic et al., Chromatographia, 63, 95–100 (2006).
11. E. McEvoy et al., Chromatographia, 68, 49–56 (2006).
12. D.W. Armstrong and S. J. Henry, J. Liq. Chromatogr., 3, 657–662 (1980).
13. L. Jian-Fang et al., Chin. J. Anal. Chem., 35, 1529–1534 (2007).
14. M.I. Walash et al., J. Liq. Chromatogr. Related. Technol., 30, 1015–1034 (2007).
15. B. Jancic et al., J. Chromatogr. A, 1088, 187–192 (2005).
16. D. El-Sherbiny et al., J. Sep. Sci., 26 , 503–509 (2003).
17. British Pharmacopoeia, Vol. III, p. 2701 (2005).
18. A. Malenovic et al., J. Sep. Sci., 27, 1087–1092 (2004).
19. H. Amini and A. Ahmadiani, J. Chromatogr. B, 809, 227–230 (2004).
20. M. Jemal and D.E. Mulvana, J. Chromatogr. B, 739, 255–271 (2000).
21. S.M. Bryant, K.D. Altria, J. Sep. Sci, 27, 1498–1502 (2004).
22. A. Marsh, B.J. Clark and K.D. Altria, Chromatographia, 61, 539–547 (2005).
23. K.D. Altria, A. Marsh and B.J. Clark, Chromatographia, 63, 309–314 (2006).
24. J.G. Dorsey et al., J. Anal. Chem., 68, 515–568 (1996).
Silvia Radenkovic on Building Connections in the Scientific Community
April 11th 2025In the second part of our conversation with Silvia Radenkovic, she shares insights into her involvement in scientific organizations and offers advice for young scientists looking to engage more in scientific organizations.
Regulatory Deadlines and Supply Chain Challenges Take Center Stage in Nitrosamine Discussion
April 10th 2025During an LCGC International peer exchange, Aloka Srinivasan, Mayank Bhanti, and Amber Burch discussed the regulatory deadlines and supply chain challenges that come with nitrosamine analysis.
Polysorbate Quantification and Degradation Analysis via LC and Charged Aerosol Detection
April 9th 2025Scientists from ThermoFisher Scientific published a review article in the Journal of Chromatography A that provided an overview of HPLC analysis using charged aerosol detection can help with polysorbate quantification.


