Trace Metabolic Profiling and Pathway Analysis of Clomazone Using LC–MS-MS and High Resolution MS
The Application Notebook
Detection, analysis, and characterization of low-abundant metabolites remain an unresolved problem in metabolic studies. In this study, we report a novel approach to address this challenge. The current methodology is derived from the predictive multiple reaction monitoring (pMRM) mode available on triple-quadrupole linear ion trap mass spectrometry (MS) systems. The pMRM mode offers the highest sensitivity among various acquisition modes for studying trace levels of metabolites of the herbicide clomazone in plants. Additionally, this method allows for the identification of positional isomers of metabolites.
Clomazone (2-[(2-chlorophenyl)methyl]-4,4-dimethyl-3-isoxazolidinone), a carotenoid biosynthesis inhibitor, has been used as an herbicide for the last four years in California to control late watergrass (Echinochloa phyllopogon [Stapf] Koss). Clomazone detoxification is known in other species and soil microorganisms (1,2). Biotransformation of clomazone in rice and early watergrass has also been investigated with radiolabeled clomazone, which resulted in schemas of biotransformations and lists of metabolites (3). However, the radiolabeling technique is not sensitive enough to reveal physiological important metabolites and cannot offer structural information on detected entities.

Currently, the analysis of low-abundant metabolites represents an unresolved problem in metabolic profiling. Although multiple techniques have been used to conduct metabolic profiling (4,5), LC–MS is considered the most promising platform (6,7) because of its superior sensitivity, selectivity, flexibility, and wide-range of metabolite detection. However, LC–MS profiling performed in full scan mode, in spite of delivering overwhelming numbers of metabolites detected, is not sensitive enough to detect and characterize metabolites at trace levels. In contrast, liquid chromatography–tandem mass spectrometry (LC–MS-MS) provides excellent sensitivity in multiple reaction monitoring (MRM) mode, but suffers from a lack of structural information and metabolite coverage.
Recently, a hybrid MS system combining a triple-quadrupole (QQQ) scanning functionality with sensitive linear ion trap (LIT) scans was made commercially available (see Experimental). Working in LIT mode, the system provides improved performance and enhanced sensitivity in full scan (EMS) and product ion scan (EPI) modes. Additionally, the instrument can operate under all the triple-quadrupole scanning modes including MRM, precursor, and constant neutral loss scanning. Therefore, accurate quantification and additional structural information can be obtained simultaneously in a single run by combing MRM and EPI scanning via the built-in information-dependent acquisition (IDA) functionality.
MRM-IDA-EPI methods have recently been applied in drug discovery (9–13). In addition to previously described methods, predictive multiple reaction monitoring (pMRM) technology utilizing new predicting algorithms has been used in the present study (14–17). The pMRM algorithms generate theoretical metabolite MRMs based on the latest updated database sets of well-known Phase I and Phase II biotransformations. More than 80 biotransformations of exogenous metabolites were described (15). Interestingly, the new pMRM approach can identify positional isomers that are helpful in identification of positional changes in metabolism. For example, clomazone has a molecular ion [M+H]+ mass charge ratio of m/z 240, and the fingerprint fragment is m/z 125, representing the phenyl ring substructure. Di-oxidation adds two oxygen atoms on the parent molecule. After the collision of the parent ion in Q2, the fingerprint fragment may be m/z 125 + 2 × 16, m/z 125 + 1 × 16, and m/z 125, corresponding to di-OH-clomazone isomers with two, one, and zero oxygen atoms on the phenyl ring substructure of the clomazone.
Detection and characterization of metabolites are not straightforward processes. In many cases, LC–MS-MS methodology is insufficient to fully describe the molecule of interest. The MS system operates at unit mass resolution, which is not sufficient to deduce unique elemental composition of unknown metabolites. Accurate mass measurements and MS-MS fragmentation patterns may help with structural assignments. Accurate mass measurement using high-resolution MS is necessary for validating newly identified secondary metabolites. High mass accuracy and high resolving power can be obtained (for example, <5 ppm; maximum resolving power 100,000 at m/z 400, full width at half maximum [FWHM]); however, the data acquired with high-resolution MS are insufficient for assigning unique elemental compositions without supporting information on isotope ratios (18,19).
The isotopic abundance pattern serves as a powerful additional constraint for identification of candidates with very similar elemental composition. Previous studies demonstrated that interpretation of isotopic abundance patterns removes more than 95% of false candidate formulas for molecules smaller than 500 Da (18,19). It was concluded that instruments with 3 ppm mass accuracy and 2% relative error for isotopic abundance pattern outperformed those with <1 ppm accuracy that do not include isotope information in the calculation of molecular formulas. Self calibrated lineshape isotope profile search (sCLIPS) algorithms corrected the instrument line-shape and enabled exact isotope modeling when comparing the MS response of an unknown ion against theoretically calculated responses for all possible candidate formulas for data acquired in continuous mode. As long as the isotopic pattern can be measured accurately, sCLIPS algorithms can be used to predict elemental composition of any molecule. Actually, our recent experimental data supported the use of exact isotope modeling as a key filter for the unique elemental formula assignment (20).
In the present study, we developed a workflow that takes advantage of sensitive MS hybrid hardware and feature-rich software, successfully identifies several low-abundant secondary metabolites, and constructs metabolic biotransformation pathways of the herbicide clomazone in E. phyllopogon plants (21,22).
Experimental
Chemicals and Materials
LC–MS-grade acetonitrile was purchased from Burdick and Jackson (VWR International, West Chester, Pennsylvania); the purity of each lot was investigated by LC–MS infusion. Extrapure formic acid was purchased from Fluka (Sigma-Adrich, St. Louis, Missouri). The herbicide clomazone and 5-hydroxy clomazone were obtained from FMC (Princeton, New Jersey). Pure water was supplied by a Milli-Q gradient A10 unit (Millipore Corporation, Billerica, Massachusetts) with a residual total organic carbon content of <5 ppb. Fresh aqueous buffers for LC–electrospray ionization (ESI)-MS were prepared on the working day. Also, on each working day, a clomazone stock solution (0.1 mg/mL) for tuning was prepared freshly in a solvent system with identical composition to the initial LC mobile phase. A 0.2 mg/mL reserpine stock solution was made in methanol.
Sample Preparation
Fresh leaf samples (100 mg) from E. phyllopogon plants hydroponically treated at the two- to three-leaf stage with 50 µM clomazone for 96 h were mixed with 0.5 mL of 4:3:1 (v/v/v) water–acetonitrile–isopropanol, and the mixture was placed into a 2-mL microcentrifuge tube. Tissues were homogenized for 0.5 min at 30 Hz with a stainless steel ball mill (Retsch MM 301, Retsch GmbH & Co., Germany), the tube holder of which had been prechilled to –80 °C; the homogenate was then sonicated in an ultrasonic bath for 1 min, and extracted at 4 °C on an orbital shaker at 750 Hz for 5 min in the dark. The mixture was centrifuged at 16,100 rcf for 2 min and the supernatant was transferred to a clean tube. The pellets were resuspended in 0.5 mL of the extraction solvent and mixture, centrifuged at 16,100 rcf for 2 min, and the supernatant was combined with the initial extracted volume. Extracts were injected (10 µL) in the LC instrument.
Reversed-Phase LC–MS
Reversed-phase LC–ESI-MS analysis was conducted using an Acquity UPLC system composed of a binary solvent manager, a sample manager, a column manager, and a TUV detector (Waters Corporation, Milford, Massachusetts). The system was operated in high performance liquid chromatography (HPLC) mode. Because clomazone has a phenyl group in its structure, a 150 mm × 3 mm, 3-µm dp Luna phenyl-hexyl column (Phenomenex, Torrance, California) was chosen to separate clomazone and its metabolites assuming that π-π interactions may provide efficient selectivity. Mobile phases used were as follows: A, 0.1% formic acid in water; B, 0.1% formic acid in acetonitrile. After a 2-min isocratic run at 3% B, a gradient to 60% B was concluded at 6 min, and then ramped to 95% B for up to 15 min. Column wash with 100% B was followed by equilibration with 3% B starting at 21 min and maintained until 25 min. All injection volumes were 10 µL, the column temperature was 50 °C, and the flow rate was 0.3 mL/min. The weak-wash solvent was 1:1 (v/v) water–methanol and the strong-wash solvent was 3:1 (v/v) acetonitrile–isopropanol. The entire effluent from the LC column was directed into the ESI source of an API 4000 QTrap hybrid triple-quadrupole linear ion trap mass spectrometer (Applied Biosystems/MDS Sciex, Foster City, California) equipped with a TurboIonSpray source (a heated electrospray source with an orthogonal source of heated gas to help desolvate the spray). Ion-source parameters were set manually. The scales of the horizontal and vertical axes of the ion source were set at 6. Final TurboIonSource parameters were as follows: curtain gas (CUR), 20 psi; collision gas (CAD), high; ionSpray voltage (IS), 5.2 kV; temperature (TEM), 300 °C; ion source gas 1 (GS1), 50 psi; ion source gas 2 (GS2), 50 psi; and interface heater (IHE), on.
Acquisition Methods
Using clomazone as the reference, compound-specific parameters were automatically optimized using LightSight software (V2.0, Applied Biosystems/MDS Sciex). The automatic method creation tool in the software was used to generate the following data: positive mode: predictive multiple reaction monitoring (pMRM-IDA), EMS full scan, precursor scan of 125 (the fingerprint fragment of clomazone), precursor scan of 141 (hydroxyl group added on the fingerprint fragment of clomazone), neutral loss of 115 scan (the molecular ion of clomazone is 240, minus the fingerprint fragment of 125), neutral loss scan of 129 for unknown glutathione conjugates; and 2); negative mode: neutral loss scan of 176 for unknown O-glucuronides, precursor scan of 272 for unknown glutathione conjugates.
The pMRM-IDA method was composed of one positive MRM scan, one IDA criteria, and one enhanced product ion (EPI) scan. The known and described biotransformations (15) were used to generate an MRM list. Table I shows a truncated list of relevant transitions. The MRM scan had a list of 122 transitions calculated from the predictive algorithm embedded in LightSight 2.0 (Table I). Parameters for the MRM scan were as follows: declustering potential (DP), 61 V; entrance potential (EP), 10 V; collision energy (CE), 29 V; and collision cell exit potential (CXP), 20 V. Q1 was set as unit resolution and Q3 as low resolution. Dwell time of each MRM channel was 5 ms and pause time was 2.5 ms. IDA criteria were set as the most intense ion exceeding 500 counts triggering an EPI scan to confirm charge state and isotope pattern selection. Parameters for EPI were as follows: scan mode, profile; scan rate, 4000 amu/s; LIT fill time, 5 ms; dynamic fill time, on; DP, 40 V; CES, 25 V; CE, 60 V; CXP, 20 V. Q1 was set as unit resolution.

Table I: The predictive MRM (pMRM) transitions list
High-Resolution LC–MS
The HPLC method was the same as described earlier. The entire effluent from the HPLC column was directed into the ESI source of an LTQ-Orbitrap MS system (Thermo Fisher Scientific, San Jose, California) operated under Xcalibur software (V2.07, Thermo Fisher Scientific) or an LTQ-FT Ultra hybrid linear ion trap 7.0 T Fourier-transform ion cyclotron resonance (FT-ICR) system (Thermo Fisher Scientific) operated under Xcalibur software (V2.07, Thermo Fisher Scientific). It was realized by our group that the Orbitrap system was 10–100 times more sensitive than the FT-ICR system, but the latter system could achieve a resolution of 1,000,000 at m/z 400 and had better mass accuracy (routinely reached to the range of 0.1–2 ppm). Therefore, the Orbitrap system was used to identify low abundant unknown metabolites, whereas the FT-ICR system was used when maximum mass accuracy and resolution were needed. Both systems used identical source and scanning parameters. The ion source voltage was 5 kV. The nitrogen sheath and auxiliary gas flow were 60 and 20 units, respectively. Nitrogen was produced by a nitrogen generator system (Peak Scientific, Billerica, Massachusetts). The ion transfer capillary temperature was 300 °C. Typical ion gauge pressure was 0.90 × 10⁻⁵ . Briefly, the mass spectrometer was operated in the data dependent mode to automatically switch between MS and MS-MS acquisition. Survey full scan MS spectra (from m/z 200–600) were acquired with the resolution R = 50,000 (FWHM) in the Orbitrap system and R = 100,000 (FWHM) in the FT-ICR system at m/z 400 (after accumulation to a "target value" of 1,000,000 in the linear ion trap using the automatic gain control (AGC). The most intense ions were isolated and fragmented in the linear ion trap using collisionally induced dissociation (CID) at a target value of 100,000. All scan events were acquired with one microscan. Full-scan spectra were acquired with a 200 ms maximum ionization time. Parameters applied in MS-MS scan events were an isolation width of 2 Da, an activation time of 30 ms, a normalized collision energy of 40%, and an activation Q of 0.250. Dynamic exclusion was used with the following parameters: repeat count, 2; repeat duration, 15 s; exclusion duration, 45 s.
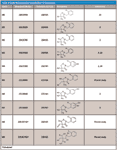
Table II: Detected secondary metabolites of clomazone
Structure Elucidation Based on Mass Spectral Data
Mass spectra of the feature peaks were spectrally corrected using MassWorks software (version 2, Cerno Bioscience, Danbury, Connecticut) to achieve high mass and spectral accuracy after data acquisition. MassWorks sCLIPS algorithms corrected the instrument's line-shape and enabled exact isotope modeling when comparing the MS response of an unknown ion against theoretically calculated responses for all possible candidate formulas. The use of exact isotope modeling with MassWorks was a key feature to the unique elemental formula identification. The unique elemental formula was searched against the CAS database (American Chemical Society, Washington, D.C.) using the strategy of "Explore Substances – Chemical Structure." The chemical structures that corresponded to the elemental formula were saved and imported to Mass Frontier 5.0 (HighChem Ltd, Bratislava, Slovakia) for the MS-MS fragmentation modeling analysis. The Mass Frontier "Fragments and Mechanisms" module is an expert system providing information about basic fragmentation and rearrangement processes based on literature, starting from a user-supplied chemical structure. The theoretical fragments generated by Mass Frontier were compared to those acquired from LC–MS providing assistance with elucidation of the structures of feature peaks.
Results and Discussion
Fragmentation Mechanism of Clomazone in ESI Positive Mode
Clomazone has one chlorine atom attached to its phenyl ring and shows the unique chlorine signature in its mass spectrum (Figure 1) that can be used to track clomazone metabolites. During an LC–MS experiment using an MS system at unit mass resolution, we demonstrated that in-source fragmentation of clomazone ([M+H]+m/z 240) produced the fragment of m/z 125, which retained the chlorine signature, suggesting the cleavage of the substructure of phenyl ring of clomazone (Figures 1 and 2). In addition, it was previously shown in well-established environmental LC–MS-MS studies on water contamination of clomazone that m/z 240/125 is a typical MRM transition (21,22). Extracted ion chromatograms illustrated that clomazone M0 m/z 240 and its major fragment m/z 125 had the same retention time, confirming the origin of the fragment m/z 125 was from M0 m/z 240 (Figure 2). The theoretical fragmentation mechanism simulated in Mass Frontier confirmed the above mentioned results. In addition, the theoretical fragmentation mechanism suggested a possibility to produce fragment m/z 128 without the chlorine atom in this fragment's structure (Figure 1). However, in the clomazone molecule, the C-N bond was easier to break down than the C-C bond so that m/z 240/128 was a minor fragmentation pathway. This minor fragmentation pathway explained the intensity elevation in m/z 128 in the lower left panel of Figure 2. Finally, the fragment of m/z 125 was used as the fingerprint of clomazone and its secondary metabolites during automatic method creation.
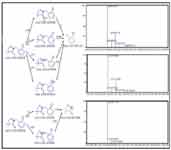
Figure 1
Data Acquisition
The following methods were used for data acquisition: positive mode: predictive multiple reaction monitoring (pMRM-IDA), EMS full scan, precursor scan of 125 (the chlorobenzyl ring of the clomazone molecule), precursor scan of 141 (the hydroxyl chlorobenzyl ring, specifically for M4 searching), neutral loss of 115 scan (the alkyl chain of the clomazone molecule), neutral loss scan of 129 for unknown glutathione conjugates; and negative mode: neutral loss scan of 176 for unknown O-glucuronides, precursor scan of 272 for unknown glutathione conjugates. Among all of the above methods, pMRM-IDA-EPI methods detected the greatest number of clomazone-related secondary metabolites, suggesting the highest sensitivity is achieved with the pMRM technique (21,22). With prior knowledge of the parent compound and its fragmentation pathway, the theoretical MRM transitions for metabolites were determined, thus generating a pMRM-IDA method. A complete set of MRM transitions was generated for metabolites that are the result of modifications (Table I). Two critical components in generating a pMRM method were the algorithm that generated the comprehensive MRM transitions and the new comprehensive biotransformation sets according to the possible clomazone biotransformation known from the literature. These new biotransformation sets had more than 100 metabolic pathways, thus enabling better prediction of MRM transitions of potential metabolites.
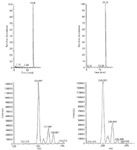
Figure 2
Metabolite Detection and Characterization
To better understand complex and overlapping metabolic pathways, high-throughput de novo metabolite identification was applied. Although the pMRM approach was good at finding compounds at trace levels because of the high sensitivity of the hybrid triple-quadrupole linear ion trap system in MRM mode, the unit resolution and low mass accuracy of the system warranted further metabolite identification and validation using high-resolution high-accuracy MS. For further confirmation, the MS-MS fragmentation pattern was analyzed based on information about basic fragmentation and rearrangement processes in the literature.
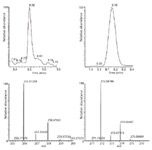
Figure 3
Several secondary metabolites were detected, analyzed, and characterized using the current methodology (Table II). For example, metabolite M3, the oxidation product of clomazone, m/z 256, was found using pMRM transition of 256/125. High-resolution MS spectral data showed that M3 had an accurate mass of 256.073 with the single-chlorine-atom isotopic signature. Isotopic modeling in MassWorks suggested the unique elemental formulae of C12H15NO3Cl. Fragmentation pattern modeling in Mass Frontier indicated that the fragmentation mechanism of M3 was the same as M4 MS-MS spectra, but the fingerprint fragments were different because of the different position of the hydroxyl group in the parent molecule (Figure 4). Using the hybrid triple-quadrupole linear ion trap system, enhanced product ion scans (EPI) of M3 in clomazone-treated plant samples and pure standard solutions showed a high degree of similarity, suggesting the existence of M3 in plant samples. In addition, time course data on M3 formation proposed another physiological line of evidence (Figure 5). Therefore, it was concluded that the unknown secondary metabolite M3 was 5-hydroxy-clomazone. Compared to M3, metabolite M4 might have a different location of the hydroxyl group attached to the benzene ring, supported by the facts that M3 and M4 had different retention times and different fingerprint fragments (Figure 5). Metabolite M5, having a transition of m/z 272/125, with an accurate monoisotopomer mass of 272.06843, had a clear single-chlorine signature (Figure 3). Elemental composition assignment of M5 was offered by best-fit formulas at delta of 2 ppm. However, there were a few isomers with fingerprint fragment m/z 125 possessing chlorine isotopic patterns. Finally, the most possible candidate (with the highest probability score) was suggested (Table II). Keep in mind though, M3, M4, and M5 could be found at different retention times due to different positional isomers (Figure 5). Other interesting metabolites, M8 and M9, were found using pMRM transitions of 268/125 and 320/125. Unfortunately, these metabolites could not be detected on hybrid triple-quadrupole linear ion trap system with any other modes of acquisition. Attempts to detect M8 and M9 with the Orbitrap or FT-ICR MS systems also failed. On the other hand, this result actually demonstrated the higher selectivity of pMRM mode compared to that of the full-scan profiling mode. Regardless, we suggested putative chemical structures to be validated (Table II). In the future, after HPLC fractionation and concentration, offline nuclear magnetic resonance (NMR) and accurate mass measurement will be applied to confirm the suggested structures of M5, M8, and M9. However, it is known that isolation of unstable metabolites is a challenging process. Therefore, there is no guarantee that the above mentioned plan will be successful in our future endeavors. Other metabolites, M1 (m/z 242/125), M2 (m/z 254/125), and M7 (m/z 272/125) were of less physiological importance and were not pursued as diligently as those metabolites mentioned above.
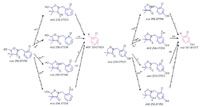
Figure 4
In summary, we demonstrated a novel workflow that was successfully applied in complex time-course experiments of the weed watergrass treated with different levels of clomazone, revealing more metabolites as well as assigning metabolic pathways (21,22).
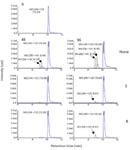
Figure 5
Conclusions
In biological bodies, exogenous compounds go through all kinds of biotransformations; however, most of these biotransformations could not be detected by previous technology (15). In the present study, we demonstrated for the first time that low-abundant clomazone metabolites that were buried under dominating abundant metabolites could be successfully detected, analyzed, and characterized. Chemical structures of these detected metabolites were proposed, based on MS and MS-MS spectra. The described methodology was applied in complex experiments in which plants were treated with clomazone at different levels in a time-course manner, and was effective in elucidating biotransformations of clomazone. We believe that the current methodology can be extended to study endogenous metabolic pathways. This approach opens an exciting opportunity for metabolic pathways elucidation, thus providing a powerful tool for small-molecule biomarker screening and drug discovery.
Acknowledgments
This work was financially supported by the UC Davis Genome Center Pilot Project and partially funded by grants from the California Rice Research Board. Our appreciation was give to Professor Scott D. Stanley from California Animal Health & Food Safety Laboratory for access to the LTQ-Orbitrap mass spectrometer.
Wei Zou is with the California State Department of Toxic Substances Control in Berkeley, Califonia. Direct correspondence to: wzou@dtsc.ca.gov. Hagai Yasuor and Albert J. Fischer are with the Department of Plant Sciences at the University of California in Davis, California. Vladimir V. Tolstikov is with the UC Davis Genome Center at the University of California in Davis, Califonia.
References
(1) H. Yasuor, P.L. TenBrook, R.S. Tjeerdema, and A.J. Fischer, Pest. Manag. Sci. 64, 1031–1039 (2008).
(2) S.Y. Liu, M. Shocken, and J.P.N. Rosazza, J. Agric. Food Chem. 44, 313–319 (1996).
(3) P.L. TenBrook, and R.S. Tjeerdema, Pest Biochem. & Physiol. 85, 38–45 (2006).
(4) V.V. Tolstikov, in Metabolic Analysis. Methods in Molecular Biology: Micro and Nano Technologies in Bioanalysis, J.W. Lee and R.S. Foote, Eds. (The Humana Press Inc., Totowa, New Jersey, 2009) 544, pp. 343–353.
(5) W. Zou and V.V. Tolstikov, Rapid Commun. Mass Spectrom. 22, 1312–1324 (2008).
(6) W. Zou and V.V. Tolstikov, Algorithms 2, 638–666 (2009).
(7) V.V. Tolstikov, O. Fiehn, and N. Tanaka, in Application of Liquid Chromatography-Mass Spectrometry Analysis in Metabolomics, in: Methods in Molecular Biology: Metabolomics: Methods and Protocols (The Humana Press Inc., Totowa, New Jersey, 2007) 358, 141–158.
(8) K. Greulich and A. Lutz, Anal. Bioanal. Chem. 391, 183–197 (2008).
(9) S. Ma and M. Zhu, Chem. Biol. Interact. 179, 25–37 (2009).
(10) S. Ma and R. Subramanian, J. Mass Spectrom. 41, 1121–1139 (2006).
(11) M. Yao, L. Ma, E. Duchoslav, and M. Zhu, Rapid Commun. Mass Spectrom. 23, 1683–1693 (2009).
(12) A.C. Li, M.A. Gohdes, and W.Z. Shou, Rapid Commun. Mass Spectrom. 21, 1421–1430 (2007).
(13) H. Gao, O.L. Materne, D.L. Howe, and C.L. Brummel, Rapid Commun. Mass Spectrom. 21, 3683–3693 (2007).
(14) W. Zou and V. Tolstikov, "Predictive multiple reactions monitoring (pMRM) in Metabolomics," presented at the 5th Annual Metabolomics Society International Conference, Edmonton, Alberta, Canada, August, 2009.
(15) M. Holcapek, L. Kolarova, and M. Nobilis, Anal. Bioanal. Chem. 391, 59–78 (2008).
(16) Y.Y. Duan, X.C. Ma, W. Zou, C. Wang, I. Saramipoor, T. Ahuja, V. Tolstikov, and M.A. Zern, Differentiation and Characterization of Metabolically Functioning Hepatocytes from Human Embryonic Stem Cells 28, 674–686 (2010).
(17) E. Jones, "Predictive MRM Driven Analysis using LightSight software 2.0 and ACD/MS Processor," presented at the 56th ASMS Conference on Mass Spectrometry and Allied Topics, Denver, Colorado, June, 2008.
(18) T. Kind and O. Fiehn, BMC Bioinformatics 8, 105 (2007).
(19) T. Kind and O. Fiehn, BMC Bioinformatics 7, 234 (2006).
(20) W. Zou, Y.D. Wang, M. Gu, and V. Tolstikov, "Optimization of mass accuracy, spectral accuracy, and resolution in metabolite identification using LTQ-FT Ultra hybrid mass spectrometer," presented at the 57th ASMS Conference on Mass Spectrometry and Allied Topics, Philadelphia, Pennsylvania, June, 2009.
(21) H. Yasuor, W. Zou, V. Tolstikov, R. Tjeerdema, and A. Fischer, Plant Physiol. 153, 319–326 (2010).
(22) P. Tomco, D. Holstege, W. Zou, and R. Tjeerdema, J. Agric. Food Chem. 58, 3674–3680 (2010).
(23) W.K. Vencill, K.K. Hatzios, and H.P. Wilson, J. Plant Growth Regul. 9, 127–132 (1990).
(24) S.F. ElNaggar, R.W. Creekmore, M.J. Schocken, R.T. Rosen, and R.A. Robinson, J. Agric. Food Chem. 40, 880–883 (1992).
Wei Zou*, Hagai Yasuor, Albert J. Fischer, and Vladimir V. Tolstikov
*California State Department of Toxic Substances Control and Department of Plant Sciences, University of California. UC Davis Genome Center. Direct correspondence to: wzou@dtsc.ca.gov.

Accelerating Monoclonal Antibody Quality Control: The Role of LC–MS in Upstream Bioprocessing
This study highlights the promising potential of LC–MS as a powerful tool for mAb quality control within the context of upstream processing.
Using GC-MS to Measure Improvement Efforts to TNT-Contaminated Soil
April 29th 2025Researchers developing a plant microbial consortium that can repair in-situ high concentration TNT (1434 mg/kg) contaminated soil, as well as overcome the limitations of previous studies that only focused on simulated pollution, used untargeted metabolone gas chromatography-mass spectrometry (GC-MS) to measure their success.
Prioritizing Non-Target Screening in LC–HRMS Environmental Sample Analysis
April 28th 2025When analyzing samples using liquid chromatography–high-resolution mass spectrometry, there are various ways the processes can be improved. Researchers created new methods for prioritizing these strategies.
Potential Obstacles in Chromatographic Analyses Distinguishing Marijuana from Hemp
April 28th 2025LCGC International's April series for National Cannabis Awareness Month concludes with a discussion with Walter B. Wilson from the National Institute of Standard and Technology’s (NIST’s) Chemical Sciences Division regarding recent research his team conducted investigating chromatographic interferences that can potentially inflate the levels of Δ9-THC in Cannabis sativa plant samples, and possible solutions to avoid this problem.

.png&w=3840&q=75)

.png&w=3840&q=75)


.png&w=3840&q=75)


.png&w=3840&q=75)


