Tips & Tricks: Influence of Sample Dispersity on the GPC/SEC Separation of Multi-Component Systems
The main task of gel permeation chromatography/size-exclusion chromatography (GPC/SEC) is the determination of molar mass distributions and molar mass averages. For this purpose, broad peaks, mostly without fine structures, suffice. However, sometimes two- or multi-component systems must be analyzed, and the different components need to be separated for quantitation. While chromatographic conditions can be adjusted to achieve fully separated peaks in high performance liquid chromatography (HPLC) of low molar masses, this is often not the case in GPC/SEC. This instalment of Tips & Tricks focuses on whether a complete separation can be achieved using GPC/SEC and, if so, under what conditions.
Gel permeation chromatography/size‑exclusion chromatography (GPC/SEC) is usually applied to determine molar mass distributions and average molar masses. However, to adjust application properties, the use of polymer mixtures has increased over the years, which has led to a demand to quantify the amounts of the different polymeric components within a mixture. For this purpose, customers often attempt to apply GPC/SEC.
Ideally, GPC/SEC separates according to the size of macromolecules in solution. The size of a macromolecule is related to its molar mass. Thus, two polymers differing in molar mass can be expected to exhibit different hydrodynamic volumes, allowing for a separation by GPC/SEC.
The resolution for a particular sample analyzed in GPC/SEC can be enhanced using a column bank or column combination instead of a single column, as discussed in a previous issue of Tips & Tricks in GPC/SEC (1).
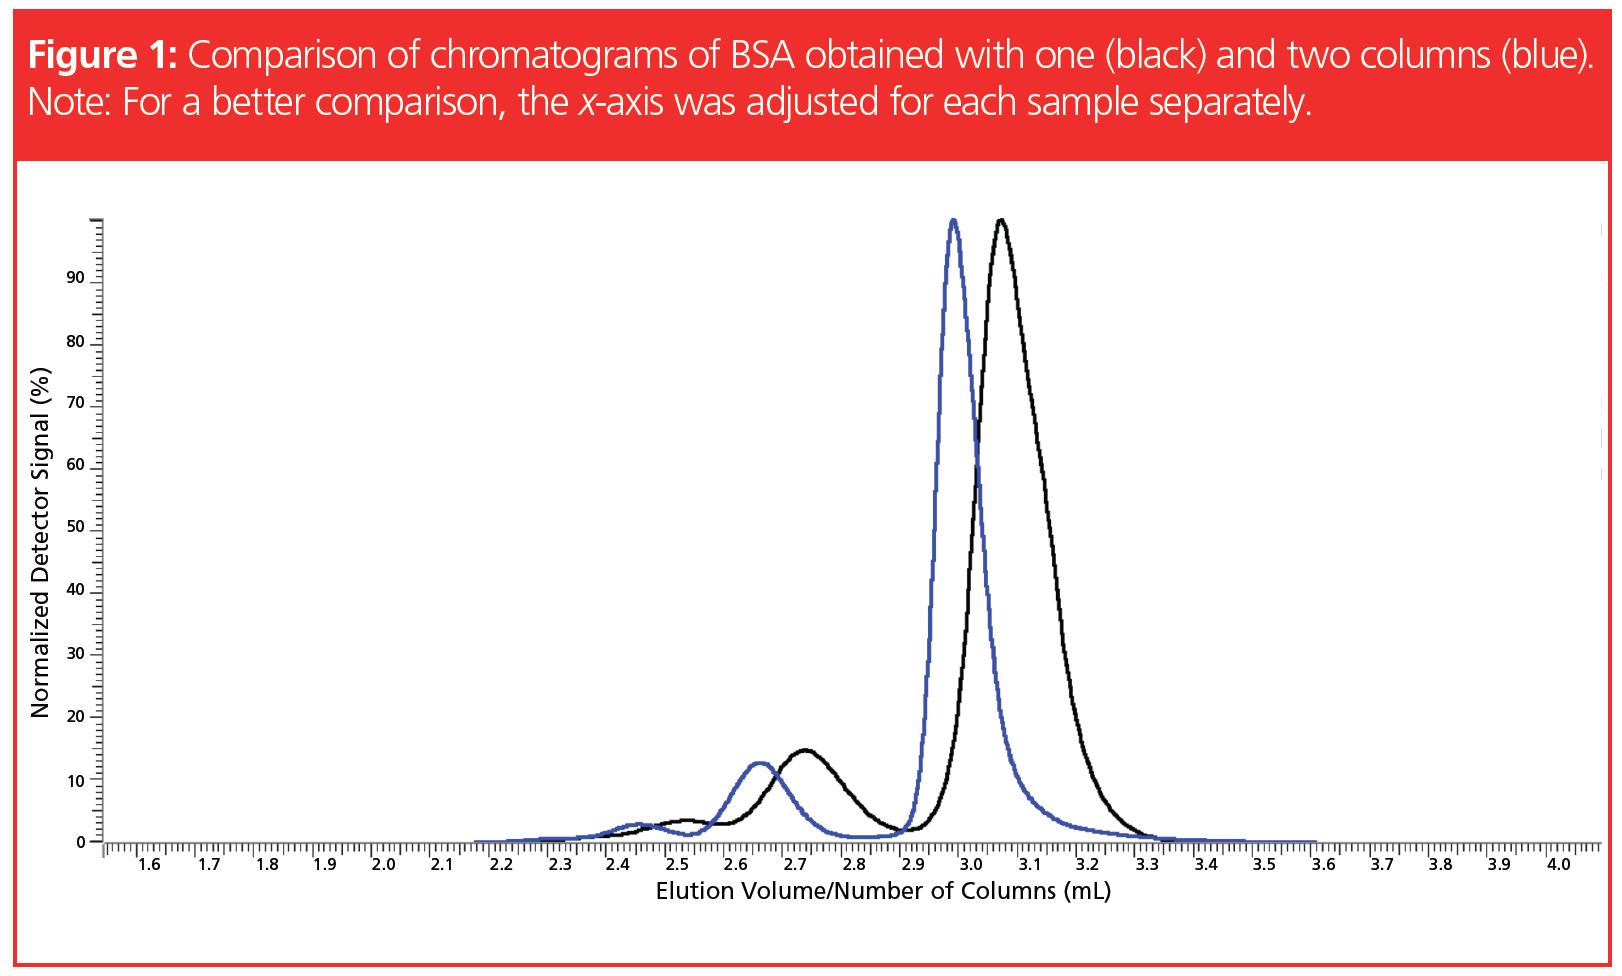
The effect of a prolonged separation path on the resolution is exemplarily shown in Figure 1, which compares chromatograms of bovine serum albumin (BSA) separated with a single column as well as with a set of two columns. The x-axis was adjusted to allow for direct comparison of the chromatograms, despite a different number of columns. In both chromatograms the peaks of monomer, dimer, and trimer are observed. However, the peak resolution of the blue curve is superior to the black chromatogram due to the increased column length. This is particularly visible when the heights of the peak minima between the peaks are compared.
Thus, when it is necessary to separate a mixture of two polymer samples differing in molar mass, and to quantify the amount of each component, it appears as if the task to be solved lies in finding a suitable column combination.
Figure 2 shows chromatograms of three narrowly distributed poly(ethylene glycol) standards run on a single column and on a column bank consisting of three identical columns. Again, the x-axis was adjusted to allow for direct comparison of the chromatograms, despite a different number of columns. The average molar masses of two adjacent peaks differ approximately by factor 2–3. The dispersities (D = Mw/Mn) lie below D = 1.1, and, under these conditions, a full baseline separation is almost achieved.
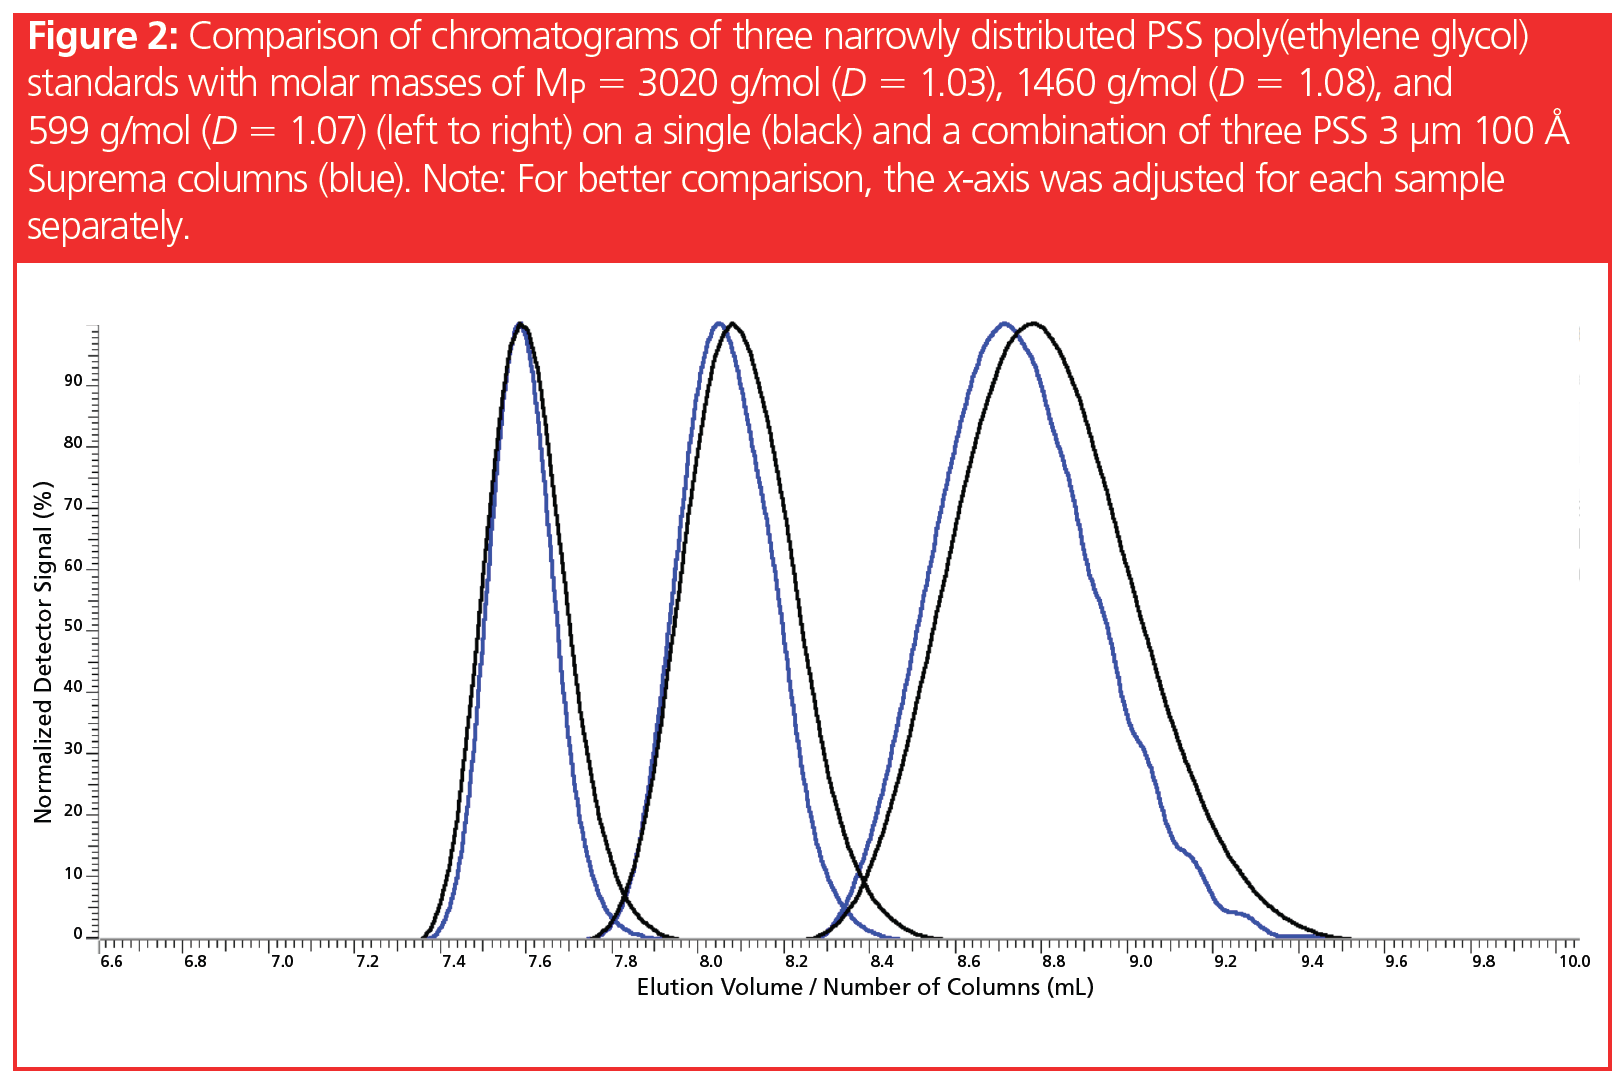
However, in contrast to the example shown in Figure 1, there is no substantial gain in resolution of two adjacent peaks despite increasing the column length by a factor of three.
Why can a distinct enhancement of resolution be observed in Figure 1 but not in Figure 2—although in both cases the column length was increased?
The answer lies in sample dispersity.
While in Figure 1 the individual peaks of monomer, dimer, and trimer correspond to monodisperse species, for which the peak width is dominated by band broadening effects, each peak in Figure 2 represents a sample exhibiting a—although narrow—molar mass distribution. This means that each peak does not contain molecules of only one specific molar mass and thus one specific hydrodynamic size, but is composed instead of a large number of very similar molecules differing in molar mass. Consequently, each peak of a given average molar mass consists of a large number of molecules of different sizes, resulting in a broadened chromatographic peak if separated by GPC/SEC.
Depending on the widths of the molar mass distributions, two samples differing in average molar masses may contain species of identical molar mass and thus identical size, which will elute at the same GPC/SEC elution volume. Such overlapping size distributions do not allow for a proper separation of each component by GPC/SEC, which makes quantitation difficult or even impossible.
This becomes clear in Figure 3, which shows the molar mass distribution of the same standards mixture as depicted in Figure 2. Indeed, both low molar mass standards contain molecules in the range of approximately 800–1100 g/mol, while both of the two higher molar mass peaks contain molecules within approximately 1500–2500 g/mol.
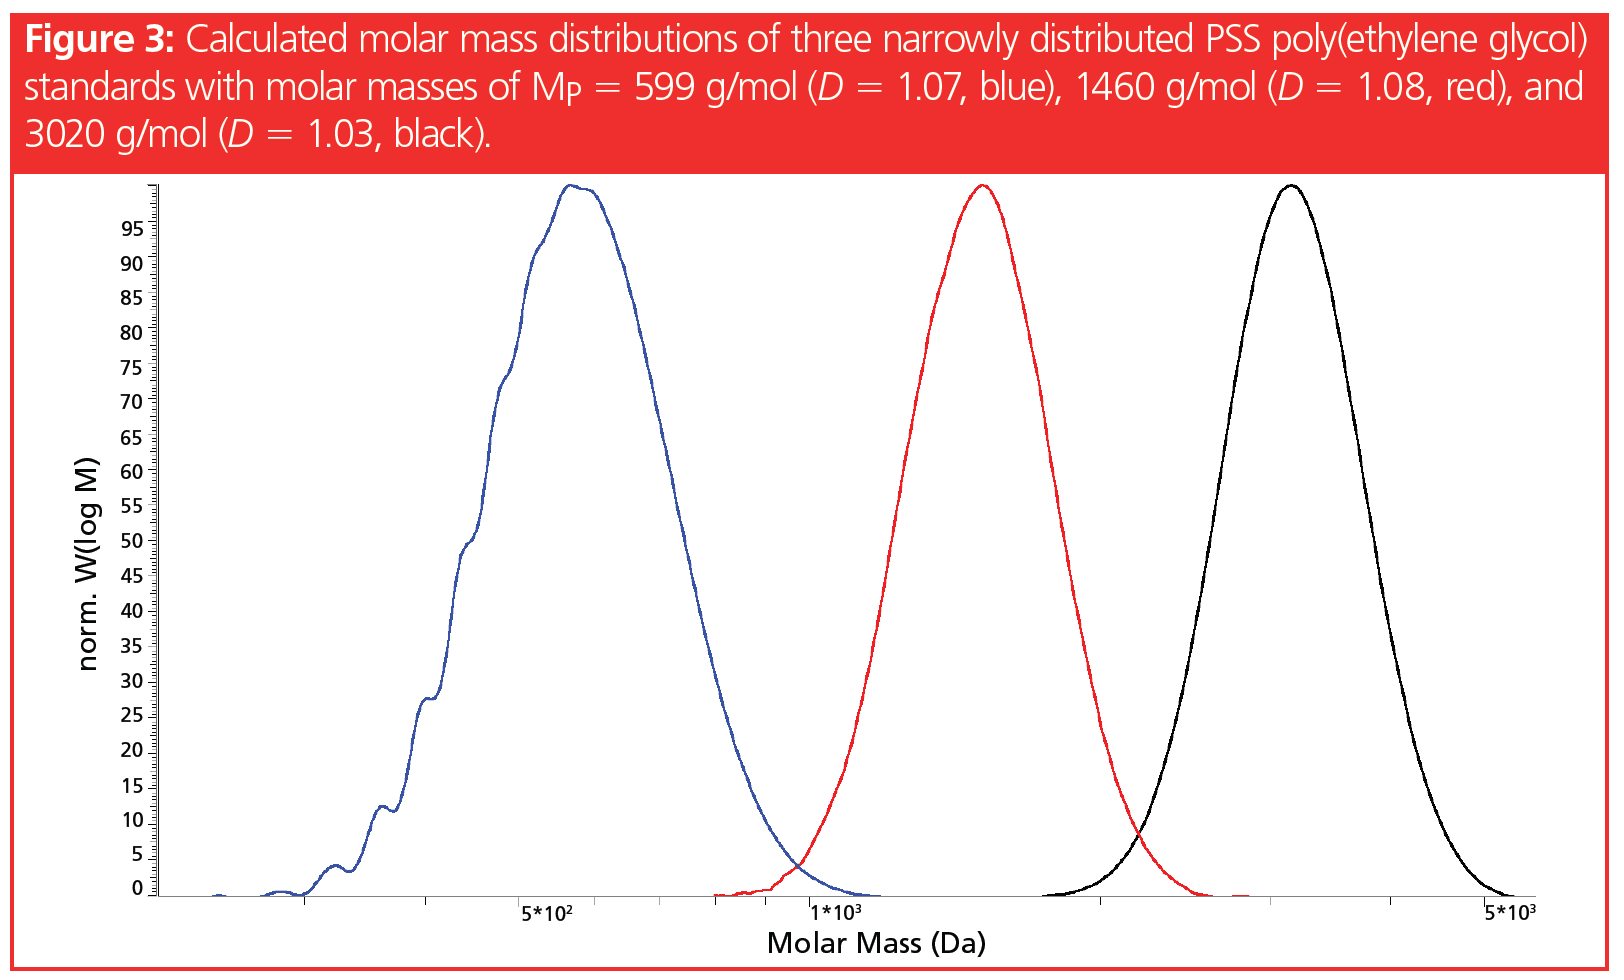
However, we can conclude from Figure 2 and Figure 3 that narrowly distributed samples can almost be baseline separated using suitable GPC/SEC columns, if their average molar masses differ by a factor of approximately 2–3. Therefore, the separation of narrowly distributed samples differing in average molar mass by factor 2–3 is possible in principle, as the molar mass distributions and therefore the size distributions do not severely overlap (Figure 3).
This instalment of Tips and Tricks in GPC/SEC will elucidate the effect of
molar mass (or more precisely, size) dispersity on the separation of polymer mixtures.
To get a better understanding of how dispersity affects separation in GPC/SEC, we will assume we have mixtures of two polymer samples that differ in their average molar mass. We will also assume that the same relationship between molar mass and hydrodynamic size exists for both polymer samples. Thus, identical molar masses in both distributions will correspond to identical hydrodynamic sizes and consequently to identical elution volumes in GPC/SEC.
We have seen that for narrowly distributed samples differing by a factor of 2–3 in molar mass, a good separation is possible. In industrial polymerization processes, narrowly distributed samples are, however, rarely produced. Samples prepared by free radical polymerization or polycondensation reactions feature typical dispersities of D > 1.5–2.
To investigate whether or to what extent separations of mixtures of such industrial samples can be achieved, we assume the samples to feature Schulz‑Flory distributions (2), with dispersities of D = 2.
Figure 4 shows calculated molar mass distributions for 50/50 (w/w) mixtures
of a sample with a weight-average molar mass of 2 × 10⁴ g/mol, and samples with weight-average molar masses of 4 × 10⁴, 6.7 × 10⁴, and 9.1 × 10⁴ g/mol.
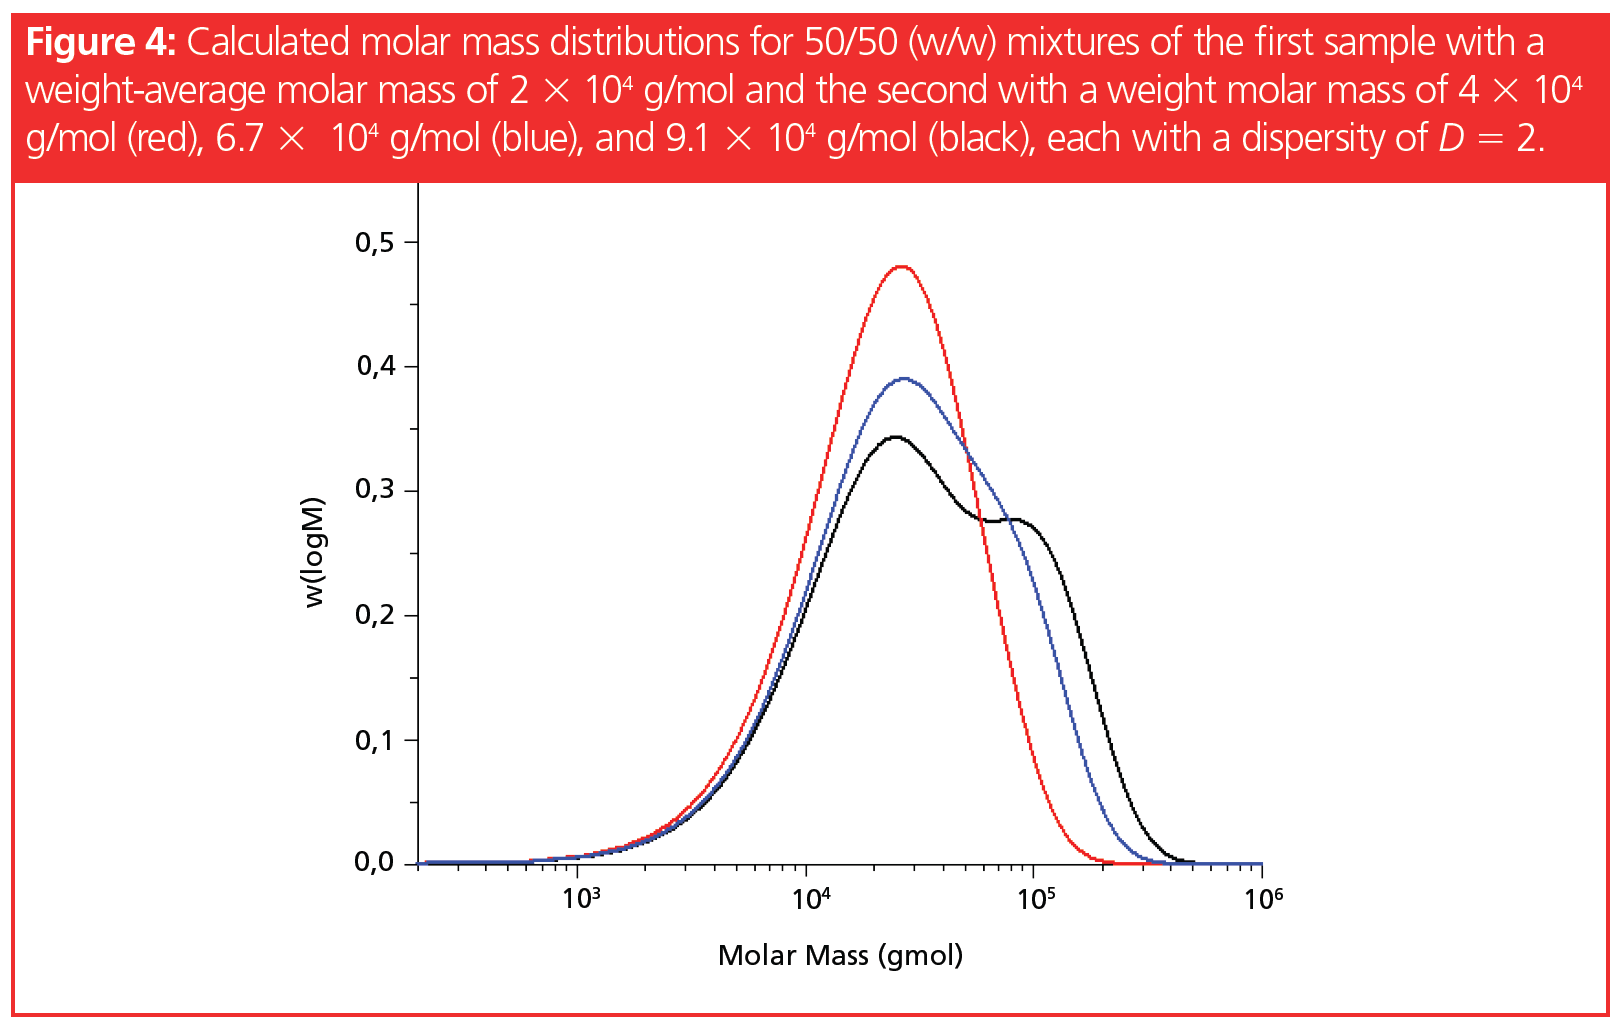
While for the narrowly distributed samples in Figure 2 a factor of 2 between the molar masses resulted in an almost baseline separation, the molar mass distribution of the 50/50 mixture of the two broadly distributed samples does not reveal any indication of the existence of two components mixed together, although the average molar masses of the components differ by the same factor of 2. Therefore, even on a well‑separating GPC/SEC column, the resulting chromatogram is expected to show only one broad monomodal uniform peak.
When the molar mass difference between the components corresponds to a factor of 3.3, a weak shoulder can be observed in the chromatogram of the two‑component mixture. However, this weak shoulder does not allow for quantitation of both components.
Only when the ratio of weight-average molar masses exceeds approximately a factor of 4.5 do two minima become visible in the molar mass distribution of the mixture.
Even if the average molar masses of two polymer samples, each featuring a dispersity of D = 2, differ by a factor of 10, a substantial overlap still exists in the molar mass distributions (Figure 5). Consequently, to separate the broadly distributed components for quantitation by GPC/SEC, the differences in their average molar masses must exceed approximately a factor of 10.
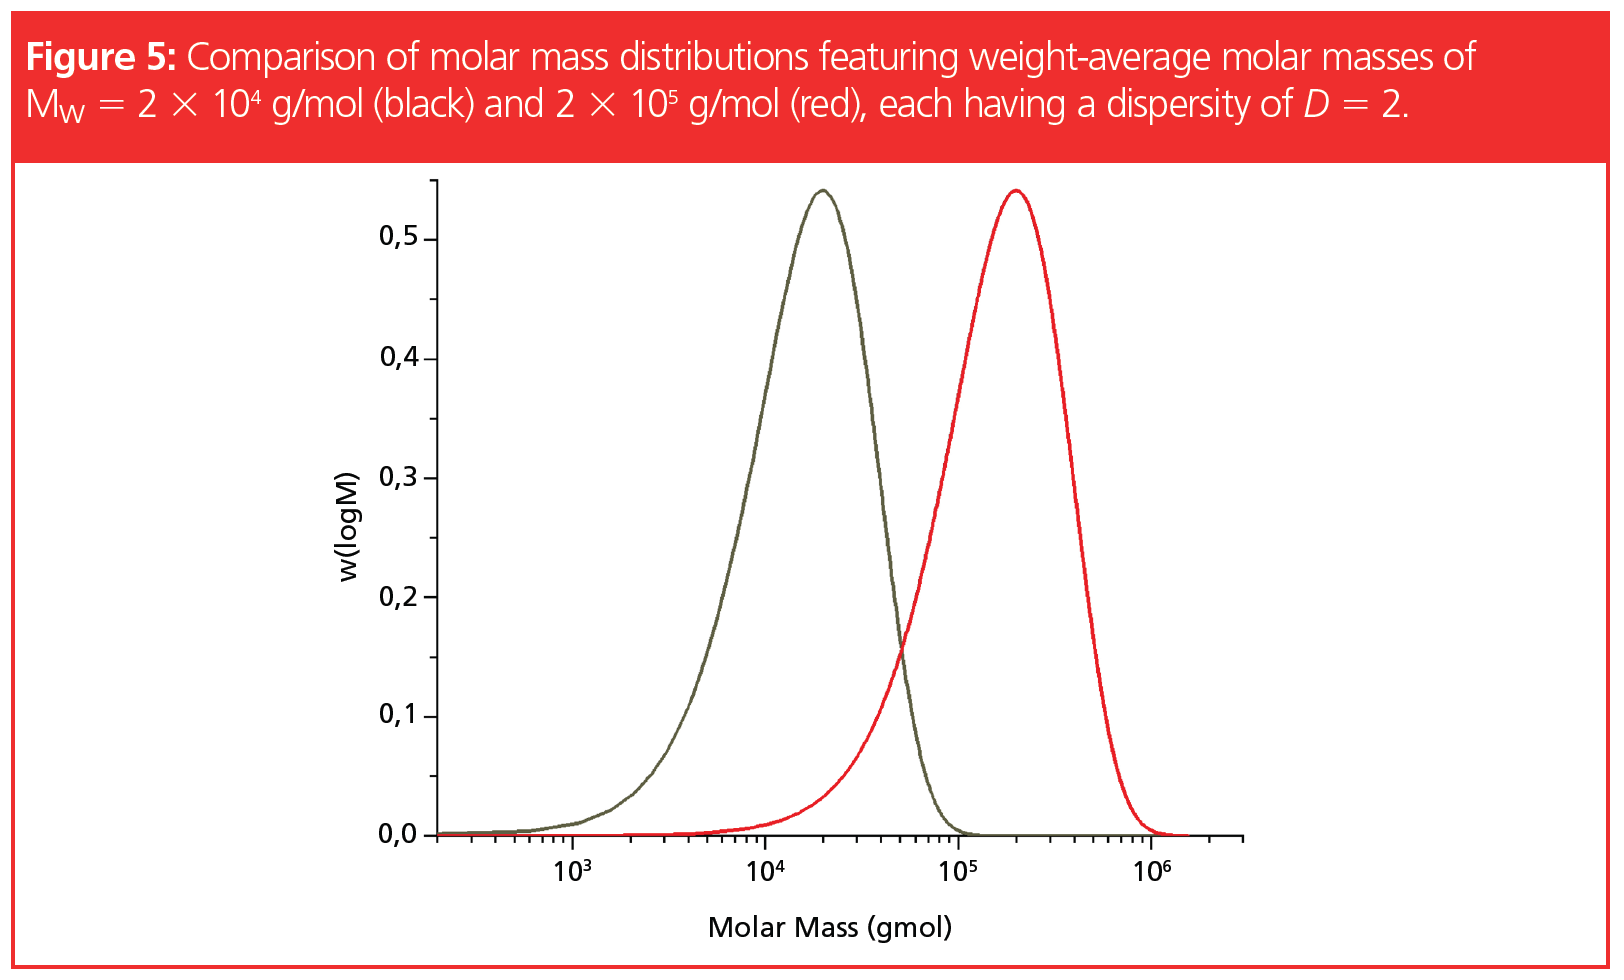
The problem of insufficient separation is related to the width of the molar mass distributions. In Figure 5, we see that the molar mass distribution of the sample with a molar mass of Mw = 2 × 10⁴ g/mol and D = 2 ranges from below 103 g/mol to above 105 g/mol. Likewise, the molar mass distribution of the sample exhibiting a molar mass of 2 × 10⁵ g/mol and D = 2 also covers approximately two orders of magnitude in molar mass.
Besides the differences in molar mass, the relative ratios of both components also affect whether separated peaks can be observed for each component. In Figure 6, a sample with a weight-average molar mass of 2 × 10⁴ g/mol is mixed with a sample with a molar mass of 6.7 × 10⁴ g/mol, each having a dispersity of D = 2. The weight ratio of both components was varied to investigate the effect of the weight ratio on peak overlap.
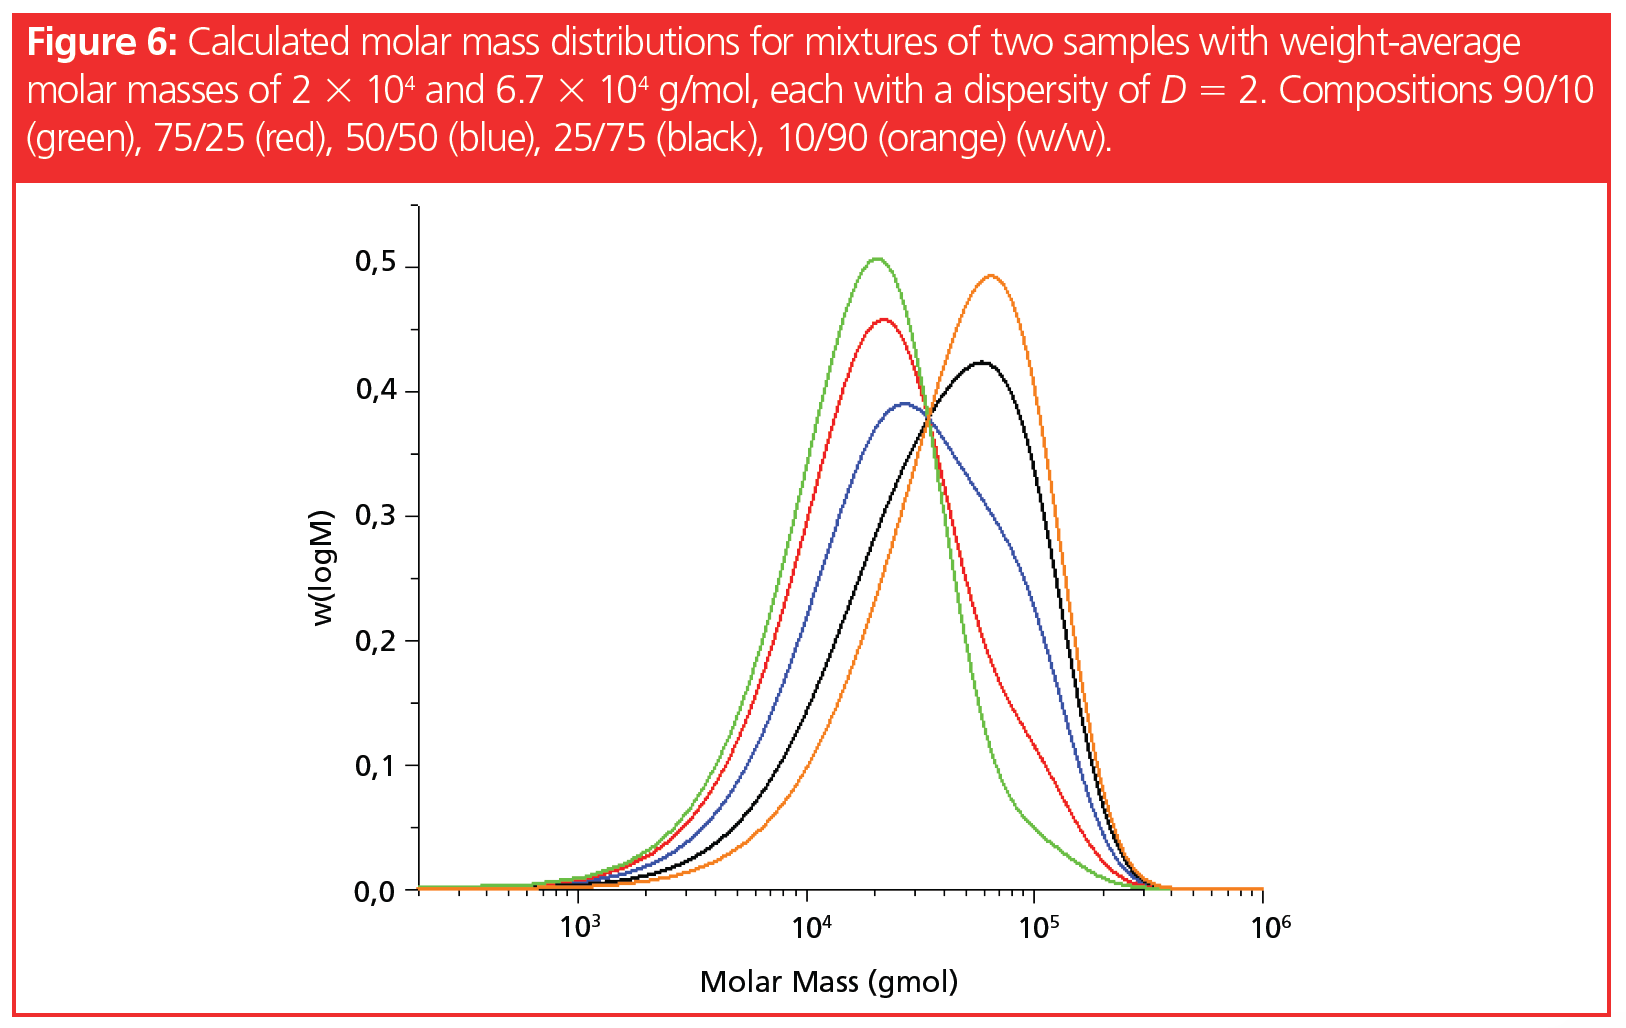
Adding a small amount (10%) of the high molar mass component to the lower molar mass component resulted in a weak shoulder at the high molar mass side of the distribution, while the addition of 10% of the low molar mass to the high molar mass component did not reveal any indication of the existence of a mixture. Again, quantitation is not possible without further information on the components.
It should be stressed that the insufficient separation of both components does not result from insufficient resolution of the GPC/SEC column or column combination but instead results from identical molar masses being present in both components of the two-component mixture. Therefore, enhancing the resolution by changing the GPC/SEC column or column combination will not overcome the general problem of overlapping molar mass (size) distributions.
In the calculations shown before, the problem of insufficient separations was discussed based on molar mass distributions. However, GPC/SEC separation relies on the molecular size (hydrodynamic volume) in solution and is not based on molar mass. Therefore, two polymers of identical molar mass might differ in their hydrodynamic size and might therefore elute at different elution volumes. However, this shift is usually not sufficient to overcome the effect of the peak width of broadly distributed samples.
If the molar mass distribution for each individual component of the mixture is known, quantitation might be possible using more sophisticated computational approaches, even for mixtures of chemically identical components.
If the sample components differ in their chemical composition, selective detection can be helpful to overcome the separation issue. Alternatively, separations by interaction chromatography might be an option.
Summary
The success of GPC/SEC to separate mixtures of polymers strongly depends on sample dispersity and difference in molar mass (hydrodynamic size).
Almost baseline resolution can be achieved for narrowly distributed samples, provided their weight-average molar masses differ by a factor of approximately 2.
For 50/50 mixtures of typical technical samples, each featuring a dispersity of D = 2, the molar mass distributions do not show any indications for a two‑component mixture as long as the molar mass averages differ by a factor less than approximately 3.5.
The observation of a second maximum in 50/50 mixtures of broadly distributed samples requires the average molar masses to differ by a factor of at least 5.
Quantifying the amounts of broadly distributed samples in a mixture requires the average molar masses to differ by a factor of more than 10.
A minority amount of a broadly distributed sample of high molar mass in a majority of a broadly distributed polymer of low molar mass is easier to detect than a minority of low molar mass polymer in a high molar mass sample.
The limited capability to separate mixtures of broadly distributed samples is not related to insufficient separation capabilities of the GPC/SEC column or column combination, but it is a consequence of the width of the molar mass distributions.
References
- D. Held and W. Radke, The Column 17(4), 26–30 (2021).
- J. Brandrup, E.H. Immergut, and E.A. Grulke, Polymer Handbook (Wiley, New York, USA, 1999)II/354.
Miriam Lossa studied applied chemistry (B.Sc.) and completed her masters in bioanalytical chemistry and pharmaceutical analysis (M.Sc.) at Hochschule Fresenius in Idstein (Germany). She works at PSS in the R&D department, with a focus on the analysis of biopolymers.
Jasmin Preis studied polymer chemistry in Mainz (Germany) and is senior director of the chemical production department at PSS. She works on porous particles for chromatographic applications, as well as on polymer characterization using SEC coupling techniques.
Wolfgang Radke studied polymer chemistry in Mainz (Germany) and Amherst (Massachusetts, USA) and is head of the PSS application development department. He is also responsible for instrument evaluation and for customized trainings.

Regulatory Deadlines and Supply Chain Challenges Take Center Stage in Nitrosamine Discussion
April 10th 2025During an LCGC International peer exchange, Aloka Srinivasan, Mayank Bhanti, and Amber Burch discussed the regulatory deadlines and supply chain challenges that come with nitrosamine analysis.


