Tips & Tricks GPC/SEC: Flow Marker — An Easy Concept to Increase Reproducibility
The Column
Experienced gel permeation chromatography/size-exclusion chromatography (GPC/SEC) users know that equilibration of the columns takes much longer than the time needed by the pump to produce a constant flow. An analysis in this phase would clearly yield different results from those achieved after complete equilibration of GPC/SEC columns. Furthermore, false but constant flow rates affect the molar masses derived from a GPC/SEC calibration curve. An internal flow marker can help to increase reproducibility and accuracy of GPC/SEC results.
Daniela Held and Wolfgang Radke, PSS Polymer Standards Service GmbH, Mainz, Germany.
Photo Credit: iconeer/Getty Images

Experienced gel permeation chromatography/size-exclusion chromatography (GPC/SEC) users know that equilibration of the columns takes much longer than the time needed by the pump to produce a constant flow. An analysis in this phase would clearly yield different results from those achieved after complete equilibration of GPC/SEC columns. Furthermore, false but constant flow rates affect the molar masses derived from a GPC/SEC calibration curve. An internal flow marker can help to increase reproducibility and accuracy of GPC/SEC results.
Gel permeation chromatography/sizeâexclusion chromatography (GPC/SEC) is a relative method because to determine molar masses a calibration curve is required. The calibration curve correlates the experimentally determined elution volumes to the molar masses. The elution volumes depend mainly on the system setup and the columns used but also on the actual analytical conditions including temperature and the thermodynamic conditions of the stationary phase.
For accurate results and high reproducibility a constant flow rate and identical swelling of the stationary phase during calibration and analysis are essential. As long as these can be assured, the calibration curve will be stable for a long time. However, small deviations of the measured elution volume can have a significant influence on the results. Even a slight shift in elution volume can result in severe changes in the determined molar masses. This is one of the points where GPC/SEC significantly differs from other liquid chromatography (LC) techniques, such as high performance liquid chromatography (HPLC).
A very precise elution is also required for all operations where sample chromatograms are compared or overlaid, for example, for degradation studies or sieve curve analysis.
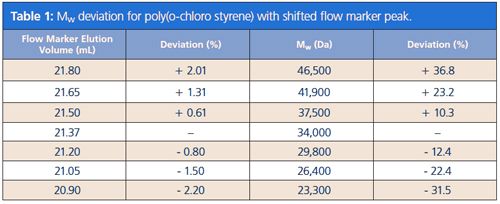
In a small study we investigated how strongly the determined mass average molar mass (Mw) is affected, when the flow rate or thermodynamic conditions deviate from those during calibration. The deviations from calibration conditions have been monitored by determining the elution volume of a flow marker or internal standard that has been added to all injected samples and calibration solutions.
As can be seen in Table 1, the shift in molar mass does not have a linear relationship with the flow marker shift. In general it can be concluded that the deviation is more pronounced for columns with less resolution and steeper calibration curves.

What Can Be Used as a Flow Marker?
Typically flow markers are low molar mass substances that are added to the solvent and are used to prepare the calibration and sample solutions. Prerequisites for suitable flow marker candidates are solubility in the mobile phase, detectability, no interaction with the analytes, and no co-elution with system peaks or low molar mass sample components (residual solvent, oligomers etc.). In addition strong negative peaks should not elute close to the flow marker because they might influence the peak maximum of the flow marker.
Commonly used flow markers for organic separations in tetrahydrofuran (THF) are acetone, butylated hydroxytoluene (BHT), toluene, or sulphur. The presence of low molar mass compounds determines which flow marker can be used. Sulphur has the advantage of eluting very late, therefore reducing the danger of co-elution. For DMF/DMAc methyl benzoate has been successfully tested. In aqueous GPC/SEC ethylene glycol (EG) or (under basic conditions, for example, phosphate buffer pH = 9) benzoic acid can be applied. Most of the substances mentioned above have the advantage that they are UV-detectable, allowing very low concentrations to be used, thereby eliminating any disturbance of the refractive index (RI) trace. In other cases such as EG, RI detection is required.
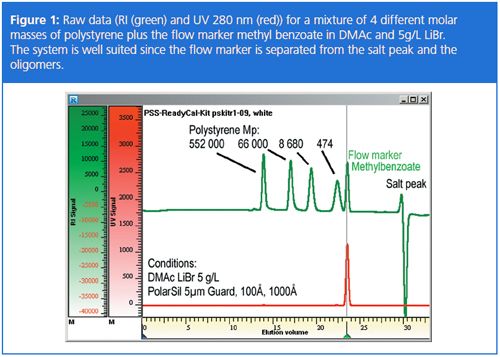
Figure 1 shows an example of a successful analysis with a flow marker. Here methyl benzoate has been added to the solution of four different polystyrene molar mass reference standards in DMAc with 5g/L LiBr. The raw data shows that the flow marker is clearly separated from the oligomer (Mp = 474 Da) and from the typical salt peak occurring in this eluent. A concentration of 1 mg/mL had been used but it would be possible to work with a much lower concentration because signal intensity is more than sufficient.

The concentration of a flow marker is in most cases not a critical parameter. However, it is recommended to start with a concentration of 200 ppm or 0.2 mg/mL. This can be reduced if the signal intensity is sufficient. If sulphur is used it is important to keep the concentration constant.
How To Use a Flow Marker
The most important point here is to understand that the flow marker concept standardizes chromatographic conditions. Using this approach will ensure that calibration and sample analysis conditions are equal. On the other hand this means that both calibrants and samples have to be treated the same way.
So a general approach can be:
1. Flow Marker Selection:
Decide on a flow marker and add in a defined concentration to the solvent that will be used to prepare the calibration and unknown samples.
Dissolve the calibration standards and the samples using this mixture and inject them.
A distinct peak for the flow marker should be visible. Determine the elution volume of this peak; here either several injections can be averaged or a reference value can be directly chosen.
2. Apply Conditions to Calibration Standards and Construct the Calibration Curve:
The next step is to assign the reference value to the calibration samples. This means that the complete elution volume axis will be recalculated slice by slice according to equation 1:
Vi (corrected) = Vi, original × (V flow marker, ref. value/ V flow marker) [1]
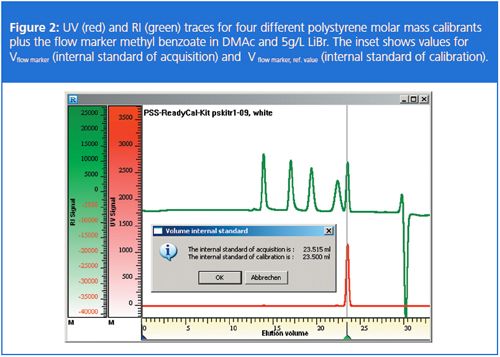
After applying this equation, the elution volume of the flow marker is recalculated to be identical with that of the reference value. GPC/SEC software packages normally offer this correction within the program. The correction can also be calculated manually, however, special care has to be taken to avoid changing the peak form or area. Figure 2 shows the flow rate recalculation for one injection of the calibration sample.

The calibrants can now be used to construct the calibration curve by reading the elution volume and plotting it against the logarithm of the molar mass at the peak maximum. It is important to note that once the calibration curve is created it is only valid for this setup including this reference value for the flow marker.
3. Analyze Samples, Perform Flow Rate
Internal Standard Correction, Assign
Calibration Curve:
Once the calibration curve is constructed unknown samples can be measured. Their elution volume also needs to be recalculated using equation 1; then the calibration curve can be used to obtain the molar mass distribution and the averages.
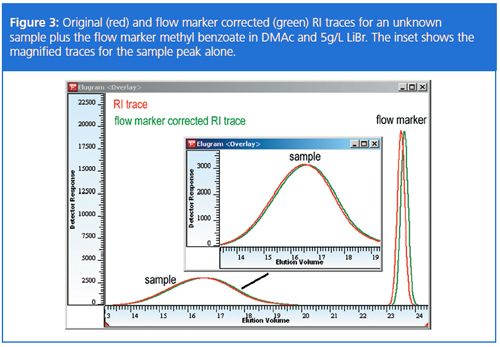
Figure 3 shows an example for the recalculation of an unknown sample. In this example the elution volume of the flow marker was smaller than the reference value. The figure inset shows the magnified traces before and after recalculation for the sample peak. It can be seen that the sample trace is also affected by the shift as well as the flow marker peak.

The use of the flow marker as an internal standard eliminates the need for re-calibration as long as no system modifications are performed. Using an internal standard is also a cheap and easy measure of system stability because it allows long-term variation in system performance to be traced.
Nevertheless, checking with a control sample is always recommended to detect problems such as an unintentionally changed stationary phase polarity or pore size distribution.
In Which Situations Does the Procedure Fail?
This approach will only work when the flow rate change is constant for the entire time span. It can easily compensate for deviations that result from a consistently too high or low flow rate compared to the flow rate conditions during calibration. It cannot be applied for continuously increasing or decreasing flow rates or short-term, non-random fluctuations of the flow rate.
A flow rate marker is a very sensitive tool to identify problems. Large deviations between the original elution volume and the actual elution volume of the flow marker indicate problems with the system (pump, leak, columns, etc.). In this case troubleshooting is required to identify the source of the elution volume shift. Usually GPC/SEC software packages will not allow for flow correction if the deviation is above a certain percentage.
The addition of a flow rate marker should be avoided if co-elution with low molar mass compounds in the sample might occur. This could result in the peak maximum of the flow marker being shifted and this correction could lead to an incorrect result. Co-elution will also complicate the quantification of oligomers, residual monomer, solvent, and educts. In this case the use of a different, late-eluting flow marker could help (for example, sulphur). In addition, procedures have been applied where blank samples with an added flow marker have been injected before and after the sample to verify that calibration conditions are still met. Other alternatives would be a high molar mass flow marker or to calibrate before and after the sample run, however, this approach is very timeâconsuming.
Some sources recommend using salt or system peaks as flow markers when no other flow markers can be found. However, this approach requires careful evaluation because intensity and position of the salt or system peaks can shift with time or with the sample. In such cases it might be even better to work without a flow marker and to provide sufficient equilibration time prior to and after analysis.
Summary
- Flow markers can be used to identify problems with an LC system and to increase accuracy and reproducibility of GPC/SEC results.
- Flow marker corrections are important for all applications that compare chromatograms from different runs, for example, for degradation studies or sieve curve analysis.
- The vast majority of flow markers are low molar mass substances; coâelution with low molar mass sample compounds and salt peaks needs to be avoided.
- Salt or system peaks are not well suited as flow markers. It should be checked that the position does not change with time, solvent quality, or samples injected.
Daniela Held studied polymer chemistry in Mainz, Germany, and works in the PSS software and instrument department. She is also responsible for education and customer training.
Wolfgang Radke studied polymer chemistry in Mainz, Germany, and at Amherst (Massachusetts, USA) and is head of the PSS application development department. He is also responsible for the PSS customer training programme and for customized trainings.
E-mail: DHeld@pss-polymer.com
Website: www.pss-polymer.com

Common Challenges in Nitrosamine Analysis: An LCGC International Peer Exchange
April 15th 2025A recent roundtable discussion featuring Aloka Srinivasan of Raaha, Mayank Bhanti of the United States Pharmacopeia (USP), and Amber Burch of Purisys discussed the challenges surrounding nitrosamine analysis in pharmaceuticals.
Extracting Estrogenic Hormones Using Rotating Disk and Modified Clays
April 14th 2025University of Caldas and University of Chile researchers extracted estrogenic hormones from wastewater samples using rotating disk sorption extraction. After extraction, the concentrated analytes were measured using liquid chromatography coupled with photodiode array detection (HPLC-PDA).


