Tips & Tricks: A Few Things Chromatograms Can (and Can’t) Tell
Gel permeation chromatography/size-exclusion chromatography (GPC/SEC) is the major chromatographic separation technique in macromolecular science. It allows molar masses and molar mass distributions of macromolecular samples to be determined. In GPC/SEC, a sample containing a mixture of macromolecules is separated based on their hydrodynamic sizes in solution using a column filled with porous particles. Macromolecules larger than the pores cannot enter, while for molecules much smaller than the pore sizes no substantial difference in elution volume is observed. Macromolecules of a size comparable to the pore size can enter the pores and will elute from the column at a retention time depending on their size to pore size ratio.
The chromatogram, that is, the detector response of the eluting fraction as a function of elution volume, provides the primary information of GPC/SEC. Assigning a molar mass to a specific elution volume requires the establishment of a calibration curve using suitable standards or advanced detectors. The molar masses derived by GPC/SEC depend on the applied calibrant. That is why molar masses determined by GPC/SEC are referred to as relative molar masses.
The Different Appearances of Chromatograms on Different Columns
The chromatogram obtained for a particular sample not only contains information on the molar mass distribution of the sample but also depends on instrumental and method parameters, of which the pore size distribution of the column or column combination applied is the most important one. Therefore, a comparison of chromatograms of a particular sample obtained on different column sets might be completely misleading.

This is illustrated in Figure 1, which shows the chromatograms of the same mixture of polystyrene standards obtained on two different column combinations. Both chromatograms look totally different. The first chromatogram reveals a series of oligomers between 32.5–37.5 mL elution volume, which are not resolved in the second chromatogram. The reason for the different chromatograms is the different pore sizes contained in the two column combinations. While the second column combination is optimized for higher molar mass separations and thus provides a rather broad pore size distribution—from very large down to small pores—the first column combination was designed to offer mainly small pores to provide a good separation for low molar mass oligomers. The absence of very large pores for the first column combination results in a higher slope of the calibration curve at high molar masses, reducing the separation of the highest molar mass standards. This explains why the two highest molar mass standards elute close to each other, despite differing by more than one order in molar mass.
Figure 1 also shows that running the same sample on different columns might not only affect peak shape but might also result in a different number of peaks. Due to the enhanced resolution for low molar masses on the first column combination, the last standard is separated into at least seven individual oligomers, while it appears as a single peak on the second column combination.
As the slope of the calibration curve defines the elution range over which a given molar mass range is separated, peaks of similar dispersity index might reveal different peak widths, depending on whether the calibration curve exhibits a steep or shallow slope in the region of sample elution.
Therefore, a comparison of chromatograms obtained on different column combinations can not reveal identity or similarities between samples!
Bimodal Chromatograms and Bimodal Distributions
Drawing conclusions on mono- or multimodality of molar mass distributions from chromatograms can also be dangerous.

Take a look at the chromatograms in Figure 2(a), obtained for four different broadly distributed polystyrene samples. While the green and blue samples exhibit nearly Gaussian peak shapes, the black chromatogram reveals a clear shoulder. The red chromatogram shows a strong tailing. Therefore, one might conclude that the black and red samples are mixtures of two distributions, partially separated from each other. This conclusion is incorrect, however. The observed bimodalities do not reflect bimodal molar mass distributions but are the consequence of an inappropriate mixture of pore sizes of the applied column combination.
By either combining columns of different pore size or by mixing particles of different pore sizes in a single column, one needs to adjust the relative fractions of the different pores in such a way that a nearly constant slope of the calibration curve results (1). A sudden change in the slope of the calibration curve or a lack or overrepresentation of a particular pore size will generate either a too effective or an insufficient separation within a specific molar mass range. Too many pores of a specific size will result in elution of a specific molar mass range over a large elution volume range, leading to a low concentration. On the other hand, a lack of suitable pore sizes will result in elution of a broad molar mass range within a narrow elution volume, resulting in high local concentration. These effects are named porosity mismatch or dislocation. Unfortunately, detection of column mismatch or dislocation is not trivial. Only in extreme cases can column mismatch be identified from the calibration curve itself. This is due to the fact that mismatch or dislocation occurs only in a rather restricted molar mass range, such that the narrowly distributed molar mass standards applied to establish the calibration curve cannot pick up the “kink” of the true calibration curve. By fitting the calibration data with a calibration curve, the kink is even more blurred and will thus not be detected. More information on porosity mismatch and dislocations and how columns need to be combined can be found in the literature (1,2,3). Applying a column combination of appropriately adjusted pore size distributions will provide non-disturbed chromatograms, as shown in Figure 2(b).
Shoulders or additional peaks in a chromatogram can also be caused by high molar mass fractions of material approaching the column’s exclusion limit.
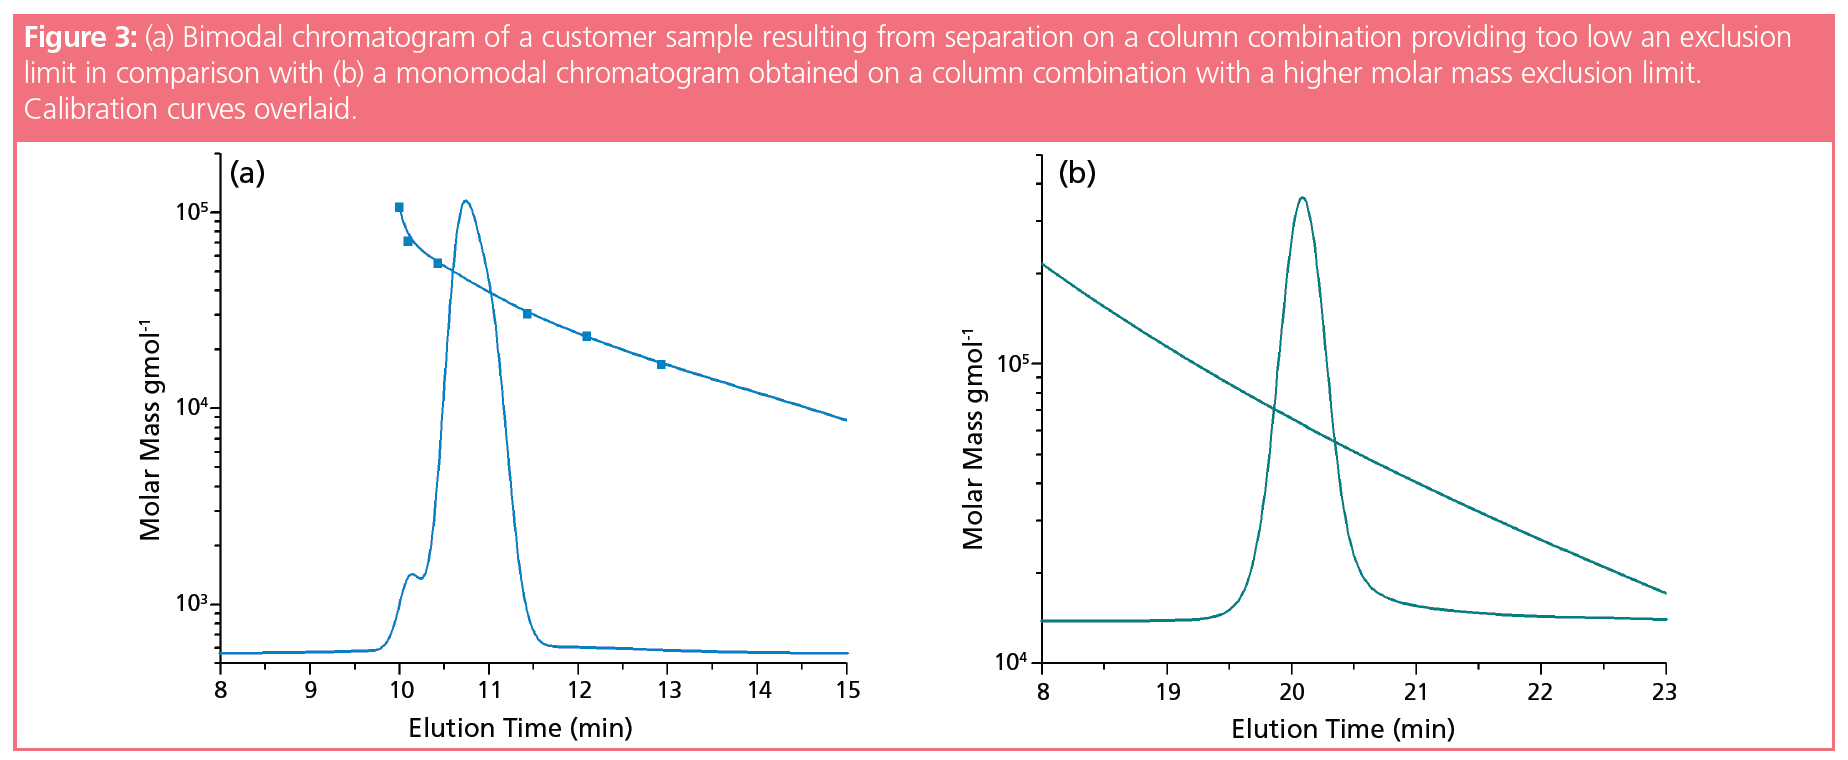
As has been discussed in conjunction with Figure 1, when high molar mass fractions approach the column’s exclusion limit, they are not efficiently separated any longer. Thus, the concentrations of fractions of different molar mass elute very close to each other, piling up in concentration and giving the impression of a separate peak. This “exclusion peak” is an artefact and can be eliminated by using a (suitable) column of appropriate pore size.

A recent example from our laboratory is shown in Figure 3(a). A customer observed a bimodal distribution with two insufficiently resolved narrow peaks and asked for advice about which column combination would provide a better resolution of both peaks. Based on the molar mass information provided by the customer, a column combination was chosen that was expected to provide the requested separation. However, using a column combination on which the sample eluted well within the separation range resulted in a single peak of narrow profile (Figure 3[b]), rather than in two better separated peaks. After obtaining information on the calibration curve of the column applied by the customer, it became clear that the sample eluted close to the column exclusion limit on the customer’s column, generating the artefact of an exclusion peak.
These examples show that the selection of the column combination significantly influences the appearance of the sample chromatogram.
Therefore, one cannot conclude a molar mass distribution’s bimodality from a chromatogram without careful consideration of the column’s pore size distribution.
The Difference Between RI and UV Detector Traces
Application of UV detection in addition to the common refractive index (RI) detector has become popular in GPC/SEC for the quantitative analysis of chemically heterogeneous systems. Application of two concentration detectors, such as UV and RI, allows the composition of the individual components and the composition at each elution volume to be determined. With this information the molar mass for a copolymer can be calculated at each elution volume, rendering more reliable molar masses as calculated from a conventional calibration curve using only a RI detector.
However, even without such extensive calibrations and calculations, information on chemical heterogeneity can be obtained by comparing the chromatograms of UV and
RI detectors.
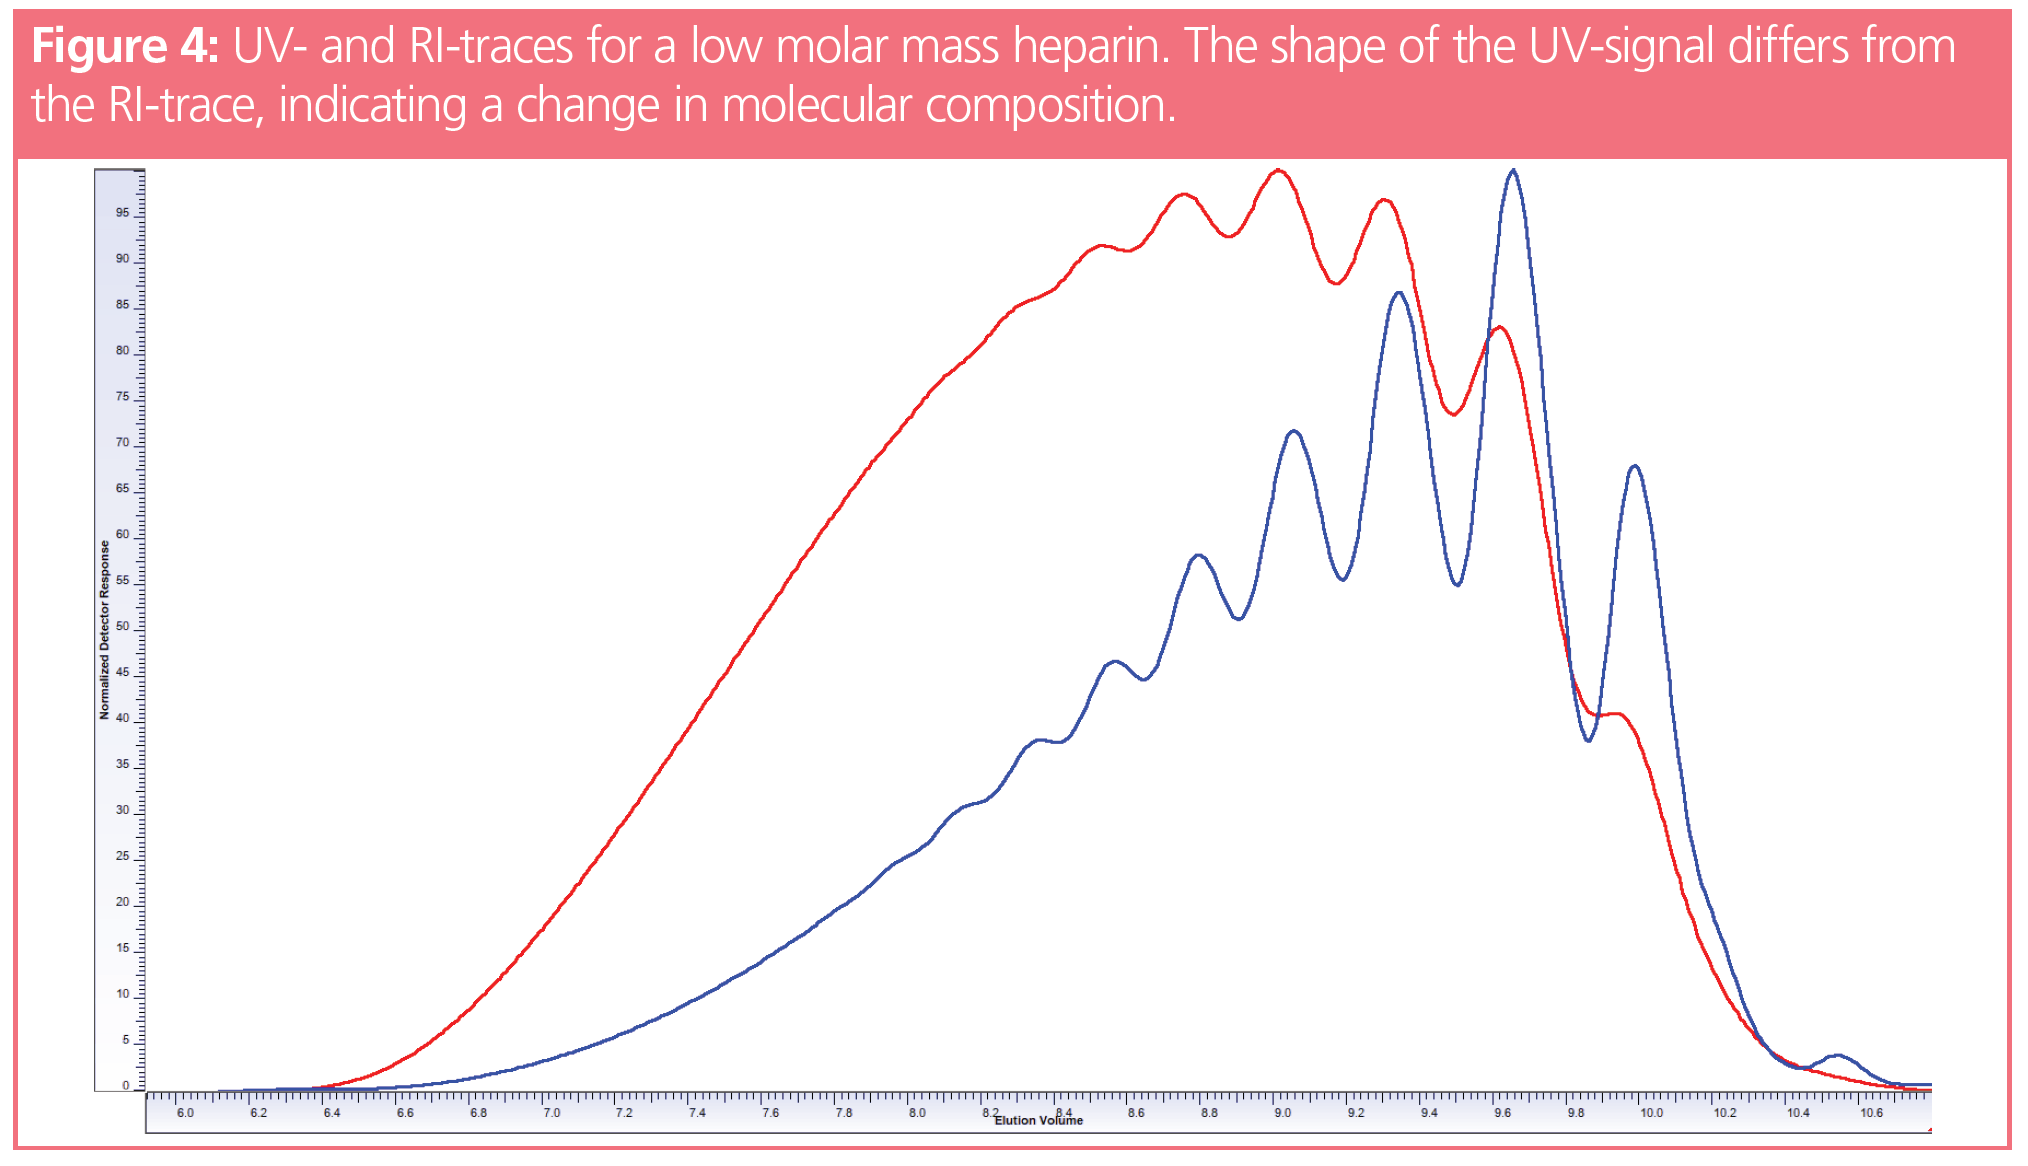
The chromatograms in Figure 4 show the UV- and RI-traces of an end group functionalized low molar mass heparin. Since the UV- and RI‑traces differ from each other, the molar masses will vary depending on which detector signal is applied to calculate the molar mass. However, this will not be discussed in this instalment of Tips and Tricks in GPC/SEC and so we direct the reader to reference 4.

However, the pure observation of significant differences in the shapes of the RI- and UV‑traces provides the information that the composition of the sample varies with elution volume. This might be due to the polymer either containing a UV-active end group or it might indicate the existence of a copolymer in which the individual chains differ in their chemical composition.
In the previous example, the UV-signal was due to UV-active end groups. Therefore, the UV detector detects the number of eluting molecules. In contrast, the RI-signal was proportional to the number of repeating units eluting from the column. At a given number of monomers (concentration, RI-signal), the number of end groups increases with decreasing molar mass, giving rise to a more intense UV-signal the lower (higher) the molar mass (elution volume).
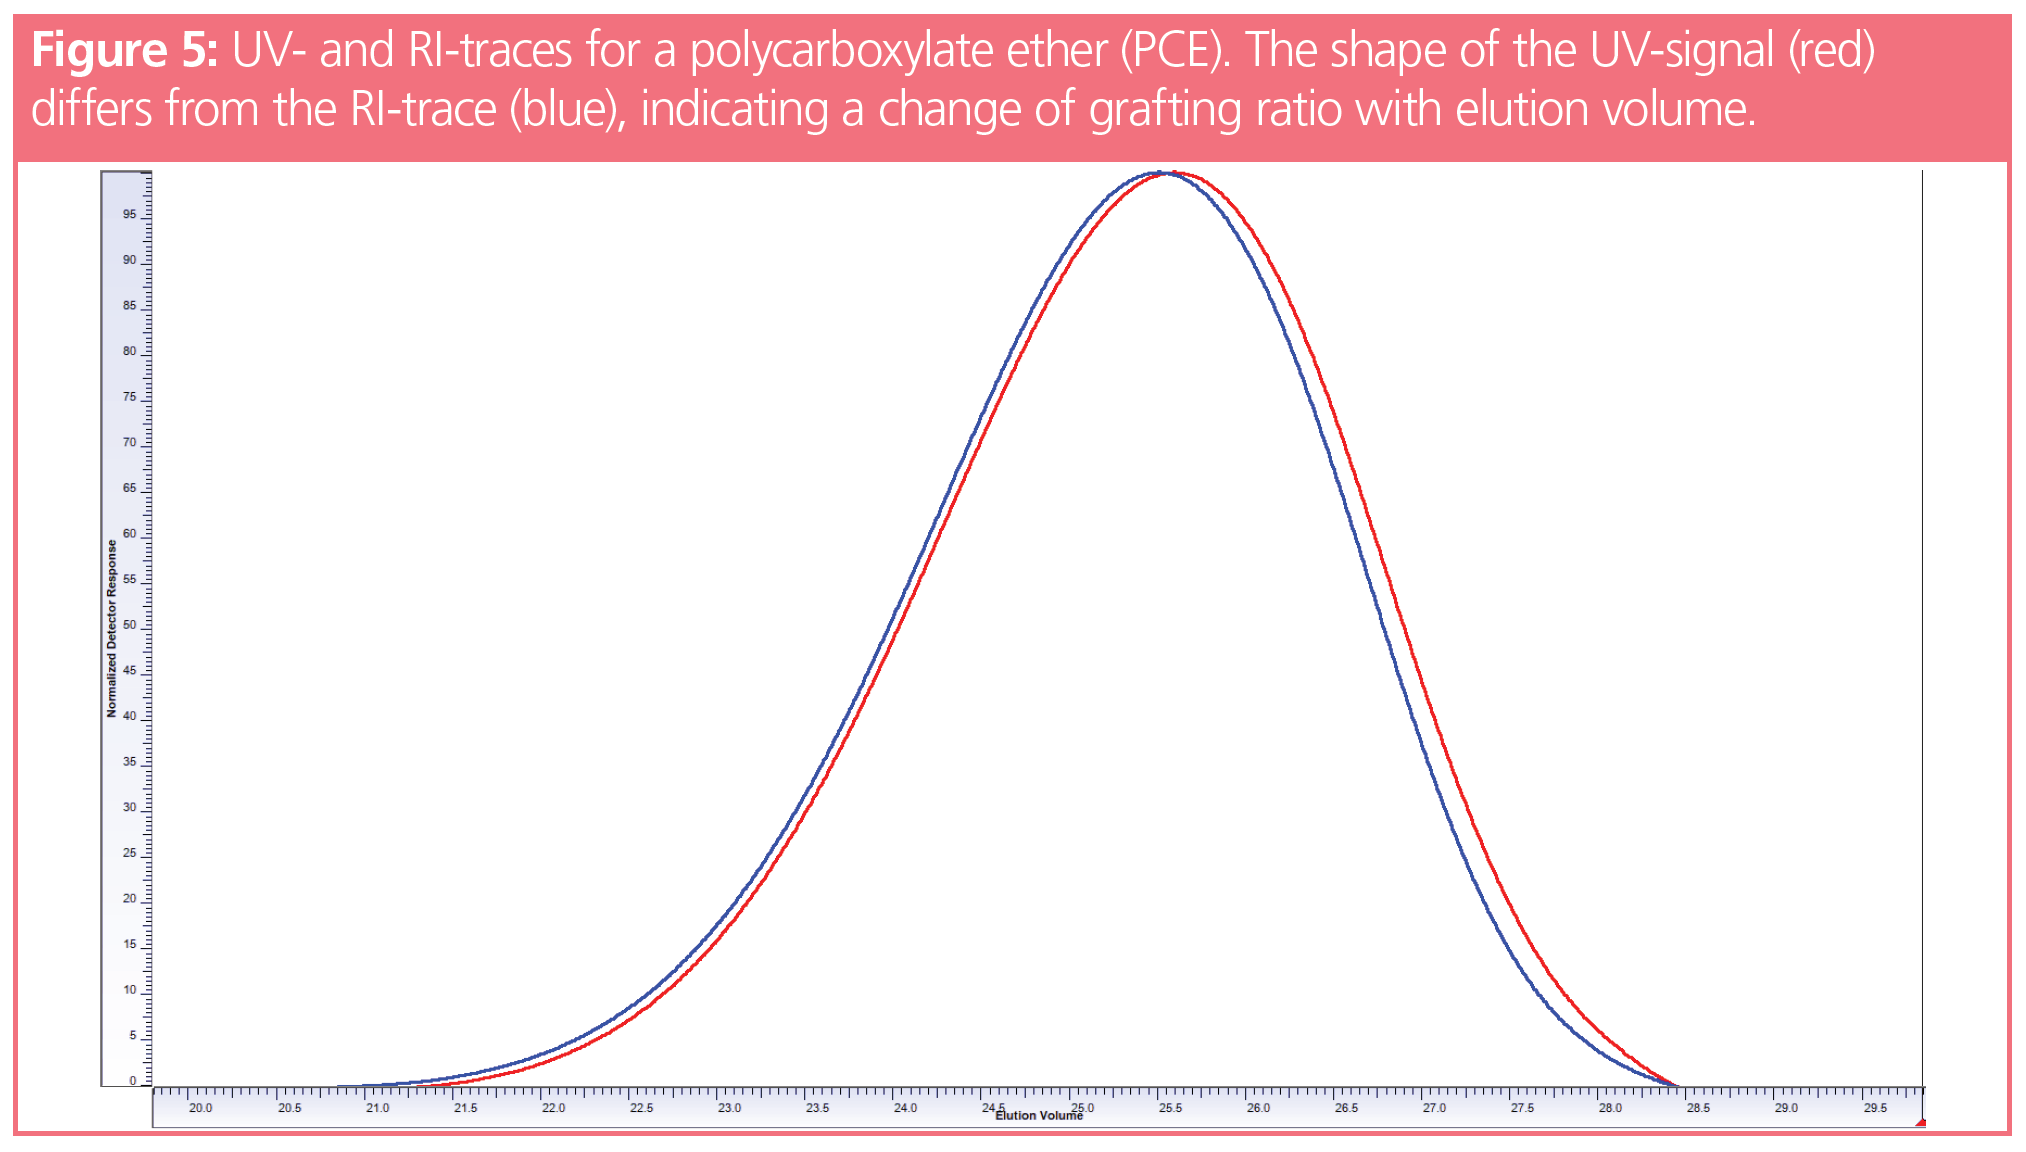
A different example is shown in Figure 5, the data of which were kindly provided (5). Here the UV- and RI-traces for a poly(carboxylate ether) (PCE) sample are shown. PCEs, poly(methacrylic acid), or poly(acrylic acid)s grafted with poly(ethylene glycols) are commercially used as concrete additives. The application properties depend on sample molar mass and on the distribution of the side chains along the poly((meth)acrylic acid) backbone.

Without any detailed analysis, the small difference between the UV- and RI-traces reveal that the grafting process does not result in a chemically homogeneous product, which would result in superimposing detector traces. In fact, the higher molar mass fractions contain a higher weight fraction of poly(ethylene glycols). The details on the analysis can be found in reference 5.
Summary
- A GPC/SEC chromatogram is composed of information from both the molar mass distribution of the sample and the separation characteristics of the applied column or column combination.
- Chromatograms obtained for the same sample on different column combinations can look totally different, preventing conclusive results on identity or dissimilarities of samples being drawn.
- Multimodal chromatograms are no indication of multimodal molar mass distributions without first identifying that the separation range is adequate and the pore size distribution is dislocation-free.
- Differences in the UV- and RI-traces indicate variations of chemical composition with molar mass. Such variation can result from polymers carrying UV-active end groups or from chemically heterogeneous copolymers.
Acknowledgements
The author would like to thank Anne S. Weckwerth and Professor Robert J. Flatt for providing the data presented in Figure 5.
References
- A. Striegel, W.W. Yau, J.J. Kirkland, and D.D. Bly, Modern Size-Exclusion Liquid Chromatography: Practice of Gel Permeation and Gel Filtration Chromatography, Second Edition (John Wiley & Sons, Inc. 2009), Chapter 7.
- D. Held, The Column 7(22), 20–23 (2011).
- T. Hofe, The Column 4(4), (2008).
- D. Held, The Column 14(8), 22–26 (2018).
- S.A. Weckwerth, W. Radke, and R.J. Flatt, Polymers 13, 1921 (2021).
Wolfgang Radke studied polymer chemistry in Mainz, Germany, and Amherst, Massachusetts, USA, and is head of the PSS application development department. He is also responsible for instrument evaluation and customized trainings.

Regulatory Deadlines and Supply Chain Challenges Take Center Stage in Nitrosamine Discussion
April 10th 2025During an LCGC International peer exchange, Aloka Srinivasan, Mayank Bhanti, and Amber Burch discussed the regulatory deadlines and supply chain challenges that come with nitrosamine analysis.


