The LCGC Blog: Electronic Flow and Pressure Control in Gas Chromatography: Opening the Lid of the Black Box!
Electronic pneumatic controllers (EPC) were introduced into gas chromatography (GC) systems from the mid-1990s onwards and do an excellent job of regulating gas flow and pressure for GC inlets, columns, and detectors. They take the hard work out of manual gas flow, pressure adjustment, and manual-flow measurement, and they typically provide accurate and reproducible results, time after time. One simply selects the required pressure or flow from the instrument or data system and then checks the instrument readback to see if the setpoint has been successfully achieved. Truly black box technology, what can possibly go wrong? Well, regular readers will know that, while I support innovation and improvements in engineering capability, I am inherently skeptical of anything with the “black box” tag and believe that unless we inherently understand how something works, we can neither fully harness the potential benefits, nor properly troubleshoot when something goes wrong. Therefore, read on as we open the lid and take a good look inside these particular black boxes.
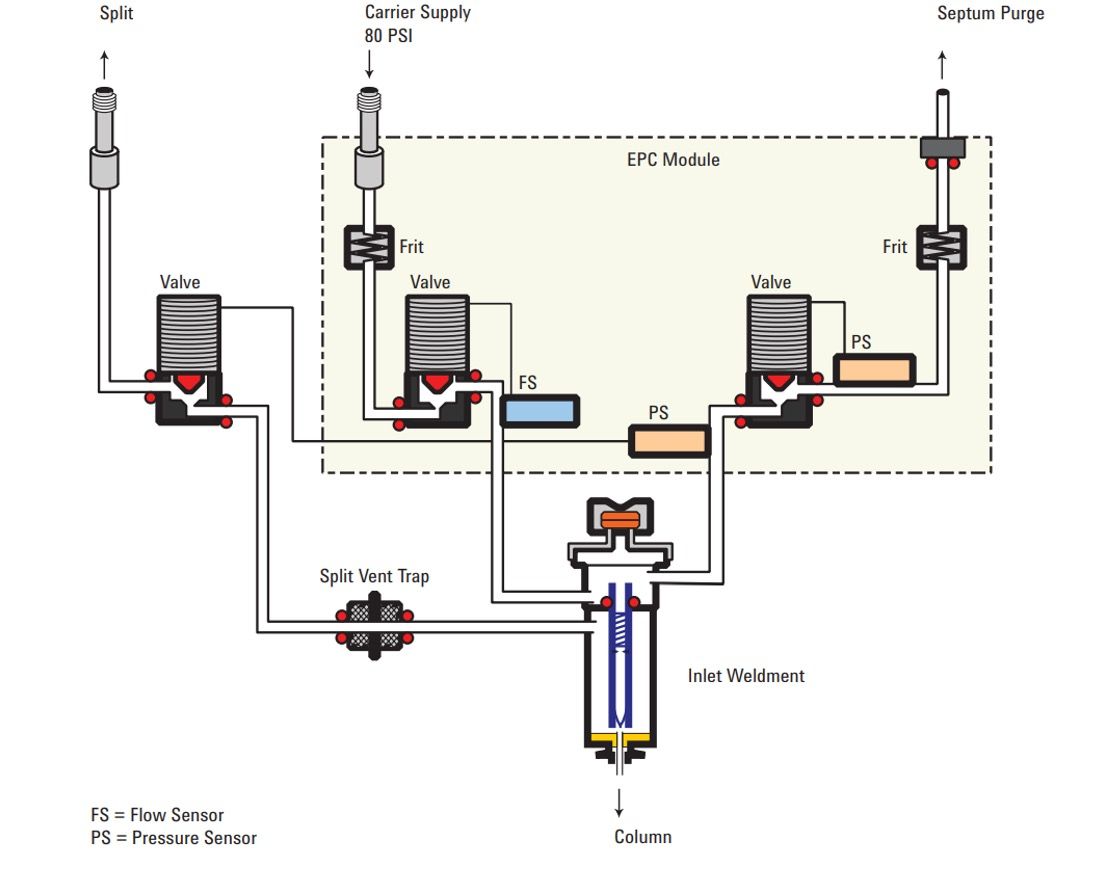
So, how do EPC devices work? Typically, a forward-regulated gas supply from the source is provided to the EPC unit that contains a variable metering valve that can be varied according to the set point for flow or pressure required. The required gas flow or pressure value is sent to the EPC controller from the GC system and a flow or pressure transducer is used to monitor the actual flow or pressure and the metering valve adjusted to obtain and maintain the desired setpoint value. This is known as a “closed-loop” control system. As can be seen in Figure 1, frits of fixed diameter may be included to provide adequate flow resistance downstream of the EPC pressure sensor, or upstream of a flow sensor. Most EPC systems will calculate required pressure drops for the column dimensions and the gas type to account for the different compressibility of our common carrier and detector supply gases. Other factors may also be compensated for, such as controller temperature, gas supply pressure, and atmospheric pressure, which can reduce instability and drift in the gas flows delivered to the GC inlet, detectors, or auxiliary equipment.
Figure 1 shows a typical EPC-controlled split/splitless inlet operating in split mode. The total flow into the inlet is set and monitored by value A and flow sensor A. The flow through the split line is controlled by valve B and pressure sensor B. Valve C and pressure sensor C controls the flow through the septum purge line. The flow through the column is not directly sensed, but is the balancing flow between that which enters the inlet via valve A and the flows through valves B and C. So, let’s say we need a column flow of 1 mL/min and a split ratio of 100:1. Approximately 104 mL/min will be supplied via valve A, typically around 3 mL/min will leave the inlet via valve C and the septum purge line (which is physically separated from the inlet region occupied by the sample when injected) and 100 mL/min will leave via Valve B and the split line. The remaining and balancing flow of 1 mL/min will be transferred to the column.
Figure 1: Schematic diagram of an EPC module used to control gas flows in a split/splitless inlet (Figure courtesy of Agilent Technologies, Santa Clara, California, USA).

Figure 1 illustrates the EPC control of a split/splitless inlet, the configuration for gas control to detectors and auxiliary and sampling equipment may be different, but all work on similar principles.
The astute reader will have noted that in our inlet example, only the carrier supply flow into the inlet is measured as a flow. The actual flow of the carrier through the column is not directly measured by the instrument, rather it is calculated from a differential of flow into the inlet (flow sensor A) and pressures out of the inlet (pressure sensors B and C). Most GC vendors will have a calculator which highlights the principles on which this principle works and using such a calculator I was easily able to compute that in order to obtain a carrier gas linear velocity of 35 cm/sec-1 of helium through my notional 30 m x 0.32 mm x 0.1 mm GC column at 50 oC, the carrier gas pressure required at the inlet is 10.01 psig which will result in a column (outlet) flow of 2.13 mL/min. For a split ratio of 50:1, the required split flow can be calculated as 106.5 mL/min. Of course, I could have calculated the required pressure to obtain a particular column flow, rather than a linear velocity, in exactly the same manner.
These same calculations are carried out “on-board” the GC system and the required pressures for the inlet set by the EPC control units.
This leads me to highlight the first potential “gotcha” when using EPC systems for gas control. Unless the end user specifies the correct column dimensions in the chromatograph (or data system), the actual flow through the GC column may be different than intended, even though the GC system will report the correct flow value.
Let’s look at a quick example of this. Provided the GC can attain and maintain the pressure setpoint required for what it has calculated as the correct flow rate or linear velocity of the carrier through the column, it will carry on regardless. If we suppose that an error was made in the previously cited example and the internal diameter of the column was entered as 0.25 mm rather than 0.32 mm then the instrument would believe it needed to set an inlet pressure of 16.76 psig to achieve the desired 35 cm/sec-1 carrier gas linear velocity. As the actual internal diameter of column 0.32 mm, the actual column flow would now be 4.18 ml/min and the average linear velocity 57.4 cm per sec, a difference in flow rate of 196% and one would notice very much shorter retention times and perhaps compromised analyte resolution. Further, because the split flow rate would remain unchanged, the split ratio would be in the order of 25:1, risking column overload and perhaps further compounding any issues with the resolution of critical peak pairs. One also needs to remember that as the column length is “trimmed” to maintain good chromatography. This will also influence the pressure required to obtain a required flow or linear velocity. If significant lengths of the column are trimmed, one should note on the column hangar tag or column log, the “new” length of the column. The lesson here is to be very careful to properly specify and check the column dimensions (including stationary-phase film thickness) when prospering for GC analysis. While EPC control is highly advantageous, it is by no means infallible.
Of course, one might choose to manually check the column flow prior to analysis to ensure it is correct, using an electronic flow meter. Here is the second issue that I regularly get questions on: “Why does my flow meter read a different flow to the value reported by my GC system?” Of course, one answer could be that there has been an error in setting the GC column dimensions in the systems as discussed above, but even when the dimensions are correct, there can be differences between the instrument reported value and the measured value.
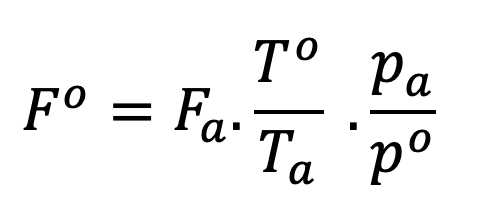
Some of these differences can be caused by the type of flow meter used and its calibration. These topics are beyond the scope of the current discussion, but I would point readers to an excellent article in LCGC magazine by John Hinshaw on measuring gas flow for gas chromatography (1). In accounting for differences between instrument flow values and those measured by modern electronic flow meters used to manually check the flow rates produced, we must consider the concept of Standard Temperature and Pressure (STP). In most cases, the standard pressure will be assumed to be 101.325 kPa but Standard Temperature can vary depending upon the industry we work in, geographical location, and the manufacturers of the GC equipment and metering devices. The International Union for Pure and Applied Chemistry (IUPAC), specify the standard temperature for gas measurement to be 273.15 K (0 oC) but temperatures of 20 and 25 oC are also used for “Standard” gas measurement by various bodies and indeed by equipment manufacturers. While some EPC units and flow meters can adjust for differences between standard and local conditions, clearly those which cannot need to have some correction factor applied to the measurement in order to account for the variations between the conditions under which the equipment was calibrated, and local conditions. Fortunately, there is a fairly simple equation that can be used for these purposes:

In this equation, the superscript “o” designates standard or reference conditions under which the equipment was calibrated, and the subscript “a” designates ambient (local) conditions under which the measurements are being made.
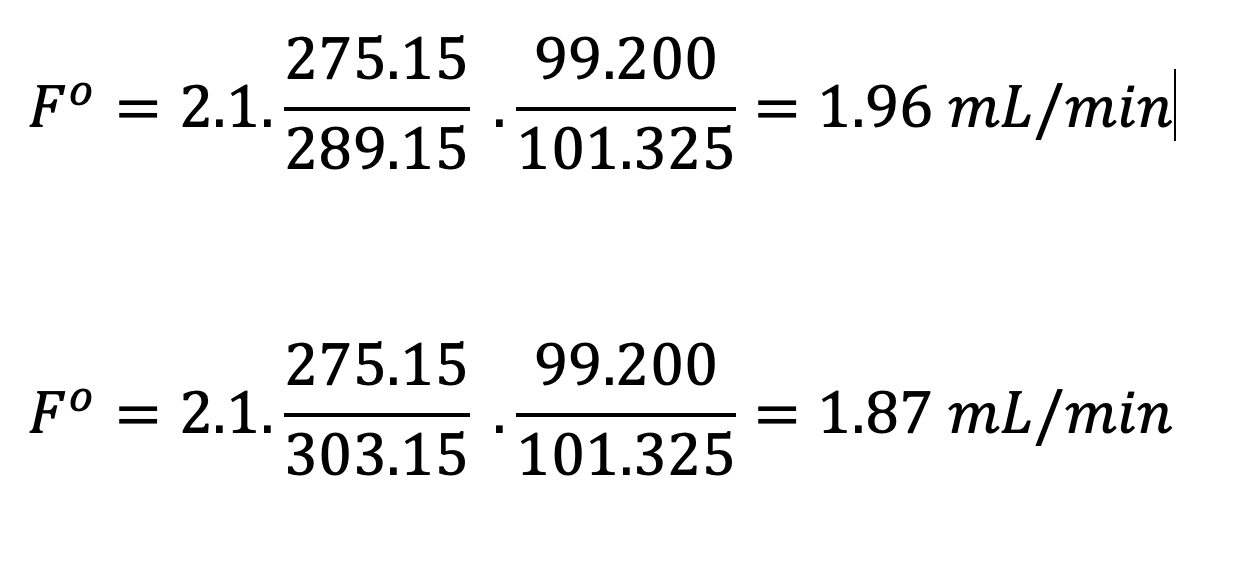
If we assume an STP of 0 oC and 101.325 as the standard conditions and an instrument flow reading of 2.1 mL/min—let’s see what differences there would be between flow meter measurements using a made-in-a-cooler laboratory under lower atmospheric pressure conditions (T-16 oC and p – 99.200 kPa) and a warmer environment under the same atmospheric pressure conditions (T – 28 oC and p – 99.200 kPa):

While these differences are not vast, they do go some way towards explaining why meter readings can be different from those displayed on the instrument, and they can highlight that, where methods are to be transferred between laboratories in different parts of the world with varying ambient conditions, some account must be taken to standardize the measurement of flow. It should also be noted that some flow meters impose a back pressure on the gas flow, which may change the response of the EPC system and then cause spurious flow reading. Again, I would urge readers to consult Reference 1 for further information.
A further contributing factor to the differences between flow meter and instrument readings involves the “drift” that can be encountered by EPC devices over time. While the “slope” (sensitivity) of EPC metering valve calibration tends to be steady, the “offset” values in terms of valve position versus metered gas flow can from time to need to be reset. There is no pre-defined time interval for this operation, but some manufacturers will include an EPC reset or zero function which will allow the user to reset the EPC valve position and “calibration,” and you should consult your manufacturer’s literature for guidance. Care should be taken as flow zeroing tends to be carried out with gas flowing, whereas pressure zeroing requires no gas flow.
The final EPC topic worthy of consideration is that of carrier gas operation in constant pressure or constant flow mode during GC oven temperature programming. As the oven or column temperature increases the gas viscosity also increases, and under constant inlet pressure conditions, the carrier gas flow and linear velocity will reduce. This is very often not the best situation for chromatography (long analysis times and broadening peaks) and several detectors also work more optimally with a constant flow situation. The ionization efficiency and fragmentation pathways analytes with the ion source of mass spectrometric detectors can be dependant upon ionization source pressure and therefore the flow into the ion source. Flame ionization dectors using hydrogen as the carrier can show changes in response if the volume of hydrogen to air and makeup gases changes. Therefore, it is better to keep a constant flow of hydrogen from the column during the temperature program.
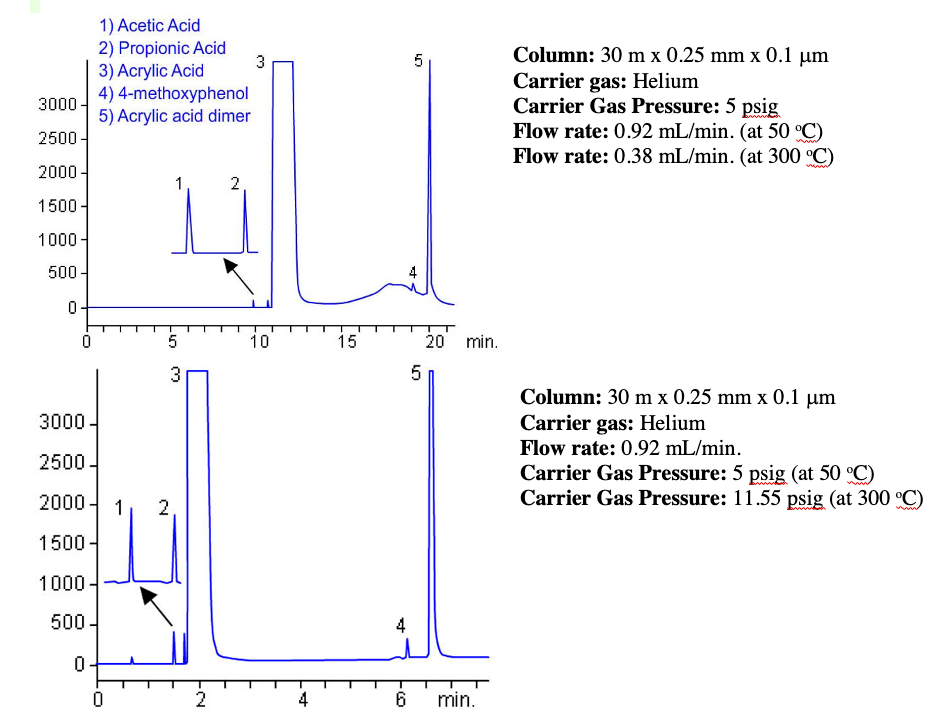
EPC units are calibrated to calculate the required pressure drop across a column (provided we input the correct column dimensions!) versus temperature in order to maintain a flow rate setpoint. In this way, as the oven temperature rises, the EPC module can increase the inlet pressure so that constant flow is maintained as the column temperature and carrier gas viscosity increases. In our previous example, the 10.01 psig required to obtain 35 cm/sec helium flow at 50oC will rise to 15.02 psig in order to maintain this linear velocity at 300 oC. This helps to overcome some of the disadvantages of the constant pressure operation described above which is illustrated in Figure 2.
Figure 2: Monomer separation carried out under constant pressure operation (top) and constant flow mode (bottom).

It is often advantageous to maintain a constant flow of carrier gas into a detector, and therefore, even if one is operating in constant pressure mode for the GC carrier gas, detector EPC units are often capable of ramping the flow of a fuel or make-up gas during the temperature program, such that, as the carrier gas flow decreases, then total flow experienced by the detector remains constant.
While these EPC operations are highly beneficial, the operator needs to be aware of how to implement them within the GC hardware or controlling software and everything that has been said above regarding EPC operation under non-standard conditions. Recalibration or zeroing needs also to be kept in mind for trouble-free operation.
I hope that this deeper dive into the working principles and potential issues of EPC modules in GC has helped to broaden your understanding. Certainly, these advances in gas control have brought many advantages to practical GC usage, but as always, without a deeper understanding of the working principles and limitations of such systems, one cannot ever truly exploit these advantages or properly investigate issues when trouble occurs!
Reference
(1) J.V. Hinshaw, LCGC North America 31(3), 210–217 (2013).
https://www.chromatographyonline.com/view/measuring-gas-flow-gas-chromatography

Tony Taylor is the Chief Scientific Officer of Arch Sciences Group and the Technical Director of CHROMacademy. His background is in pharmaceutical R&D and polymer chemistry, but he has spent the past 20 years in training and consulting, working with Crawford Scientific Group clients to ensure they attain the very best analytical science possible. He has trained and consulted with thousands of analytical chemists globally and is passionate about professional development in separation science, developing CHROMacademy as a means to provide high-quality online education to analytical chemists. His current research interests include HPLC column selectivity codification, advanced automated sample preparation, and LC–MS and GC–MS for materials characterization, especially in the field of extractables and leachables analysis.
Study Examines Impact of Zwitterionic Liquid Structures on Volatile Carboxylic Acid Separation in GC
March 28th 2025Iowa State University researchers evaluated imidazolium-based ZILs with sulfonate and triflimide anions to understand the influence of ZILs’ chemical structures on polar analyte separation.


