Take Control of Resolution
LCGC Asia Pacific
Separation scientists may seek an optimum spot between chromatographic performance required to obtain sufficient results quality, and the time and resources needed to do so. This instalment of “GC Connections” examines the factors that control peak resolution-one of the main drivers of separation quality-and how chromatographers can use this information to find an optimum between time, cost, and performance.
John V. Hinshaw, GC Connections Editor
Separation scientists may seek an optimum spot between chromatographic performance required to obtain sufficient results quality, and the time and resources needed to do so. This instalment of “GC Connections” examines the factors that control peak resolution-one of the main drivers of separation quality-and how chromatographers can use this information to find an optimum between time, cost, and performance.
Complete resolution of all substances is a primary goal of chromatographic separations. This is truly a stretch goal, though, because when taken to an extreme it implies that none of the substance comprising one peak is present under any other peak. Consider a simple, single-column separation: All of the sample mixture enters the column as a single band, and the analytes are separated by their different selective retentions on the column. In the course of the separation, analyte peak dispersions increase because of diffusion and mass-transfer processes. As a result, there is a finite amount of one peak present under its partner, even if a pair of adjacent peaks are well-separated with resolution of 2.0 or greater. The goal of complete separation may not be achievable in an idealized sense, but practically speaking complete separation probably does not matter.
Practical Resolution
The goal of complete separation is also bounded by the separation system’s detectability range. In the practical sense, a complete separation has been obtained if the chromatographic signal between peaks drops below the detection noise level, even though there is some mixing of adjacent peaks. For example, with a 10-µg idealized peak, about 1.3 ng of mass would be located at a distance of four sigma from the peak centre. Mass-selective detectors as well as element- and functionalâgroupâselective detectors significantly improve the situation if the adjacent peaks’ chemical structures differ enough to benefit from selectivity resulting from large differences in detector response.
The classical definition of resolution assumes equal-sized, symmetrical Gaussian peaks, which happens only in computerâsimulated separations. Real peaks are asymmetrical, not strictly Gaussian shaped, and are usually of considerably different sizes. A series of “GC Connections” instalments in 2010 (1–3) examined classical peak resolution and showed what happens when unequal-sized and asymmetrical peaks are separated and measured. The results were not quite what I had expected: they showed that peak quantification could be severely impacted by gauging separation quality on the basis of a classical resolution measurement when the peak shapes were anything but classically Gaussian.

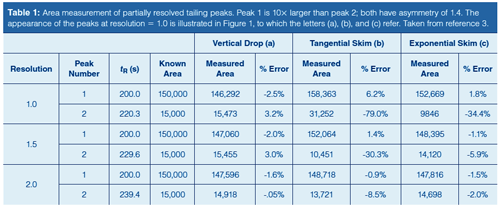
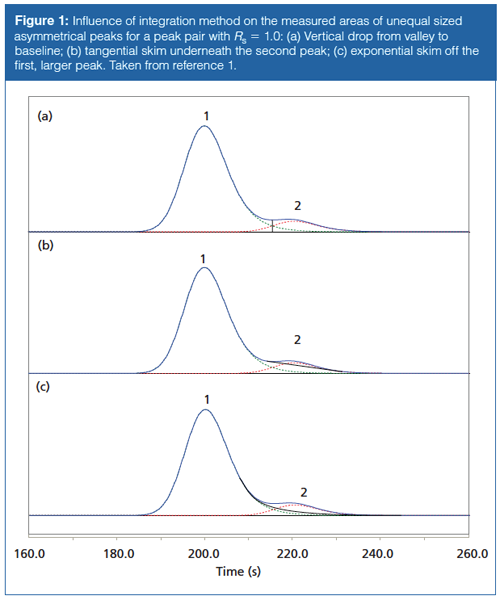
Table 1 gives peak area integration results when two tailing peaks of unequal size meet with resolutions of Rs = 1.0, 1.5, and 2.0. Figure 1 shows their appearance for Rs = 1.0. As with symmetrical peaks (1), increasing peak separation and resolution improves the accuracy of the area measurements significantly. And the area determination method affects the measurements in much the same manner. The best results are obtained with a simple vertical drop from the valley between the peaks to the baseline below; the measured values have less than a 4% error in all cases. The exponential skimming technique performs well except for the second, smaller, peak when resolution is less than 1.5. Here the error increases from about 6% up to nearly 35%. The tangential integration method delivers a comparably large error of over 8% for the second of two relatively wellâseparated peaks, and it produces very large errors for the second peak in the cases of the less-resolved peak pairs. In almost all cases, increasing the resolution to 2.0 produces results that would be quite acceptable in many, if not all, real world situations. So, choices in the data system’s integration method can strongly influence measured performance in cases of marginal resolution.

The data system or the operator make a choice, known or unknown, as to what type of integration rules are applied in each separation. For a pair of peaks that are significantly different in size, some uncertainty is introduced when the choice of peak area measurement method is left to the default data-system values. The built-in rules may switch from one integration method to another based on the relative depth of the valley between the peaks or other preliminary measurements, thereby causing large jumps in peak areas when the size of one peak changes only slightly. In the examples shown here, switching from tangential to exponential skim at resolution 1.5 produces a 35% area increase for the smaller peak.
If the peaks in a series of analyses happen to straddle this critical decision point, the variability of the results may appear to be much greater than it really is. Suppose the actual standard deviation of a series of 10 repeated analyses is 5%, but half of the measurements lie below this integration-changing threshold and half above. The observed measurement standard deviation would increase to somewhat more than 35% due to the bimodal nature of the integration shift. If the shifting of peak areas was related to the absolute detector response on certain instruments, then those systems might appear to the operator as either very good-having not suffered the integration shift-or very bad if the integration shift were occurring.
Therefore, good practice would call for fixing the integration method and not allowing it to change according to small shifts in peak size. At the very least, a careful examination of peak integration characteristics is very appropriate when this situation could occur. Finding a setting that avoids the problem all the time is, of course, preferable to examining each separation.
Ways to Improve
This brief review of the effects of peak shape, size, and position leads to the topic of improving peak data quality by controlling peak resolution. The given example is just one of many situations that can be improved by making good choices for instrumentation, column, conditions, and data processing parameters. These quality choices affect the cost and time needed, so a rational compromise between the three should be found.
Saving or Spending Time
There is always pressure to use less time to obtain satisfactory results. The path to this goal is simple if a separation already has excess resolution for its leastâseparated peak pair. Using shorter or widerâbore columns, or increasing the carrier-gas velocity, will speed up a separation while sacrificing some excess resolution. Changing to a different stationary phase is not a common choice in this situation, and it would require a re-evaluation of the entire method. Higher column temperatures have a similar effect on elution times but may cause peaks to shift relative to each other, especially if the peaks have dissimilar chemical characteristics, as in esters versus straight-chain hydrocarbons, for example. More caution is required when changing temperature programming rates as relative peak positions can shift for this reason as well.
In the other direction, it may be necessary to use more time when the present results are not satisfactory. Optimized flows and slower temperature programming rates may yield higher resolution. However, when peaks shift relative to each other as temperature conditions are modified, the critical least-resolved peak pair may not remain the same. If the sample is complex then it may not be possible to achieve good resolution for all of the peaks by changing the operating conditions this way, as the peakâresolving capacity of the column has been reached. In this case it becomes necessary to pursue longer and narrower-bore columns or perhaps a different stationary phase.
In all cases where changing chromatographic conditions is attempted, a good optimization and method-translation computer program can make great strides towards a goal by showing the general effects of proceeding to modify the operating parameters. This is also true when considering a change of carrier gas from helium to hydrogen in order to take advantage of the generally faster separations that hydrogen can deliver. Development time is saved by trying an idea virtually, and then only making test runs when the concept plays out well on the computer screen.
Time can also be spent in postârun analysis, as in the previous example where it could be necessary to check each chromatogram for individual peak integration accuracy or consistency. Sometimes considerable time can be saved by well thought-out stratagems for data processing as well as considerations for decreasing the interrun time spent waiting for an instrument to cool down, or for sample preparation and autosampler cycles.
Quality and Cost
The quality of a series of separations-as measured by accuracy, precision, and reproducibility-can be improved by the application of time and cost. Improving resolution may require run time but not too much cost, as discussed above. Attempting an improved separation in the same time will incur more cost if the instrumentation on hand becomes incapable of performing well under a new, higher performance set of separation conditions. For example, using a narrowerâbore column while conserving run time may require higher inlet pressures than can be delivered, or in some cases a different inlet system could be advantageous. Longer and narrowerâbore columns are more expensive than their lowerâperforming versions, too. Because of the generally lower sample capacities of such columns, a more sensitive or more selective detector might be necessary.
Conclusion
Taken together, time, cost, and performance will determine the kind of equipment, the columns, and the operating conditions required to meet a particular goal for a separation. The easiest route is to start without preconceived notions, pick an appropriate stationary phase for the solute chemistry, and proceed to find an optimum point that will deliver a separation of acceptable accuracy, precision, and reproducibility for the least time and cost per analysis. This is not often the case, however, as a large proportion of separations have already been developed for many specific samples or at least for ones that are very similar to the target. Optimizing an existing separation is another viable path, especially when there is overhead in resolution or run time that can be taken up. When the separation is already at a critical stage where peaks are not being as well separated as might be desired, then the challenge becomes one of pursuing the easiest route by finding a more optimum set of conditions. Taking the more difficult route of changing the column or upgrading its host instrumentation should be the last choice when other approaches fail.
References
- J.V. Hinshaw, LCGC Asia Pacific13(3), 22–28 (2010).
- J.V. Hinshaw, LCGC Asia Pacific13(4), 26–29 (2010).
- J.V. Hinshaw, LCGC Europe23(11), 531–534 (2010).
“GC Connections” editor John V. Hinshaw is a Senior Scientist at Serveron Corporation in Beaverton, Oregon, USA, and a member of LCGC Asia Pacific’s editorial advisory board. Direct correspondence about this column should be addressed to “GC Connections”, LCGC Asia Pacific, Hinderton Point, Lloyd Drive, Ellesmere Port, Cheshire, CH65 9HQ, UK, or e-mail the editor-inâchief, Alasdair Matheson, at alasdair.matheson@ubm.com

Understanding FDA Recommendations for N-Nitrosamine Impurity Levels
April 17th 2025We spoke with Josh Hoerner, general manager of Purisys, which specializes in a small volume custom synthesis and specialized controlled substance manufacturing, to gain his perspective on FDA’s recommendations for acceptable intake limits for N-nitrosamine impurities.


