Size-Exclusion Chromatography of Protein Aggregation in Biopharmaceutical Development and Production
Special Issues
Size-exclusion chromatography is an important technique in biopharmaceutical characterization. This article discusses its use for soluble aggregation analysis and quantitation.
New biological entities, protein-based pharmaceuticals, are now routinely obtained by genetic engineering with host cells that are mostly mammalian and microbial. It is essential that robust analytical methods are developed to identify and monitor aggregation and accurately quantify the aggregate content of a biopharmaceutical preparation. Size-exclusion chromatography is an important technique in biopharmaceutical characterization, and this article discusses its use for soluble aggregation analysis and quantitation.
New biological entities, protein-based pharmaceuticals, are now routinely obtained by genetic engineering with host cells that are mostly mammalian and microbial. The cellular processes are complex. Often the resultant recombinant proteins are unstable and aggregate or do not adopt the native conformation that imparts the required biological activity. The subsequent multistep purification procedure subjects the target protein to numerous changes in its environment with an associated risk of further conformational changes and increased levels of aggregation, visible precipitation, and invisible soluble aggregates. The impact of aggregation on the process economics, efficacy, and immunogenicity of a biopharmaceutical are considerable, and so reliable and accurate methods of analysis and quantitation that can be applied to the various scenarios encountered in development and production are required.
It is therefore essential that robust analytical methods are developed to identify and monitor aggregation and accurately quantify the aggregate content of a biopharmaceutical preparation. One technique that is used for soluble aggregation analysis and quantitation is size-exclusion chromatography (SEC).
Aggregation
Protein aggregation can impact both the economic viability of a biopharmaceutical product and its efficacy. The reduction in the economic viability of the process is seen through a reduction in product yield or decreased bioactivity of the product. An increase in the level of aggregation can increase the immunogenicity of the final product because the recipient's immune system may recognize the protein complex as nonself and trigger an antigenic response.
At the molecular level, the formation of protein aggregates is complex, but it is accepted that as part of the mechanism of formation the protein must at some point lose its three-dimensional structure to interact with other protein molecules. The mechanism of interaction of unfolded proteins can result in the formation of irreversible aggregation, but if there was minimal disruption to the three-dimensional structure then aggregation may be reversible. In the worst case, the proteins can irreversibly denature and the three-dimensional structure and, hence, bioactivity, is lost. In this case the protein no longer functions as a biopharmaceutical, efficacy is reduced, and the process yield is decreased (1).
Aggregation in the Development and Production Process
Protein aggregation is encountered during various stages of biopharmaceutical manufacture and storage because it is one reaction to changes in the protein environment or forces exacted by the environment — chemical and mechanical stress (2). Examples include changes in solution interfaces, interactions with surfaces or solids, mechanical stresses because of flow or agitation (3), and changes in temperature.
Upstream — Cell Culture
The expression of biopharmaceuticals is mainly carried out using a fed-batch process with a time line of multiple days — typically 10–14. During this first stage in the manufacturing process, there will be numerous changes in the environment, referred to as cell culture media, as nutrients are consumed and replenished and the pH is adjusted to maintain optimum expression. During the optimization of the upstream process, aggregation is monitored and conditions that promote aggregation are identified. This enables the cell culture to be run at a pH and salt concentration in which the protein is most stable and, where necessary, molecules can be added that assist with stabilization. The conditions for maximum stability or minimum aggregation identified here can also be used as the basis for storing the protein substance and biopharmaceutical formulation. During development and optimization of the cell culture, a high numbers of samples are produced, so methods of analysis must be able to deliver results in a short time frame. By using a liquid chromatography (LC) system configuration with shorter columns and higher flow rates, SEC can meet the sample throughput needs.
Downstream — Purification
Although there is a need for fast separations during the development of downstream processes, methods capable of delivering accurate quantitation are also needed because they will form the basis of release criteria. SEC methods with increased resolution are needed to achieve robust quantitation.
The capture of the target protein from the cell culture and its subsequent purification is a multistep process that often includes one step specifically designed for the removal of protein aggregates — ion-exchange or size-exclusion purification. However, the downstream purification steps can also increase the concentration of aggregates through changes in the protein microenvironment, concentration, pH, and salt concentration. The chromatographic purification conditions are chosen so as to minimize aggregate formation, including mobile-phase selection and reducing the on-column and elution protein concentration, but in-process testing is needed at each stage of the purification to ensure that the level of aggregation is as expected.
Formulation Studies
Unlike small-molecule drugs, a biotherapeutic is administered as a formulation and, therefore, its stability, including aggregation, must be determined in formulations and conditions that match as closely as possible those in which the drug is applied in vivo. As part of the early stage in formulation development, the environmental effects required to obtain acceptable product shelf life and conditions that control aggregate formulation must be identified. Variables that must be considered include protein concentration, temperature, ionic strength, and pH because these can influence the rate of formation and amount of aggregates. As part of the stability trials, formulations are tested at the end of their shelf life and this includes aggregate analysis.
Quality Control — Drug Substances and Drug Product
The complex protein therapeutic must undergo multiple testing processes to ensure that it meets the defined quality requirements of product safety and efficacy. This includes testing for conformational and physical instabilities such as denaturation, unfolding, and aggregation because these have implications for efficacy and immunogenicity (4,5). The methods used for the release of drug substances (clinical batches) during product development and drug product (production batches) after commercialization must be robust, provide the required sample throughput, and be validated according to guidelines from the International Conference on Harmonisation (ICH) (ICH Q2) (6).
It is clear from the above that the processes required for manufacturing a biotherapeutic are complex and that aggregation could potentially change (increase or decrease) throughout the process.
Analytical Methods
Aggregates can be classified as soluble or insoluble, and the aggregation process can be reversible (noncovalent) or irreversible (covalent). Therefore, the analytical challenges are immense with no single technique capable of providing data across the range of solubilities and sizes, nanometer to millimeter (7).
SEC is used for the analysis and quantitation of soluble aggregates that are noncovalent and irreversible in nature. This technique is a form of LC in which the separation is based on the hydrodynamic size of the protein in solution. SEC is suitable for the analysis of aggregates in the size range of 1–50 nm and is considered robust and accurate when the method induces no changes to the aggregation state, and nonspecific interactions with the column packing media are eliminated.
The instability of the aggregate to changes in its environment or physical disruption places exacting requirements on the method of analysis if accurate quantitation of aggregate content is the desired outcome. Just as with the manufacturing process, the method of analysis can also influence aggregation. Consideration must be given to the temperature, pH, and ionic strength of the eluent as well as sample preparation, concentration, agitation, and filtration if the data generated is to be representative of the "sample." In the following sections, choices for the development of SEC methods are explored and examples are presented to illustrate some of the pitfalls and consideration for development of an SEC method that matches the data need.
Size-Exclusion Chromatography
The Separation Mechanism
In SEC, the molecules are separated based on differences in size in solution — with the elution order from largest to smallest. Figure 1 shows a schematic of the differential flow paths as a function of molecular size and the associated chromatogram. To achieve sufficient differentiation in residence time in the column, the SEC media must be porous and have a high pore volume.
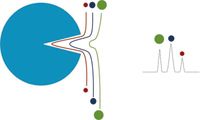
Figure 1: Molecules can permeate the pores of the stationary phase to different extents depending on their size in solution. The largest molecules spend the least time in the pores and are eluted first and the smaller samples have longer residence time and are eluted later.
The pore size of an SEC column will define the molecular sizes that can be resolved — anything that is bigger than the pores will be excluded and will be eluted at the exclusion volume of the column, and the smallest molecule that does not interact with the packing will be eluted at the total permeation volume — these two points define the elution volume and resolving range of the column. In the example shown in Figure 2 of the separation of the BioRad protein test mix, the 300-Å pore size column resolves all seven components in the mix. With the smaller pore sizes, 150 Å and 100 Å, the larger sample components are eluted together at the exclusion point — with the 150-Å pore size column the thyroglobulin aggregates, thyroglobulin, and IgA are excluded and eluted together, and when the pore size is reduced further to 100 Å the globulins are also excluded. Therefore, the correct pore size must be selected based on the size of the proteins being resolved and the information required. To increase resolution, SEC columns are run in series, either combining the same pore size or different pore sizes to increase the resolving range.
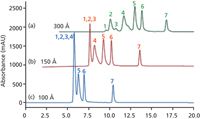
Figure 2: Separation of the BioRad protein standard mix using Agilent Bio SEC-3 columns with (a) 300-, (b) 150-, and (c) 100-Ã pore sizes. Eluent: 50 mM sodium phosphate, 150 mM sodium chloride (pH 6.8). Peaks: 1 = thryroglobulin aggregates, 2 = thryroglobulin, 3 = IgA, 4 = globulins, 5 = ovalbumin, 6 = myoglobin, 7 = vitamin B12.
Speed of Analysis
When screening multiple samples, such as when looking at cell culture optimization or process variables on the level of aggregation, the speed of analysis becomes critical. This is one of the drivers for the use of small particles, such as sub-2-µm particles, for small-molecule analysis. There is also interest in the use of sub-2-µm particles for the analysis of biomolecules, but there is one significant difference that can impact the effectiveness of this strategy — the size of the molecule. When reducing the particle size, the porosity of the frit used to retain the media also decreases, nominally 0.5 µm, and the interstitial space in the packed column decreases. Figure 3 compares the interstitial space for 3 µm and 1.7 µm particles. There is a large range in protein hydrodynamic radii, but typically those monomeric proteins of biopharmaceutical importance have hydrodynamic radii of between 2 nm and 13 nm (8); the aggregates are considerably bigger. With SEC, where the primary application is the analysis and quantitation of monomer, dimer, and multimers of proteins, there is a risk of shear forces causing changes to the sample composition or the column acting as a filter and trapping the multimer. In both of these examples, the relative composition of the samples will be altered by the SEC column.

Figure 3: Schematic showing the size of the interstitial spaces that would be achieved with monodispersed particles with 3-µm and 1.7-µm diameters.
An alternative way to reduce the analysis time is to use a shorter column and increase the flow rate. However, with SEC, where the separation between two molecules depends on the difference in the residence times, reducing the column length will impact resolution and, in practice, very short columns cannot be used. The separation of a monoclonal antibody obtained using a 150 mm long SEC column is shown in Figure 4. The 150-mm column is capable of resolving the monomer from the dimer, but as the flow rate is increased from 1.0 mL/min to 2.0 mL/min the resolution decreases from 1.53 to 1.13; the percentage of dimer calculated was constant at 0.64%. As the size of the molecule increases, its mass transfer decreases with the effect that the peak width increases and impacts the resolution, and monomer efficiency decreases from 3510 to 1917 plates at 2 mL/min. This approach is suitable when high sample throughput is required (such as in the screening of cell cultures and the optimization of process conditions) because the time required for analysis is reduced to under 4 min. However, increasing the flow rate is not universally possible as some proteins, such as the clotting factors, aggregate in liquid streams at high flow rates and block the column. With the vast range of proteins it is important to understand the physicochemical stability and function requirements to ensure that the analytical method is fit for purpose and does not result in "changes" to the sample.
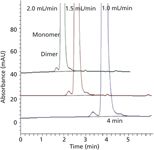
Figure 4: The effect of flow rate on the resolution of a monoclonal antibody and its dimer. Column: 150 mm à 7.8 mm, 3-µm Agilent Bio SEC-3 300 à eluent: 150 mM sodium phosphate, 100 mM sodium sulfate; flow rates: 1.0, 1.5, and 2.0 mL/min.
Quantitation of Soluble Aggregates, Dimers, and Oligomers
There is no regulatory defined limit for the level of soluble aggregates in a biopharmaceutical preparation because the acceptable level relates to its physicochemical characteristics, efficacy, and immunotoxicity. Therefore, the acceptable amount must be determined for each protein and quality control (QC) testing must be sufficiently robust and sensitive to quantify the level of aggregation at this limit.
Sample Preparation
As mentioned previously, protein aggregation is influenced by environmental conditions and, therefore, if the requirement is to quantify the level of monomer, dimer, and higher aggregates then attention must be given to how the sample is prepared, so that the level of aggregation is not altered by the sample preparation method. Table I summarizes the SEC quantitation of a monoclonal antibody, as well as its dimer and higher aggregates. It also shows the effect of various sample treatments on the quantitation. With the monoclonal used in this study, sonication of the sample increased the monomer content and reduced the amount of both the dimer and the higher aggregates. The same observation was made for the sample temperature, indicating that the dimer and the higher aggregates were dissociated at elevated temperatures to give a higher concentration of monomer.
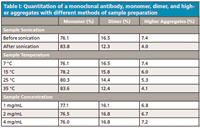
Table I: Quantitation of a monoclonal antibody, monomer, dimer, and higher aggregates with different methods of sample preparation
Accuracy and Precision
The aggregate levels above which adverse reactions may be encountered can be a fraction of 1% in a biopharmaceutical preparation. The analytical methods used for the analysis must, therefore, have a sufficiently low limit of quantitation (LOQ) and limit of detection (LOD) to provide accuracy and precision at these limits (9). As part of the development of an SEC method, robustness must be determined. Experiments must be carried out to demonstrate that the separation is based on size in solution, there are no nonspecific interactions, and the analysis conditions, including those used to prepare the sample, do not change the amount or type of aggregates present in the sample. This can be done as part of a method robustness study (9).
Multiple Detectors
When dimer and higher aggregate levels are very low, the LOQ and LOD achieved using UV or diode-array detection may not be sufficient. When light scattering is combined with SEC there is an increase in sensitivity for the dimer and higher aggregates. The added benefit of using an on-line scattering detector is that when used with a concentration detector such as a refractive-index detector, absolute molecular weights are obtained for homogenous peaks and the molecular weight profile is obtained where multiple species are present in a single peak. Figure 5 shows the elution profile of a bovine IgG using refractive-index, UV (280 nm), and light-scattering (90°) detection. Figure 5 clearly shows the change in relative peak heights of the monomer, dimer, and higher aggregates when light-scattering detection is used compared to UV at 280 nm. A column with a 250–300 Å pore size would typically be used for the analysis of this size of protein when UV detection was used, but in this case a 500-Å pore size was needed to resolve the low level of higher aggregates that are now visible because of the increased sensitivity of the light scattering detector for the larger protein aggregates.
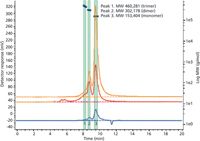
Figure 5: Size-exclusion analysis of bovine IgG with UV absorbance (280 nm, orange trace), light-scattering (90°, red trace), and refractive-index (blue trace) detection. Column: 300 mm à 7.8 mm Bio SEC-5 500 à instrument: Agilent 1260 Infinity Bio-inert Quaternary LC with Agilent 1260 Infinity GPC/SEC Multi Detector Suite; mobile phase: 50 mM sodium phosphate, 250 mM sodium chloride (pH 7.0); flow rate: 1.0 mL/min.
Conclusions
Aggregation of biotherapeutics is undesirable because it can impact the process economics and efficacy of the product and can also cause adverse immune responses. During manufacturing process development much emphasis is put on understanding the mechanism of aggregation for the target protein and on finding ways to control and reduce the folding and aggregation of the protein. SEC is widely used to study aggregation and characterize protein aggregates and is also suitable for quantifying levels of soluble aggregates in a preparation. It has been routinely adopted as one of the methods of choice for the characterization of biopharmaceuticals and is applied through the process development stages and as one of the release criteria tests in QC. The technique can be run to achieve fast separations by using short columns at higher flow rates or by using smaller particle sizes and for increased resolution multiple columns can be run in series and accurate quantitation can be achieved. By using a combination of SEC and light-scattering detection, the sensitivity for large aggregates is improved, thereby enabling a reduction in the detection levels and obtaining information about the molecular weight of the aggregations.
References
(1) J. Engelsman, P. Garidel, R. Smulders, H. Koll, B. Smith, S. Bassarab, A. Seidl, O. Hainzl, and W. Jiskoot, Pharm. Res. 28, 920–933 (2011).
(2) J. Patel, R. Kothari, R. Tunga, N.M. Ritter, and B.S. Tunga, BioProcess Int. 1, 20–31 (2011).
(3) W. Wang, Int. J. Pharmaceut. 185, 129–188 (1999).
(4) S. Hermeling, D.J.A. Crommelin, H. Schellekens, and W. Jiskoot. Pharm. Res. 21, 897–903 (2004).
(5) M.E.M Cromwell, E. Hilario, and F. Jacobson, The AAPS Journal 8(3), article 66, E572–E597 (2006).
(6) International Conference on Harmonisation, ICH Q2(R1), Validation of Analytical Procedures: Text and Methodology (ICH, Geneva, Switzerland, 1994).
(7) T. Arakawa, J.S. Philo, D. Ejima, K. Tsumoto, and F. Arisaka, BioProcess Int. 4(10), 32–42 (2006).
(8) J.K. Armstrong, R.B. Wenby, H.J. Meiseman, and T.C. Fisher, Biophys. J. 87(6), 4259–4279 (2004).
(9) M.S. Palaniswamy, Agilent Application Solution, Publication No. 5991-0835EN (2012).
Linda Lloyd is currently the BioColumns Product Manager at Agilent Technologies with responsibility for global strategy. She has more than 30 years experience in GPC/SEC and HPLC and is the author of more than 40 scientific papers and conference presentations. Experience in biomolecule analysis and purification was gained at Polymer Laboratories and The University of Birmingham where she was involved in the design and development of new materials for biomolecule separations and the development of methods, including HPLC, to characterize bioactive proteins and polysaccharides. Direct correspondence to: linda.lloyd@agilent.com

Linda Lloyd
Altering Capillary Gas Chromatography Systems Using Silicon Pneumatic Microvalves
May 5th 2025Many multi-column gas chromatography systems use two-position multi-port switching valves, which can suffer from delays in valve switching. Shimadzu researchers aimed to create a new sampling and switching module for these systems.
Studying Cyclodextrins with UHPLC-MS/MS
May 5th 2025Saba Aslani from the University of Texas at Arlington spoke to LCGC International about a collaborative project with Northwestern University, the University of Hong Kong, and BioTools, Inc., investigating mirror-image cyclodextrins using ultra-high performance liquid chromatography–tandem mass spectrometry (UHPLC–MS/MS) and vibrational circular dichroism (VCD).

.png&w=3840&q=75)

.png&w=3840&q=75)


.png&w=3840&q=75)


.png&w=3840&q=75)


