Impact of New Columns on Drug Development
Special Issues
An examination of the development of new types of columns based on different particle types, sizes, and other physical characteristics and how they can improve the speed and efficiency of HPLC used to support more expansive and complicated analyses
This article will examine the development of new types of columns based on different particle types, sizes, and other physical characteristics and how they can improve the speed and efficiency of high performance liquid chromatography used to support more expansive and complicated analyses.
Liquid chromatography (LC) has always been an important analytical technique in the drug development process. For small-molecule drugs, the use of high performance liquid chromatography (HPLC) for assay and impurity analyses, analysis of process samples, support of toxicology and clinical studies, and stability monitoring methods plays a crucial role in the entire development. Many of the separations for this class of drugs are based on reversed-phase HPLC and sometimes other techniques, such as chiral analysis. For biological drugs, the use of HPLC is even more important and expands to the use of size-exclusion chromatography, ion-exchange chromatography, and other specific techniques such as affinity chromatography.
The recent Affordable Health Care Act of 2010 in the United States provided a pathway for the development of biosimilar products, similar to the generic drug pathway for traditional drugs that was established by the Hatch-Waxman Act of 1984. Although the specific requirements for approval of a biosimilar are still under development by the United States Food and Drug Administration (US FDA), it is clear from recent guidance and discussions that an increased emphasis will be placed on the analytical characterization as a part of the pathway for approval for biosimilars. A recent presentation by Kozlowski (1) highlighted the desire for an increased level of analytical and physical characterization in the development of biosimilar products.
This trend is creating an even greater need for high-efficiency and high-performance analytics, many of which are based in part on HPLC. The development of new types of columns based on different particle types, sizes, and other physical characteristics will be a key contributor to the expanded use of HPLC to support these additional analytics. This article examines a few of these new technologies and how they can improve the speed and efficiency of HPLC used to support more expansive and complicated analyses.
Monolith Columns
One of the first needs for rapid HPLC analyses is the support of process development for biological molecules. Many large proteins are produced in cell-based fermentation systems. These cell culture production systems require significant process development to optimize the input starting materials, feed rates, and frequencies, and other parameters to generate protein at a commercially viable concentration in the final product. The need to continuously and rapidly monitor protein concentration (often referred to as titer) is important to initially aid in the selection of a proper clone to be used and then as additional process development work continues.
Silica-based monolith HPLC columns were developed in the early 1990s (2) as an alternative to traditional porous HPLC columns. These columns use channels rather than pores for flow through the column and are less likely to clog with other materials in the sample, such as cell debris in a cell culture sample. In addition, they rely on convective mass transfer leading to flow rate–independent separations that can provide very rapid analysis of high-molecular-weight samples such as proteins. A specific example of this is a monolith column, which contains protein A bound to the surface of the monoliths. Protein A selectively retains IgG proteins in an affinity type separation, therefore, these columns can be used to separate the IgG (the protein of interest in the cell culture) from other proteins and cell debris made during the cell culture process.
An example of this type of analysis is shown in Figure 1. In this case, the blue trace is a 0.5 mg/mL sample of the originator drug (traztuzumab) injected as the drug product. The red trace is a cell culture sample from one clone that was centrifuged for 5 min at 5000 g and the supernatant was directly injected onto an Agilent Biomonolith Protein A column (5.2 × 4.95 mm). The IgG protein is retained on the column while the other cell proteins and debris are eluted rapidly in less than 20 s in the initial mobile phase. A change to the mobile-phase B (citric acid buffer) elutes the IgG protein with a total analysis time of less than 2 min. Because multiple clone samples are often analyzed at once during clonal screening, this rapid analysis permits the screening of dozens or hundreds of samples quickly.
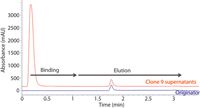
Figure 1: Sample titer analysis of traztuzumab. Comparison of supernatants from clone (red) versus originator purified drug (blue). Samples injected into a 50 mM phosphate buffer (pH 7.4) and eluted with a 0.1 M citric acid buffer (pH 2.8). Figure adapted and provided by Maureen Joseph of Agilent Technologies and Koen Sandra of the Research Institute for Chromatography.
Small-Particle (Sub-2-µm) Columns for High Efficiency and Speed
A major development in column technology has been the introduction of small (sub-2-µm) particles and the related equipment to handle the high pressure drop of these columns. Compared to classical 5-µm packed columns, these columns have permitted separations with much higher resolution, faster analysis times, or both, and have been widely applied in support of drug development. An example of this speed is the analysis of the N-glycan profile of monoclonal antibodies (mAbs). Most monoclonal antibodies are glycosylated at one or more sites on the protein backbone. The glycosylation of one or more asparagine (N) residues is a common post-translational modification (PTM) that must be measured. This is necessary either to develop a new biological drug or develop a biosimilar that closely matches the glycosylation pattern of the innovator drug. Because the glycosylation is a PTM in the cell culture process, it can vary from batch-to-batch even in the same process. This variation creates the need to analyze multiple samples over many lots to establish the pattern or range of glycosylation; hence the need for an efficient and rapid way to assess this PTM.
Rapid N-Glycan Analysis
N-Glycan analysis is done by first treating the glycosylated protein with the enzyme N-glycanase to cleave the glycans from the protein backbone. Because glycans do not contain a good chromophore for UV detection, labeling with a tag such as the fluorescent label 2-aminobenzamide is performed, followed by HPLC separation and detection of the fluorescently tagged glycans.
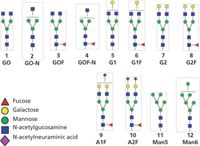
Figure 2: N-Glycan structures, peak ID numbers, and notations. The peak ID numbers identify the associated structure on the N-glycan profiles in Figure 3. Note that on the profile 6 and 6’ are G1F[6] and G1F[3], respectively. Adapted from reference 3.
Figure 2 shows the major glycan species that are found in many IgG proteins. Figure 3 shows the separations of the N-glycans released from samples of rituximab and bevacizumab. Separation and quantitation of these species is done in this example using a Waters Acquity BEH Glycan column (100 mm × 2.1 mm; 1.7-µm particles) operated in hydrophilic-interaction chromatography (HILIC) mode. The separation is performed with a column temperature of 60 °C and a flow rate of 1.0 mL/min using an acetonitrile–100 mM ammonium formate (pH 4.4) gradient with a total elution time of 10 min (for full experimental details see reference 4). Traditionally, these separations were done using more standard 5-µm columns and required 30–60 min per analysis. Using the small-particle and ultrahigh-pressure liquid chromatography (UHPLC) systems, the complete analysis can be accomplished in less than 10 min, which is ideal for the analysis of multiple lots or multiple process samples often required.

Figure 3: Representative N-glycan profile of (a) rituximab and (b) bevacizumab. Peak numbers correspond to N-glycan structures in Figure 2. Adapted from reference 3.
Rapid Amino Acid Analysis
Another need to support process development is amino acid analysis done during process optimization. This can be done to analyze the final protein product, precursors, or even the feed solution used in the process for specific amino acids. Analysis of multiple samples is often required with very short turnaround to support process development and optimization.
Amino acid analysis of proteins has been done routinely since first reported by Moore and Stein in 1951 (5). Hydrolysis of the protein to free amino acid followed by HPLC using either pre- or post-column derivatization has routinely been done, with a typical separation time of 40–50 min per sample. An example of this separation is shown in Figure 4a using a standard HPLC column and system to provide baseline separation of all the amino acids. The use of a sub-2-µm column with a UHPLC system using similar separation conditions gives the same separation, shown in Figure 4b, in only 10 min.
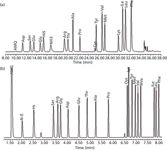
Figure 4: Comparison of amino acid separation on two different columns and systems. (a) 150 mm à 3.9 mm AccQ-Tag column (Waters) (4-µm particle size) with a flow rate of 1.0 mL/min and a 50-min cycle time. (b) 100 mm à 2.1 mm AccQ-Tag Ultra column (1.7-µm particle size) with a flow rate of 0.7 mL/min and a 10-min cycle time. Both separations used gradient elution with proprietary eluents (AccQ-Tag and AccQ-Tag Ultra); total gradient times for the separations are 45 min and 9.5 min, respectively
The overall analysis of a single sample still requires multiple hours (primarily because of the sample digestion and other sample preparation time). However, because multiple samples can be digested in parallel, the savings of HPLC analysis time can mean a significant overall time savings if multiple samples are required at once.
Superficially Porous Particles for High Efficiency and Rapid Separations
The use of small-particle columns (<2 µm) as described above can improve both the speed and efficiency of HPLC; however, another approach is to use superficially porous (sometimes called pellicular) particles of 2.7–4 µm that have a solid core and a "shell" of 0.4–0.8 µm outside the solid core. These materials combine the high efficiency of the <2-µm particles (because of the effective separation of the 0.6-µm shell and their narrow particle size distribution) with lower back pressures of 3–4 µm particles. The pellicular particles were first introduced in the late 1960s with 30–40 µm size and thin (2-µm) shells, but they fell out of favor after totally porous materials in the 5–10 µm size were produced. Superficially porous particles of 5–6 µm were reintroduced in 2000 (6) for proteins and peptides with smaller cores and shells to extend this technology to smaller particles and, more recently, they were extended to the 2.7–4 µm range. A few examples of the use of this technology are described here to illustrate their use in drug development and process work.
Tryptic Peptide Analysis
Another major need in the development of biological drugs and biosimilars is in the separation of tryptic peptide maps of the intact protein. As an example, an IgG can be deglycosylated and then digested with trypsin to generate a tryptic map, which can be a fingerprint of the protein and is often used as an identification test from lot to lot. A digest of a typical monoclonal antibody of MW 150 kDa produces approximately 60 tryptic peptides (depending on sequence), which can be separated by reversed-phase HPLC gradient elution using conventional HPLC columns. However, some of the amino acids contain PTMs such as oxidation of methionine, glycation of lysine, and deamidation of asparagine. These PTMs result in more peptides at lower levels that need to be separated from each other and the major species to identify and quantitate these levels. The use of higher-efficiency columns using smaller particles permits an expansion of the peak capacity of a typical tryptic map and the separation of many of these additional peptides.
An example of the use of these materials is shown in the top half of Figure 5 for the trypsin peptide map of a monoclonal antibody. The top chromatogram uses a 150 mm × 2.1 mm Advance Bio Peptide Mapping column (Agilent Technologies) containing 2.7-µm particles with a 0.5-µm shell. The 75-min gradient run is similar to that obtained using a more traditional 3- or 5-µm totally porous particle, but achieves a higher resolution separation (in this case 59 major peaks observed in the 70-min run) with a moderate back pressure of 211 bar. A similar separation could be achieved with a totally porous 1.7-µm column of similar chemistry; however, the back pressure of the column would be substantially higher even at a flow rate of 0.2 mL/min.
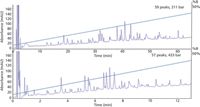
Figure 5: Comparison of separation of tryptic peptides using different gradient and flow conditions. (a) 150 mm à 2.1 mm AdvanceBio Peptide Mapping column; flow rate: 0.2 mL/min; gradient time: 14 min. (b) 100 mm à 2.1 mm AdvanceBio Peptide Mapping column; flow rate: 0.6 mL/min; gradient time: 75 min. Mobile-phase A: 0.1% formic acid in water; mobile-phase B: 90% acetonitrile in water with 0.1% formic acid; gradient: 3â35% B. (Courtesy of Agilent Technologies.)
If this comparison were the only difference, either a totally porous 1.7-µm column or a porous shell 2.7-µm column could be used to perform this separation with equal efficiencies and time of analysis. However, the porous shell offers one additional advantage not often used by most methods related to an optimal gradient separation. The initial conditions for the 150 mm × 2.1 mm column were developed by scaling the flow rate from a 1.0 mL/min from a 150 mm × 4.6 mm column down to 0.2 mL/min for a 150 mm × 2.1 mm column (scaled down by a factor of five to account for the smaller inner diameter). Although this is an appropriate scale factor for isocratic separations, gradient elution separations are more complex and require scaling both flow rate and gradient characteristics to match the separation conditions changing from column to column. The important factor is to keep the apparent k value (often referred to as k*) constant from one condition to another. According to equation 1 (7), k* can be calculated as:

where tG is the gradient time; F is the column flow rate; ΔØ is the gradient % change; Vm is the column volume, and S is a parameter related to solute molecular weight. For the purposes of this example, S can be assumed to be approximately 10 for the peptides of interest.
An original "traditional" separation using a 150 mm × 4.6 mm column with 3–5 µm particles would have tG of 75 min; F = 1.0 mL/min; ΔØ of 0.3 (10–40%); Vm of 1.5 mL, so k* would be 14.5. Since a k* value of 2–10 is optimal, the traditional separation would have been reasonable for overall resolution.
If the translation to a smaller bore column (150 mm × 2.1 mm) only included the change in flow rate to 0.2 mL/min, k* would be calculated by equation 2 (very similar to that for the traditional column)

Since k* is the important parameter for a good gradient separation and a smaller k* could provide an equivalent or better separation, the porous shell column offers an additional advantage of increasing the flow rate F (from 0.2 to 0.6 mL/min) with a concomitant decrease in the gradient time (from 75 min to 14 min) and a small decrease in column length (to 100 mm) resulting in a k* calculated in equation 3,

Thus, maintaining a reasonable k* value (and separation efficiency) while decreasing the overall run time. The comparison chromatogram in the bottom part of Figure 5 shows the result — an almost identical separation of 57 peaks with a markedly reduced run time of 14 min. Since the column back pressure is still 433 bar, this can be accomplished on either standard HPLC or UHPLC equipment.
Large-Pore Superficially Porous Particles for Protein Separations
Many of the superficially porous particles were designed with pore sizes in the range of 80–160 Å (8–16 nm) with a shell thickness of 0.5–0.6 µm (500–600 nm). To separate even larger materials such as proteins, columns with pore sizes of ≥300 Å are needed. In addition, a thin shell is desirable to create a short diffusion path for these larger molecules and maintain high efficiency of separation.
Schuster and colleagues (8) described the development and synthesis of such materials and concluded that 3.4-µm particles with 400-Å pores and a 0.2-µm shell thickness provides a good compromise of pore size, shell thickness, and mass loadability to provide improved separations. A good example for the use of such materials is the analysis and quantitation of the light chain and heavy chain portions of an IgG monoclonal antibody, including the separation of different known variants because of different glycosylation patterns on the heavy chain and other PTMs such as oxidation or pyro-glutamic acid modification.
A typical procedure for this analysis involves denaturation of the intact protein, reduction, and alkylation to produce light chain, heavy chain, and any variants because of post-translational modification. Separation is normally done only into light chain and heavy chain regions, which are then further analyzed by mass spectrometry (MS) to deconvolute the peaks into different mass variants and relative abundances.
An improved separation of the individual light chain and heavy chain variants would provide a better understanding of the actual distribution of these species. Figure 6 shows the separation of light chain and heavy chain variants along with the mass spectral data for the individual peaks. The improved resolution, especially of the light chain variants, permits a more robust comparison of these in multiple samples from different lots and sources.
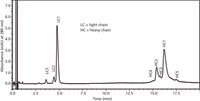
Figure 6: Liquid chromatographyâmass spectrometry (LCâMS) separation of mAb IgG1 light and heavy chains. Column: 100 mm à 2.1 mm Halo Protein C4; gradient: 29â32% B in 20 min; mobile-phase A: 0.5% (v/v) formic acid with 20 mM ammonium formate; mobile-phase B: 45% acetonitrile, 45% isopropanolâ0.5% (v/v) formic acid with 20 mM ammonium formate; temperature: 80 °C; flow rate: 0.4 mL/min; instrument: Shimadzu LCMS 2020; detection: 280 nm. (Courtesy of Advanced Material Technology.)
The peaks can also be analyzed by MS as the individual species and the component masses can be deconvoluted using the appropriate software. Table I shows the results for the three light chain peaks and the five heavy chain peaks in this example.
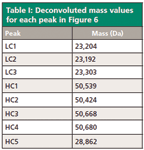
Table I: Deconvoluted mass values for each peak in Figure 6
Conclusions
The use of columns of different types, particle sizes, and pore sizes can provide significant advantages in both speed and resolution for the analysis of complex samples during drug discovery and development. Given the complex nature of many biological drugs and the need to more fully characterize these for both initial development and biosimilar development, the increased use of these types of columns and systems will be crucial to these efforts.
Acknowledgments
I would like to thank Maureen Joseph and James Martosella of Agilent, Justin Hyche and Ted Haxo of ProZyme, Bill Warren and Priya Jayaraman of Waters, and Stephanie Schuster and Jack Kirkland of Advanced Materials Technology for their help in obtaining examples used in this paper.
References
(1) S. Kozlowski, "Biosimilar Biological Products: Overview of Approval Pathway under the Biologics Price Competition and Innovation Act of 2009," presentation at the 17th Symposium on the Interface of Regulatory and Analytical Sciences for Biotechnology Health Products (WCBP 2013).
(2) K. Nakanishi and N. Soga, J. Am. Ceram. Soc. 74, 2518–2530 (1991).
(3) S. Fuller, T. Haxo, J. Hyche, M. Kimzey, S. Lockart, S. Pourkaveh, Z. Szabo, J. Truong, J. Wegstein, and V. Woolworth, "Assessing the Variability of an Innovator Molecule N-Glycan Profile," poster at the 18th Symposium on the Interface of Regulatory and Analytical Sciences for Biotechnology Health Products (WCBP 2014).
(4) www.prozyme.com/protocols/.
(5) S. Moore and W.H. Stein, J. Biol. Chem. 192, 666 (1951).
(6) J.J. Kirkland, F.A. Truszkowski, C.H. Dilks Jr., and G.S. Engel, J. Chromatogr. A 890(1), 3–13 (2000).
(7) L.R. Snyder, J.J. Kirkland, and J.W. Dolan, Introduction to Modern Liquid Chromatography, 3rd ed. (Wiley, Hoboken, New Jersey, 2010), p. 412.
(8) S.A. Schuster, B.M. Wagner, B.E. Boyes, and J.J. Kirkland, J. Chromatogr. A 1315, 118–126 (2013).
Joseph L. Glajch is Director of Analytical Development at Momenta Pharmaceuticals. He received his AB in Chemistry at Cornell University and PhD in Analytical Chemistry at the University of Georgia under L.B. (Buck) Rogers. He has held technical and R&D management positions at DuPont, Bristol-Myers Squibb, and Momenta with emphasis on HPLC column and method development and pharmaceutical development and analysis. He is also a member of the Editorial Board of LCGC North America Direct correspondence to: jglajch@momentapharma.com

Joseph L. Glajch
New Method Explored for the Detection of CECs in Crops Irrigated with Contaminated Water
April 30th 2025This new study presents a validated QuEChERS–LC-MS/MS method for detecting eight persistent, mobile, and toxic substances in escarole, tomatoes, and tomato leaves irrigated with contaminated water.

.png&w=3840&q=75)

.png&w=3840&q=75)


.png&w=3840&q=75)


.png&w=3840&q=75)


