Simultaneous Determination of Methotrexate and Sulfasalazine in Plasma by HPLC–DAD
LCGC North America
Methotrexate and sulfasalazine are often used together to treat rheumatoid arthritis, so it is valuable to be able to monitor plasma levels of both drugs simultaneously. This method achieves that by using two detector wavelengths, 304 nm for methotrexate and 358 nm for sulfasalazine.
Here we describe a simple and robust high performance liquid chromatography–diode arrray detection (HPLC–DAD) method for the simultaneous determination of methotrexate (MTX) and sulfasalazine (SSZ) from plasma. MTX and SSZ are used in combination for the treatment of rheumatoid arthritis. Using two detector wavelengths, 304 nm for MTX and 358 nm for SSZ, we were able to selectively quantitate both analytes during the same chromatographic run. The method was validated using quality control samples for critical analytical performance criteria of recovery, reproducibility, selectivity, accuracy, and precision.
Methotrexate (MTX, Figure 1) is considered an "anchor drug" in the treatment of rheumatoid arthritis and is among the most effective disease-modifying antirheumatic drugs (DMARDs) with less toxicity and better tolerability. However, MTX alone is often not able to fully control disease activity. In fact, MTX is used in combination with other nonbiological DMARDs by 99% of all rheumatologists (1–3). In a 2009 review and meta-analysis by Katchamart and colleagues (2), results from 19 clinical trials on the efficacy and toxicity of various nonbiological DMARDs in combination with MTX, or of MTX alone were compared. It was noted in this review that several of the combination drug trials (5 out of 19) were recorded evaluating the combination of MTX and sulfasalazine (SSZ, Figure 1). It has also been reported elsewhere that the MTX and SSZ combination therapy is frequently used, and it is inexpensive and efficacious for the treatment of rheumatoid arthritis (1–6).
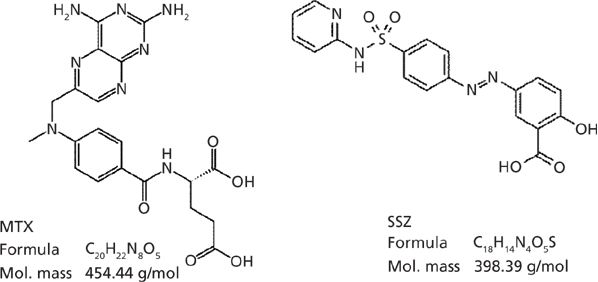
Figure 1: Structure of methotrexate (MTX) and sulfasalazine (SSZ).
The drug concentration of MTX is currently monitored in clinical practice for the adjustment of treatment (7). The clinical monitoring of the plasma concentration of SSZ as well as the patient's liver function is also performed for the detection of any immune-allergenic reaction (8). Additionally, both MTX and SSZ are highly protein bound (50% for MTX, and 99% for SSZ) and thus are likely to displace each other through interactions with plasma proteins (9,10). They also have a common mechanism of action, that is, inhibition of folate-dependent enzymes (6). Therefore, the simultaneous monitoring of plasma levels of MTX and SSZ when used in combination may have both clinical relevance as well as help further pharmacokinetic research into any synergistic effects.
The typical oral therapeutic dose of MTX used in rheumatoid arthritis ranges from 7.5 to 25 mg per week (2,3,7). Oral doses of SSZ are usually 500 mg twice daily, but may be increased to 3 g per day depending on response. However, only 2–13% of this oral dose reaches the systemic circulation in unchanged form. Thus, the highest SSZ plasma concentration found in healthy volunteers ranges from 6 μg/mL to 32 μg/mL (8). Many methods for the chromatographic analysis of MTX have been published, and their relative merits have been reviewed extensively by Rubino and colleagues (7). Most of these published methods (50 out of 72) used UV detection for the determination of MTX and the most commonly used wavelength was between 303 and 313 nm (in 42 out of 50 assays). Similarly, there are several studies about the determination of SSZ and its metabolites for clinical monitoring of its pharmacologic effects in different biological matrices. Most of these analyses have been carried out by high performance liquid chromatography (HPLC) (8). However, to our knowledge, no methods currently exist for the simultaneous determination of MTX and SSZ.
Here, we describe a simple HPLC–diode-array detection (DAD) method for the simultaneous determination of MTX and SSZ in plasma. Using two detector wavelengths we were able to selectively quantitate both analytes during the same chromatographic run. The chromatographic method was optimized for selectivity between the two analytes as well as from background matrix interferences. We have also compared two sample preparation strategies: off-line solid-phase extraction (SPE) and protein precipitation. Although the SPE approach allowed for more-sensitive detection and a wider calibration range, protein precipitation is also discussed in brief because of its simple and inexpensive nature. The bioanalytical method developed here was validated for the critical analytical performance criteria recovery, reproducibility, linearity, sensitivity, selectivity, accuracy, and precision, and those results are also presented here.
Experimental Section
Chemicals and Reagents
MTX, SSZ, methanol (Chromasolv grade), blank human plasma, ammonium hydroxide, formic acid, and ammonium acetate used in this study were all obtained from Sigma-Aldrich India. Milli-Q grade water (Millipore Corporation) was used throughout the work. All chemicals used otherwise were of analytical grade.
Instrumentation
Chromatographic analysis was carried out using an Agilent 1290 HPLC–DAD system comprising a binary pump, an autosampler equipped with a thermostat, a thermostated column compartment, and a diode-array detector equipped with a 60-mm Max-Light flow cell (Agilent Technologies). It was operated with ChemStation Openlab CDS Software Version C.01.05 (Agilent Technologies).
Calibration Standards
Stock solutions of 2000-ng/μL MTX and SSZ were prepared by dissolving each compound in 100:0.1 (v/v) methanol–ammonium hydroxide. A 200-ng/μL plasma stock solution of a combination of MTX and SSZ was prepared by spiking the appropriate volume of each stock solution into plasma. Serial dilutions from this plasma stock solution were made using blank plasma to achieve 11 concentrations of 0.01, 0.02, 0.05, 0.1, 0.2, 0.5, 1.0, 5.0, 10.0, 50.0, and 100 ng/μL. Next, 200-μL aliquots of each of these plasma calibration standard solutions were extracted using protein precipitation or SPE as described below to prepare the calibration standards.
Quality Control Samples
Three sets of quality control (QC) samples were prepared by spiking stock solutions of MTX and SSZ into plasma to yield 0.8-, 8.0-, and 80-ng/μL concentrations to be used as low, middle, and high QC samples, respectively. QC samples were analyzed in five replicates each.
Extraction from Human Plasma
Two sample preparation techniques were evaluated for the extraction of each calibration standard from plasma, namely, protein precipitation and SPE. To perform protein precipitation on a 200-μL plasma sample, double volume of 1:4 (v/v) 0.4 M zinc sulfate–methanol solution was used. After adding the precipitating reagent and vortexing for 45 s, the mixture was centrifuged at 10,000 rpm for 5 min and the resulting supernatant was used for liquid chromatography (LC) analyses.
For SPE, 100-mg, 3-mL Bond Elut-C18 cartridges (Agilent Technologies) were used for the extraction of analytes from plasma. The SPE cartridges were preconditioned with 3 × 1 mL of methanol–0.1% ammonium hydroxide, followed by 3 mL of purified (Milli-Q, Millipore) water. Then, 200 μL of each plasma standard solution was loaded onto the SPE cartridge under gentle vacuum. The cartridges were then washed three times with 1 mL of mobile-phase A under vacuum for 5 min to near dryness. The analytes were eluted from SPE cartridges with 2 × 0.5 mL of methanol–0.1% ammonium hydroxide. Eluted fractions were concentrated to dryness using a concentrator (Eppendorf) and further reconstituted with 200 μL of 100:100:0.1 (v/v/v) methanol–water–ammonium hydroxide.
HPLC–DAD Method
The separation was performed using a 150 mm × 3.0 mm, 2.7-μm Poroshell Extend-C18 column (Agilent Technologies) that was maintained at 30 °C using a column oven. Mobile-phase A was water–10 mM ammonium acetate–0.1% formic acid and mobile-phase B was methanol–10 mM ammonium acetate –0.1% formic acid. The mobile phase was freshly prepared and degassed before use. The chromatographic gradient consisted of elution with 10–95–95–10% mobile-phase B in mobile-phase A at 0–10–15–15.1 min at a flow rate of 0.8 mL/min. The column was equilibrated for 5 min using the initial mobile-phase ratio before every injection. An injection volume of 5 μL was used for all sample injections and all injections were preceded with a 10-s needle wash with methanol–0.1% ammonium hydroxide. The diode-array detector monitored two UV wavelengths, 304 nm and 358 nm, that corresponded to the absorbance maxima of MTX and SSZ, respectively.
Results and Discussion
Optimization of Plasma Extraction
The extraction efficiency for protein precipitation versus SPE was evaluated by comparing the area under the curve (AUC) of the analyte peaks from the plasma calibration standards with the AUC observed for standard solutions at a concentration of 12.5 ng/μL. The extraction efficiencies for MTX using protein precipitation and SPE were 17% and 50%, respectively. The extraction efficiencies for SSZ using protein precipitation versus SPE were 53% and 78%, respectively. Thus, the extraction efficiency proved to be significantly higher using SPE compared with protein precipitation as expected. Additionally, a detailed inspection of the chromatographic data over baseline evidenced a better resolution of the analytes from matrix interferences using SPE (Figure 2). A matrix peak (retention time = 3.57 min) eluted just before MTX while using protein precipitation was found to be completely eliminated with SPE.
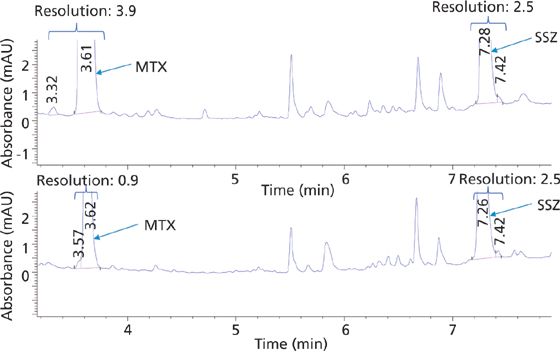
Figure 2: HPLC chromatogram of standard plasma solution 12.5 ng/μL of MTX and SSZ using SPE (top trace) and protein precipitation (bottom trace) at 304 nm.
Therefore, SPE allowed better extraction efficiency, better resolution, and thus more sensitive detection across a wider calibration range. However, because of its simple and inexpensive nature, protein precipitation may be used when the sensitivity requirements of the bioanalytical method are within the range observed here for protein precipitation.
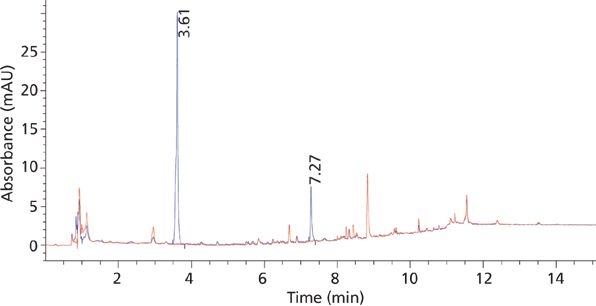
Figure 3: Elution profile of standard plasma solution of 2 ng/μL of MTX (retention time = 3.6 min) and SSZ (7.2 min) using SPE at 304 nm overlaid with blank plasma chromatogram.
Chromatographic Method Development
A C18 column was found highly retentive for the analytes, and the best separation was achieved by using a gradient of mobile-phase B in mobile-phase A as described in the experimental section. The use of a low organic mobile-phase concentration (10%) at the beginning of the gradient resulted in good resolution of the analytes from the initial polar matrix background. Also the late-eluted analyte SSZ peak was well resolved from late-eluted matrix interferences using a higher organic content (95%) at the end of the gradient run. Within a run time of 15 min, baseline separation of the target analytes from each other, as well as from matrix peaks, was accomplished using these chromatographic conditions (Figure 3).
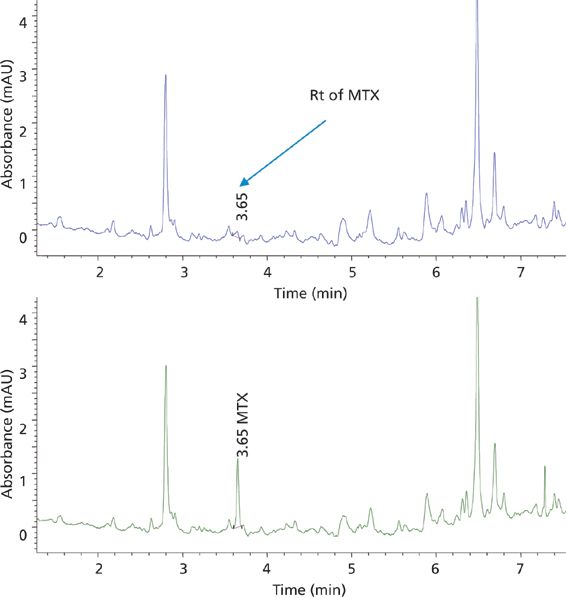
Figure 4: Elution profile of blank human plasma (top trace) and plasma spiked with MTX at the LLOQ (bottom trace) extracted with SPE.
Method Validation
Method Selectivity
The demonstration of selectivity for the analytes in the presence of matrix interferences is of high interest for a bioanalytical method. In this study, the selectivity of the method for the two analytes, MTX and SSZ, during the chromatographic elution was examined across the elution window at the lower limit of quantification (LLOQ). The LLOQ was established as the lowest concentration on the calibration curve. At the LLOQ, the analyte response was at least five times higher compared to the blank response. Figures 4 and 5 provide chromatograms of MTX and SSZ calibration standards at the LLOQ, respectively. Minor interferences were observed; however, these did not impact peak integration and quantitation of analytes at LLOQ.
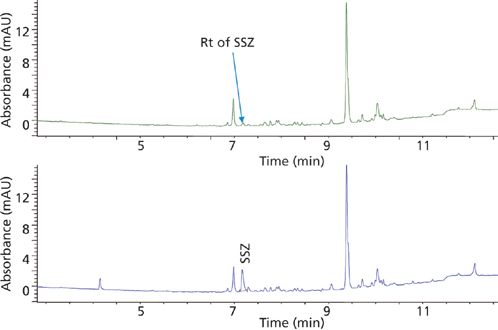
Figure 5: Elution profile of blank human plasma (top trace) and plasma spiked with SSZ at the LLOQ (bottom trace) extracted with SPE.
Method Linearity
A study of method linearity was performed by constructing calibration curves consistent with the Food and Drug Administration's (FDA) draft guidance for bioanalytical method validation (11) across several concentration levels including the LLOQ and upper limit of quantification (ULOQ) in five replicates. Calibration curves were constructed for peak area versus concentration and it was observed that the area response was linearly and correctly regressed over a wide concentration range. The linear dynamic range for the current bioanalytical method is 0.02–100 ng/μL for MTX and 0.1–100 ng/μL for SSZ. The coefficient of correlation (R2) was greater than 0.998 in each case. The calibration curves for both analytes are shown in Figure 6. Observed accuracy values for each linearity level for MTX and SSZ are summarized in Table I. The accuracy of the method at the LLOQ was 85% for MTX and 107.1% for SSZ. Consistent with the FDA guidelines, the observed precision standard deviation at LLOQ was below 20% and for all other concentration levels including the ULOQ, the precision standard deviation observed was below 15%.
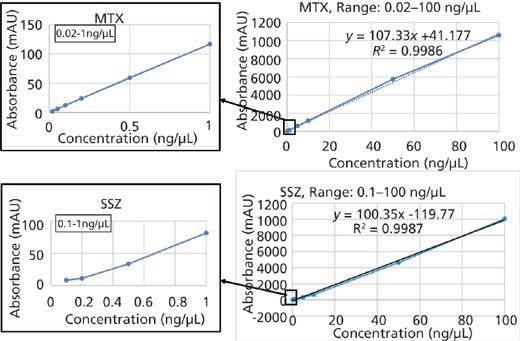
Figure 6: Linearity curves for MTX (top) and SSZ (bottom). A zoomed-in view for lower linearity levels is also shown.
Limits of Detection and LLOQ
The limits of detection (LOD) and LLOQ were determined at signal-to-noise ratios (S/N) at or greater than 3 and 10 for both MTX and SSZ, respectively. Thus, the LOD and LLOQ for MTX were 0.01 and 0.02 ng/μL with S/N values of 6 and 10, respectively. For SSZ the LOD and LLOQ were 0.05 and 0.1 ng/μL with S/N values of 8 and 18, respectively. Figure 7 shows a typical chromatogram for MTX at the LLOQ overlaid with blank traces in replicates. The chromatographic reproducibility at the LLOQ was verified by replicate injections. The percent of the coefficient of variation (%CV) of AUC and retention time at the LLOQ were 0.02% and 1.46%, respectively, for MTX, and 0.01% and 0.79%, respectively, for SSZ.
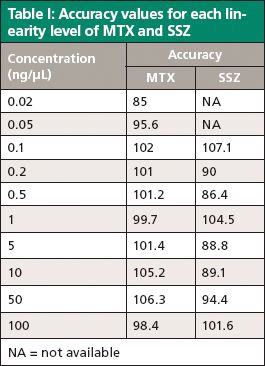
Table I: Accuracy values for each linearity level of MTX and SSZ
Analyte Recovery
Analyte recovery was measured consistent with the FDA guidance for bioanalytical method validation (12). Thus, three sets of QC samples for each analyte were analyzed in five replicates. The three sets of QC samples were selected in such a way that the concentration range covers the lower, mid, and high region of the calibration curve. The analyte recoveries from QC samples were calculated using linearity equations of each of the analytes. These results were then compared with theoretical concentrations. The resultant mean recoveries and %CV are given in Table II.
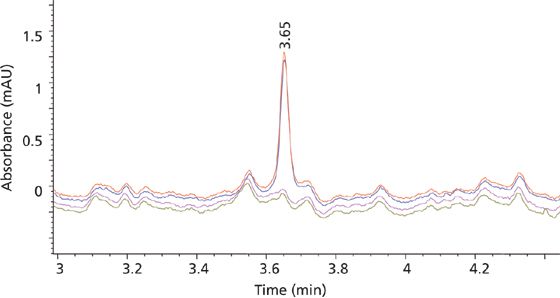
Figure 7: Chromatogram for MTX at the LLOQ overlaid with blank traces in duplicates.
Method Reproducibility
The reproducibility of the method was determined in accordance with the FDA draft guidance for bioanalytical method validation (11) by measuring the accuracy and precision of the method across three QC samples in the calibration range and using five replicates at each concentration. The results for intraday precision and accuracy in plasma quality control samples for MTX and SSZ are summarized in Table II. The calculated relative standard deviation for retention time and area was found to be within 0.1% and 0.4%, respectively. These results promise high reproducibility of the method.

Table II: QC sample results summarizing mean recoveries, accuracies, %CV of accuracies, retention time (Rt) RSD, and AUC RSD
Conclusions
A combination regimen of low-dose MTX and high-dose SSZ is frequently used to combat rheumatoid arthritis. Therefore, the simultaneous monitoring of plasma levels of MTX and SSZ has clinical relevance, and also may aid further pharmacokinetic research into any synergistic effects. Here, we described a simple, sensitive, and robust HPLC–DAD method for the simultaneous determination of MTX and SSZ in plasma. The method is linear within biologically relevant concentration ranges of 0.02–100 ng/μL (0.04–220 μM) for MTX and 0.1–100 ng/μL (0.25–251 μM) for SSZ with a R2 coefficient greater than 0.998 for each. The method has an LLOQ of 0.02 ng/μL for MTX and an LLOQ of 0.1 ng/μL for SSZ. In addition, this method to our knowledge is more sensitive, allows a wider calibration range, and can be performed using a much smaller (200 μL) volume of plasma sample than previously reported UV methods for the bioanalysis of MTX. The method was validated consistently with FDA guidance, using quality control samples for critical analytical performance criteria of recovery, reproducibility, selectivity, accuracy, and precision.
References
(1) J.R. O'Dell, R. Leff, G. Paulsen, C. Haire, J. Mallek, P.J. Eckhoff, A. Fernandez, K. Blakely, S. Wees, J. Stoner, S. Hadley, J. Felt, W. Palmer, P. Waytz, M. Churchill, L. Klassen, and G. Moore, Arthritis Rheum. 46, 1164–1170 (2002).
(2) W. Katchamart, J. Trudeau, and V. Phumethum, Ann. Rheum. Dis.68, 1105–1112 (2009).
(3) F.M.P. Meier, M. Frerix, W. Hermann, and U. Müller-Ladner, Immunotherapy5, 955–974 (2013).
(4) S. Sadray, S. Rezaee, and S. Rezakhah, J. Chromatogr. B787, 293–302 (2003).
(5) H.A. Capell, R. Madhok, D.R. Porter, R.A. L. Munro, I.B. McInnes, J.A. Hunter, M. Steven, A. Zoma, E. Morrison, M. Sambrook, F.W. Poon, R. Hampson, F. McDonald, A. Tierney, N. Henderson, and I. Ford, Ann. Rheum. Dis.66, 235–241 (2007).
(6) H.M. James, D. Gillis , P. Hissaria, S. Lester, A.A. Somogyi, L.G. Cleland, and S.M. Proudman, J. Rheumatol.35, 562–571 (2008).
(7) F.M. Rubino, J. Chromatogr. B764, 217–254 (2001).
(8) N. Pastor-Navarro, E. Gallego-Iglesias, A. Maquieira, and R. Puchades, Anal. Chim. Acta583, 377–383 (2007).
(9) M.S. Elmasry, I.S. Blagbrough, M.G. Rowan, H.M. Saleh, A.A. Kheir, and P.J. Rogers, J. Pharmaceut. Biomed. Anal.54, 646–652 (2011).
(10) U. Klotz, Clin. Pharmacokinet.10, 285–302 (1985).
(11) US Food and Drug Administration, Guidance for Industry: Bioanalytical Method Validation, Bio Pharmaceutics Revision 1, (U.S. Department of Health and Human Services, Food and Drug Administration; Center for Drug Evaluation and Research [CDER[, Center for Veterinary Medicine [CVM], Rockville, Maryland, 2013).
Siji Joseph and Sreelakshmy Menon are with the Life Science Center at Agilent Technologies India Pvt. Ltd., in Bangalore, India. Smriti Khera is with the Life Science and Diagnostics Group at Agilent Technologies, Inc., in Santa Clara, California. Direct correspondence to: Smriti_khera@agilent.com


.png&w=3840&q=75)

.png&w=3840&q=75)


.png&w=3840&q=75)


.png&w=3840&q=75)


