Separation Science in Drug Development, Part 2: High‑Throughput Characterization
LCGC Europe
This instalment provides an overview of high-throughput characterization techniques of drug leads to support small-molecule drug discovery programmes in a pharmaceutical company. Myriad analytical chemistry techniques including separation science methodologies are used to confirm the structures and identities, quantitating the concentrations of stock solutions, and measuring key physicochemical properties of the new chemical entities (NCE). A case study is used here to illustrate the details of these applications in high-throughput characterization.
This instalment provides an overview of high-throughput characterization techniques of drug leads to support small-molecule drug discovery programmes in a pharmaceutical company. Myriad analytical chemistry techniques including separation science methodologies are used to confirm the structures and identities, quantitating the concentrations of stock solutions, and measuring key physicochemical properties of the new chemical entities (NCE). A case study is used here to illustrate the details of these applications in high-throughput characterization.
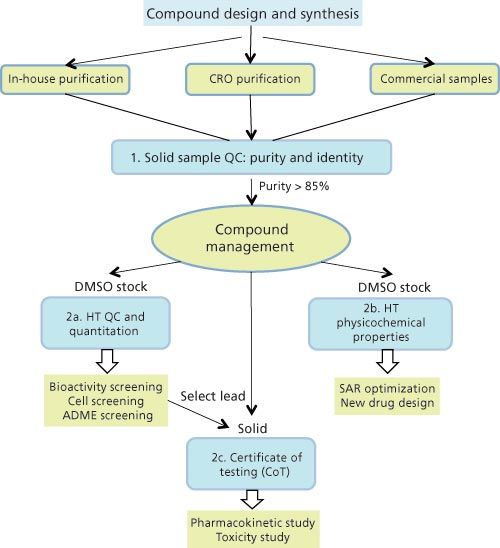
High-throughput quality control (QC) and characterization are the typical next steps after high-throughput purification of compounds of interest (COI) in the small-molecule drug discovery cycle as described in the first instalment of this series (1). Samples or COI may come from in-house medicinal chemists, contract research organizations (CRO), or purchased compound libraries. Figure 1 shows a schematic diagram of the sample workflow and key steps in our highâthroughput characterization laboratory, which may exemplify those used in other centralized analytical groups. The first step required for COI from all sources is “quality control for purity and identity” before registration and placement into a “Compound Management” or “Compound Logistics” organization. This is a centralized archival and distribution centre that creates stock solutions for a series of screening tests (for example, biological potency testing, absorptionâdistribution-metabolism-excretion [ADME] studies) and determining key physicochemical properties. Data from these screening and characterization tests are used as a feedback loop for the design of molecules with better drug-like properties by the medicinal chemist using standard drug design principles (2,3). Those molecules with satisfactory potency and ADME properties may move onto in vivo toxicology and pharmacokinetic assessments, which necessitate a fuller set of QC testing with results often documented in a formal certificate of testing (CoT). The next sections describe these processes focusing on the use of separation science methodologies. Note that the instrument selection and operating parameters used here represent a balance of speed and data quality considerations because of the high number of samples (for example, tens of thousands of samples each year in a major pharmaceutical company) (1,2).
Figure 1: Flow chart of sample workflow and processes for high-throughput analytical quality control and characterization (blue boxes) in support of small molecule drug discovery in a pharmaceutical company. HT = high-throughput; CRO = contract research organization; PK = pharmacokinetics; ADME = absorption, distribution, metabolism, and excretion; SAR = structure-activity relationship.
Step 1: Sample QC (Identity and Purity) for Compound Registration:
The first step is to confirm the identity and purity of the COI (mostly potential drug candidates) using a combination of high performance liquid chromatography–ultraviolet–mass spectrometry (HPLC–UV–MS) and nuclear magnetic resonance (NMR) spectroscopy. The purity requirements at this stage are highly dependent on the internal policy of the company and the intended assays (for example, 70–90% pure for in vitro assays [bioactivity screening] and >95% pure for in vivo pharmacokinetic [PK] or toxicity studies). Mass spectra are acquired to confirm the molecular weight and formula based on massâtoâcharge ratios (m/z) and adduct ions. Proton NMR (NMR-1H) spectra are used to confirm the compound structure and purity. The official “purity” is typically reported as percent area of the COI in liquid chromatography at a particular UV wavelength (that is, 254 nm or 220 nm). Upon meeting the identity and purity requirements, the COI is registered and then forwarded to compound management for storage and distribution.
Step 2(a): High-Throughput Quantitation - QC of DMSO Stock Solutions: In our standardized process, all potential drug candidates are tested for biological activities, potencies, and key drug-like properties (such as solubility, lipophilicity, bioavailability, and ADME). Compound management serves as a central hub for archival and distribution of all potential drug candidates, and routinely makes dimethyl sulphoxide (DMSO) stock solutions (that is, 10 mM) for easy sample handling and distribution. Although these stock solutions are carefully prepared, actual concentrations may deviate from the target concentrations because of water or salt content, sample evaporation, or degradation. Therefore, the actual concentrations of stock solutions are quantitated using a “universal detector” from a standard calibration curve. Subsequent reports of biological activity (for example, ligand binding constants) rely on these measured concentrations.
Step 2(b): High-Throughput Determination of Physicochemical Properties: According to Lipinski (3), a successful drug candidate often possesses many drug-like properties in addition to having a high binding potency to the molecular target. Physicochemical properties such as solubility, lipophilicity, and pKa are the most important ones and can be measured using high-throughput techniques. These measured properties are used by medicinal chemists to facilitate the design and optimization of potential drug molecules (4–6).
Aqueous solubility is a critical parameter for bioavailability of the drug candidates and should be measured early on for the design of biochemical assays and formulation approaches. Poorly soluble compounds pose a higher risk in drug development (2,6,7).
Lipophilicity is often “tuned” in a lead molecule to enable penetration across biological membranes or enhance interactions with receptors. Highly lipophilic compounds have poor aqueous solubilities and higher clearance while hydrophilic compounds are typically not well absorbed (3,8,9).
The charge state of the drug at physiological pH, called pKa, relates to the extent of ionization of its functional groups with respect to pH. A drug molecule should have appropriate pKa to provide un-ionized species at physiological pH values to cross membranes and perform biological functions via passive diffusion or active transport (10,11).
Step 2(c): Full Sample QC and Certificate of Testing: When sufficient potency and desirable physicochemical properties are found in a new chemical entity (NCE), the next steps are additional in vivo assays such as animal pharmacokinetics–pharmacodynamics (PK–PD) studies and toxicological investigation (12). At this stage, the sample is required to undergo further QC and characterization to generate a CoT report. The CoT typically has information such as identification and structure confirmation by high-resolution MS (HRMS) and NMR, purity determination using a longer HPLC–UV–MS method, chiral purity using supercritical fluid chromatography (SFC) (13) and polarimetry, water content by Karl Fisher, and salt determination using ion chromatography (IC) (14) or HPLC with charged aerosol detection (CAD) (15). For toxicological studies, a drug purity of >95% is expected with no individual impurities greater than 1–2%. In addition, residual solvent levels are evaluated by headspace gas chromatography (GC) (16). Identification of impurities and degradation products are not generally investigated at this stage (2,17).
Separation Science Practices in High-Throughput Characterization
This section describes the current trends in analytical instrumentation and practices of separation science in high-throughput characterization. HPLC with UV, MS, and other universal detectors remains the dominant technique for these applications, supplemented by SFC, IC, GC, and capillary electrophoresis (CE). Other common analytical techniques include MS, NMR, UV, titration, polarimetry, and turbidity, often in conjunction with well-plate automation equipment.
High-Throughput Determination for Purity and Identity: Drug candidates are diversified in structures to meet the requirements of different drug development projects for specific disease indications. At Genentech, samples could be synthetic organic molecules (racemates or single stereoisomers), organometallic complexes, peptides, or small molecule toxins of antibody–drug conjugates. Our laboratory strives to provide high-quality analytical data for more than 20,000 of these diversified samples a year with minimal sample amounts and rapid turnaround times.
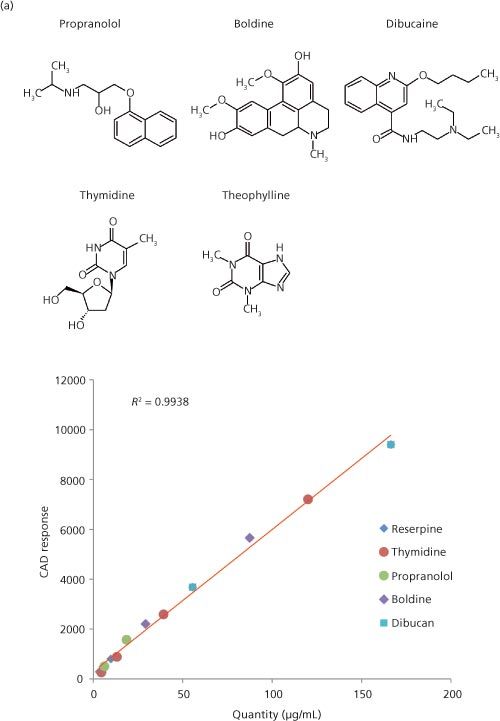
Figure 2: (a) CAD signal response from five commercial compounds using an HPLC–CAD assay with a reversed gradient addition postcolumn to maintain the eluent composition at 50% acetonitrile. The calibration curve shows that CAD signal response correlates to the mass of analyte and is independent to the structure of the analyte molecule. (b) A graph showing the correlation of CAD measured analyte concentrations to the true analyte concentrations in the calibration samples shown in (a).
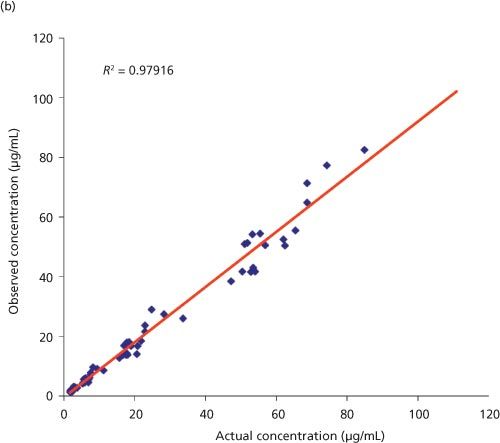
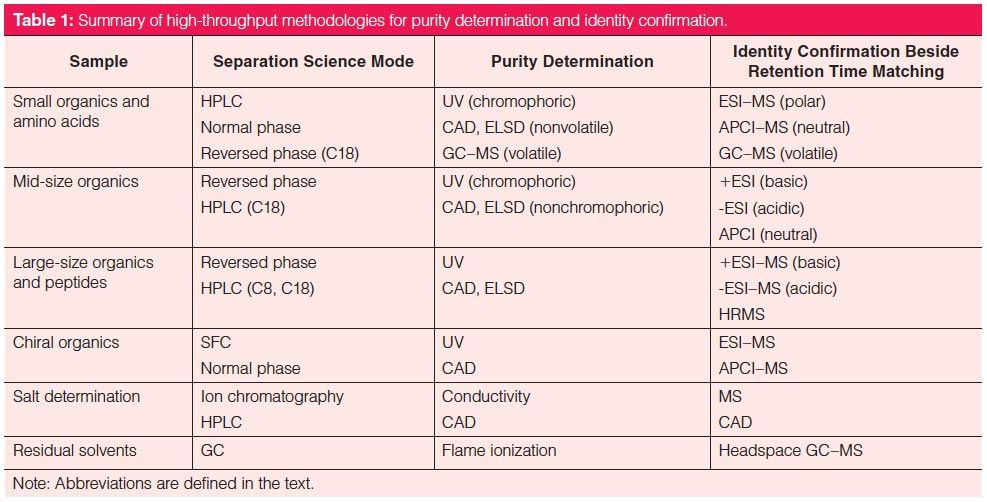
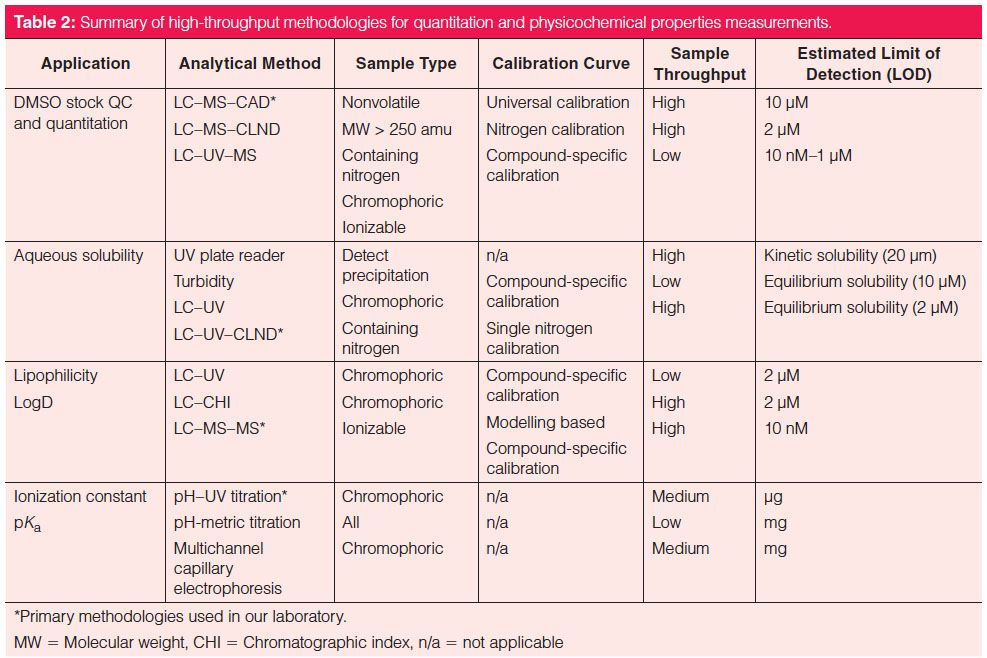
Table 1 summarizes high-throughput analytical methodologies used in purity and identity determination for the various sample types. LC–UV–MS under reversed-phase conditions is the predominant technique and requires minimal material (< 1 mg) (17). Diodeâarray detection (DAD) is the preferred UV detection method because it can provide impurity profiles and purity data as area % at any wavelength. Molecules without UV chromophores require a universal detection method such as evaporative light scattering detection (ELSD), chemiluminescent nitrogen detection (CLND), or CAD (17). Mass spectrometers provide m/z values to confirm the molecular weight and identity of the COI.
Ultrahigh-pressure LC (UHPLC) using short columns packed with sub-2-µm or sub-3-µm particles can provide excellent purity data with decent sample resolution in 2–5 min (17). Higher resolution analysis using longer gradient times (10–30 min) is used for separation of isomeric species and more detailed analysis for CoT generation. In our standard procedure, we use a UHPLC–DAD–CAD–MS system and report area % data at 220 nm, 254 nm, and CAD for all samples.
MS with electrospray ionization (ESI) can confirm compound identity using m/z values and isotopic profiles for most ionizable compounds (18). We use a single-quadrupole MS system with unit resolution for initial structure confirmation and a time-ofâflight (TOF) or a high-resolution orbital ion trap system for high-resolution MS (HRMS) for CoT reports and for large biological molecules (1000–300,000 amu). For low-ionization and neutral compounds, interfaces such as atmospheric pressure chemical ionization (APCI), electron ionization (EI), and atmospheric pressure photoionization (APPI) can be used (18). We generally use generic LC–MS methods with acidic mobile phases for +ESI (for basic compounds) and basic mobile phases for -ESI (for acidic compounds) (17). The commonly observed MS peaks for small molecules are parent ions, doubly charged ions, dimer ions, and adduct ions from sodium, potassium, ammonium, water, or trifluoroacetate (18). Common LC–MS mobileâphase additives in our laboratory are formic acid, ammonium acetate, and ammonium hydroxide (17).
For CoT reports, data on chiral purity, optical rotation, salt content, moisture level, and residual solvents are often included next to the HRMS results.
High-Throughput QC and Quantitation: The key to successful high-throughput quantitation, besides the use of faster UHPLC methods with short gradient times, is the employment of absolute calibration curves from detectors of near-universal responses to all molecules. Both UV and MS detectors have very specific and disparate response factors for different molecules and require the use of reference standards for accurate quantitation (17). This will not work at this stage of compound discovery since reference standards are rarely available and accurate weighing of individual samples or references is impractical. Several detection methods with “near-universal” signal response are widely used in high-throughput quantitation: ELSD, CAD, and CLND (17). The use of CAD and CLND is further described here.
A charged aerosol detector is a mass-sensitive detector that provides a consistent response to all nonvolatile analytes. CAD uses a nebulizing drying tube to remove mobile phase in the eluent stream leaving analyte particles that are charged by a corona discharge needle at a high voltage (17). The ionic charge is amplified, which generates a signal response proportional to the mass of the analyte. Since nebulizer efficiency is highly dependent on the mobileâphase volatility, the response is only constant under similar mobileâphase compositions. In practice, an exact postcolumn reverse-gradient flow is added by another pump to maintain a solvent composition of ~50% of the strong solvent to the CAD or concentration of the chemical that dissolves in water at a specified temperature and pH. Because of the difficulties of measuring the true solubility of chemicals at equilibrium, measured solubility values are typically termed kinetic solubility,equilibrium solubility, and thermodynamic solubility, depending on the methodology (22–24). We will only comment on highâthroughput solubility methodologies that use DMSO stock solutions (23).
The kinetic solubility measurement represents the concentration after the addition of DMSO stock solution into an aqueous buffer, normally from a few minutes to 2 h (24). Nephelometric and turbidimetric detection are widely used for kinetic solubility determination (25). In these assays, a DMSO stock solution undergoes serial dilution in DMSO to produce a range of concentrations, and then an aqueous buffer is added into each sample to make a final DMSO concentration of ~1–2%. In the high-concentration samples exceeding the solubility of the COI, the compounds precipitate in the aqueous buffer and establish a turbid suspension. The kinetic solubility value is defined as the concentration when no turbidity was observed for the diluted sample using a nephelometer. The assay is fast but the limit of detection is relatively poor at ~20 µM (25).
The equilibrium solubility of a compound is defined as the maximum concentration of the dissolved compound that is in a thermodynamic equilibrium with undissolved solids in the sample. The equilibrium solubility assay can be performed using either powder or DMSO stock solutions using equilibration times from several hours to over a day. The equilibrium solubility determination involves the separation of the undissolved solids by centrifugation or filtration and the quantitation of the solution using UV-visible (vis), HPLC–UV, HPLC–MS, or HPLC–UV–CLND. The primary equilibrium solubility assay used in our laboratory is based on 96-well filtration plates and UHPLC–CLND detection (26).
High-Throughput Lipophilicity LogD Assays: Lipophilicity of pharmaceuticals is typically measured as LogD values or the logarithm of the distribution constant of a COI between 1-octanol and water (typically phosphate-buffered saline [PBS] solution at pH 7.4). The gold standard in LogD determination is the traditional shake flask method, which is a lowâthroughput technique that requires a 20–50 mg sample (23,27). The analysis can be performed using LC–UV, LC–MS, or LC–MS–MS. Other common methods are pH-titration (28) and the chromatographic hydrophobicity index (CHI) approach (29). We have developed an automated modified micro shake flask method based on a 96-well plate format and a LC–MS–MS assay. The measured LogD range is between -0.5 to +5.5 with an error of ~0.5 log unit. This assay is reliable, sensitive, and capable of measuring >200 samples a day (30).
High-Throughput pKa Assays: The pKa or the negative logarithm of the ionization constant is commonly determined using pH titration with either potentiometric or UV detection (28), or multipleâchannel capillary electrophoresis (31). In our laboratory, we use a hybrid pH–UV titration assay known as the fast D-PAS method (32) with a sample analysis time of around 5 min.
Case Study Illustrating HighâThroughput Characterization of R- and S-Propranolol
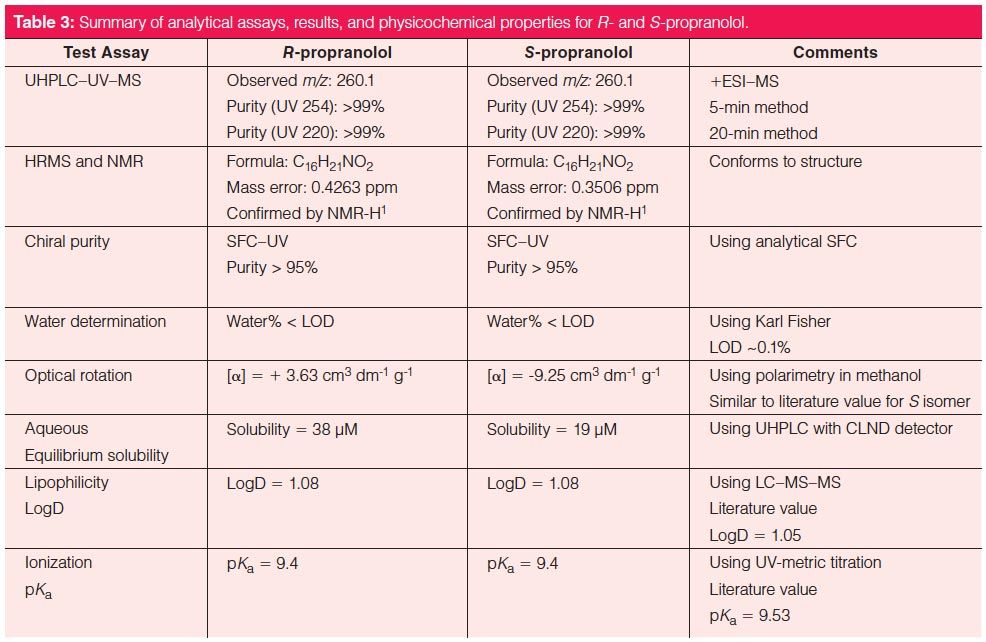
To illustrate the details and operating parameter in high-throughput characterization, we analyzed the two isolated samples of R- and S-propranolol from our highâthroughput purification laboratory (1). The analytical results are summarized in Table 3 and Figure 4 and the details of each analysis are described below.
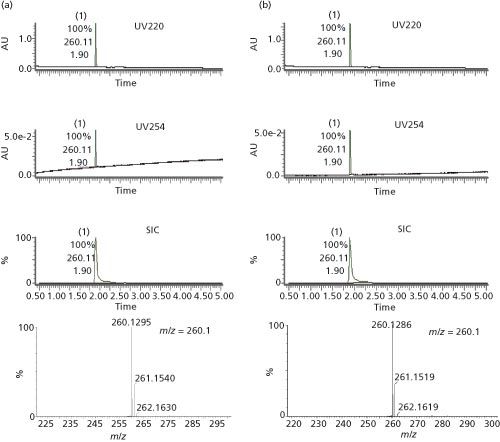
Quality Control: Purity and Identity Determination: Samples of about 0.05 mg were prepared in a diluent of 45:45:10 (v/v/v) methanol–acetonitrile–DMSO at ~0.2 mg/mL and analyzed by UHPLC–UV–MS with the 5-min and 20-min gradient methods. Experiments were performed on a Waters Acquity UHPLC system with a Waters LCT Premier XE mass spectrometer using ESI in the positive mode. The LC column was a 50 mm × 2.1 mm, 1.7-µm Waters Acquity BEH C18 column at a temperature of 40 °C. The weak mobile phase (A) was 0.05% trifluoroacetic acid in water and the strong mobile phase (B) was acetonitrile. We use 0.05% trifluoroacetic acid to improve chromatographic separation of many basic analytes and larger molecules without significantly affecting the MS sensitivity. The gradient programme for the 5 min method was 2–98% B in 4.5 min at a flow rate of 0.6 mL/min. For the 20-min method, the gradient programme was 2–98% B in 19 min. UV absorbance data were collected at 220 nm and 254 nm.
Figure 4 shows the LC–UV–MS chromatograms and mass spectra of the two propranolol enantiomers. The identity of both samples was confirmed with m/z of 260.1 and found to have purity greater than 99% at 220 and 254 nm. Chiral purities were determined to be >95% by SFC–UV determination for the two enantiomers, which were identified by comparison with genuine reference standards (1).
Figure 4: LC–UV–MS analysis for R- and S-propranolol samples isolated during high-throughput purification study in reference (1). (a) Chromatograms of MS and DAD and TOF–MS of R-propranolol; (b) chromatograms of MS and DAD and TOF–MS of S-propranolol. SIC: single ion chromatography. UV 254: UV chromatogram at 254 nm. UV 220: UV chromatogram at 220 nm.
Structure Confirmation: HRMS was used to confirm the molecular formula of each compound. The experiment was performed on a Thermo Scientific UltiMate 3000 UHPLC system with a Q-Exactive orbital trap MS system. The column was a 50 mm × 2.1 mm, 1.7-µm Phenomenex Kinetex XB-C18 column at 40 °C. The mobile phases were 0.1% formic acid in water and acetonitrile. A gradient programme of 5–95% B in 7 min was used at a flow rate of 0.6 mL/min. ESI was used with scan resolution set to 35,000. HRMS data confirmed the formula of the two samples as C16H21NO2 with a mass error of <0.1 milli-amu or 0.5 ppm. Proton NMR spectra were acquired on a Bruker 400 MHz NMR spectrometer. The samples were dissolved in ~0.6 mL of deuterated DMSO (DMSO-d6) at ~1 mg/mL concentration.
Water Determination: A Metrohm Karl Fisher instrument with a model 774 oven sample processor and a model 756 KF coulometer was used to determine moisture content. Then, 2 mg of the solid samples was weighed out into Karl Fisher vials. Both propranolol enantiomer samples were found to have very low moisture levels, less than the LOD of ~0.1%.
Optical Rotation Analysis: Optical rotation experiments were performed on a Rudolph Autopol IV OR instrument. The measured wavelength was set at 589 nm with a sodium lamp at room temperature. Samples were prepared in methanol at 3 mg/mL. The observed specific rotation were found to be ï«3.63 cm3 dm-1g-1 and -9.26 cm3 dm-1g-1 for the R- and S-enantiomers, which compared well with a literature value of -9.08 cm3 dm-1g-1 for (S)-(-)-propranolol (33).
Equilibrium Solubility: Solubility of the samples was determined by our modified micro shake flask solubility method (26). Samples were prepared by adding 4 µL of 10 mM DMSO stock solution into 196 µL of PBS at pH 7.4 to make a starting concentration as 200 µM with a final DMSO concentration of ~2%. The sample was shaken for 24 h at room temperature and then centrifuged. The concentration of the supernatant was analyzed by LC–CLND using a caffeine calibration curve. The observed solubilities were found to be 38 µM for R-propranolol and 19 µM for S-propranolol. The discrepancy of the observed results could be due to the actual solid form of the isolated samples.
Lipophilicity LogD7.4: Lipophilicity was determined by measuring the respective analyte concentrations between water and octanol partitioning phases using a modified micro shake flask method with an HPLC–MS–MS assay (30). Samples were prepared by adding 5 µL of 10 mM DMSO stock solution into 250 µL octanol following by 5 min shaking in a 96-deepwell plate (with 1 mL vial volume). A 250-µL volume of PBS at pH 7.4 was added to this sample plate and mixed for 1 h by shaking. The two phases were separated, transferred, and analyzed by LC–MS–MS using a Shimadzu Nexera UHPLC system with an AB Sciex 4000 triple-quadrupole MS system using a 3-min HPLC gradient method of 5–95% acetonitrile at a flow rate of 0.6 mL/min with a 30 mm × 3.0 mm, 2.5-µm Waters X-Bridge C18 column. Mobile-phase A was 0.1% formic acid in water, and mobileâphase B was acetonitrile. The MS–MS method used a multiple reaction monitoring (MRM) scan to detect the COI quantity in octanol phase and PBS buffer. The observed LogD7.4 values were found to be 1.08 for both enantiomers.
pKa: The pKa values of the samples were determined by the hybrid pH–UV titration assay using 5-µL aliquots of 10 mM DMSO stock solution. Experiments were performed on a Sirius T3 instrument by dissolving the DMSO stock sample in a multicomponent buffer (32) and titrating from pH 2 to 12. The pKa values of R- and S-propranolol were determined to be basic pKa of 9.4 by an abrupt change of the UV spectra for the two propranolol enantiomers.
Other Information: Since the compounds were free bases, no salt content assay by IC was performed. Also, residual solvents were not tested by GC since no toxicology studies were planned.
Summary and Conclusion
In this instalment, we reviewed the practice and trends of separation science technologies in highâthroughput quality control and characterization. We presented a sample workflow from a central analytical laboratory supporting many drug discovery programmes in a pharmaceutical company and described the analytical methodologies and results from a case study to illustrate our strategy, method choices, and operating conditions that balance analysis speed and data quality.
Acknowledgements
The authors would like to thank Mengling Wong, Brent Murphy, Yutao Jiang, and Delia Li of Genentech for their contributions to sample analysis and purification. The authors would also like to thank Snahel Patel, Dr. Larry Wigman, and Dr. Nathaniel Segraves of Genentech for their editorial inputs and suggestions.
References
- M. Wong, B. Murphy, J.H. Pease ,and M.W. Dong, LCGC Europe28(6),343–352 (2015).
- Drug Discovery and Development: Technology in Transition, 2nd Ed.,R.G. Hill and H.P. Rang, Eds. (Churchill Livingston, Edinburgh, Scotland, 2012).
- C.A. Lipinski, F. Lombardo, B.W. Dominy, and P.J. Feeney, Adv. Drug Delivery Rev.23, 3–25 (1997).
- N. Rowland and T.N. Tozer, Clinical Pharmacokinetics and Pharmacodynamics: Concepts and Applications, 4th Ed. (Lippincott, Williams and Wilkins, Philadelphia, Pennsylvania, USA, 2010).
- Preclinical Development Handbook: ADME and Biopharmaceutical Properties, S.C. Gad, Ed. (Wiley-Interscience, Hoboken, New Jersey, USA, 2008).
- R.J. Young, Physical Properties in Drug Design, Top Med. Chem.9, 1–68 (2015).
- L. Zhou, L. Yang, S. Tilton, and J. Wang, J. Pharm. Sci. 96, 3052–3071 (2007).
- V. Pliska, B. Testa, and H. van de Waterbeemd, Lipophilicity in Drug Action and Toxicology (VCH Publishers, Weinheim, Germany, 1996).
- H. Van de Waterbeemd, D.A. Smith, K. Beaumount, and D.K. Walker, J. Med. Chem.44, 1313–1333 (2001).
- K.J. Box and J.E.A. Comer, Current Drug Metab. 9, 869–878 (2008).
- H. Wan and J. Ulander, Drug Metab. Toxicol. 2(1), 139–155 (2006).
- Y. Guo and H. Shen, Methods in Pharmacology and Toxicology: Optimization in Drug Discovery: In Vitro Methods (Humana Press Inc., Totowa, New Jersey, USA, 2004).
- Supercritical Fluid Chromatography: Advances and Applications in Pharmaceutical Analysis, G.K. Webster, Ed. (CRC Press, Taylor and Francis, Boca Raton, Florida, USA, 2014).
- C. Pohl, in Handbook of Pharmaceutical Analysis by HPLC, S. Ahuja and M.W. Dong, Eds. (Elsevier/Academic Press, Amsterdam, Netherlands, 2005), chapter 8.
- K. Zhang, L. Dai, and N. Chetwyn, J. Chromatogr. A1217, 5776–5784 (2010).
- L. Dai, A.C. Quiroga, K. Zhang, H.B. Runes, D.T. Yazzie, K. Mistry, N.P. Chetwyn, and M.W. Dong, LCGC North Am.28(1), 54–66 (2010).
- M.W. Dong, Modern HPLC for Practicing Scientists (Wiley, Hoboken, New Jersey, USA, 2006), chapters 2, 4, and 8.
- E. de Hoffmann and V. Stroobant, Mass Spectrometry: Principles and Applications (Wiley-Interscience, Hoboken, New Jersey, USA, 2007).
- T. Gorecki, F. Lynen, R. Azucs, and P. Sandra, Anal. Chem. 78, 3186–3192 (2006).
- X. Liang, H. Patel, J. Young, P. Shah, and T. Raglione, J. Pharm. and Biomed. Analysis4, 723–730 (2008).
- B. Yan, J. Zhao, K. Leopold, B. Zhang, and G. Jiang, Anal. Chem. 79, 718–726 (2007).
- Handbook of Pharmaceutical Salts Properties, Selection and Use, P.H. Stahl and C.G. Wermuth, Eds. (Wiley VCH, Weinhelm, Germany, 2008).
- Drug Bioavailability: Estimation of Solubility, Permeability, Absorption and Bioavailability, Volume 40, H. van de Waterbeemd and B. Testa, Eds. (Wiley VCH, Weinhelm, Germany, 2008).
- C. Saal and A.C. Petereit, Euro. J. Pharm. Sci.47, 589–595 (2012).
- C.D. Bevan, Anal. Chem. 72(8), 1781–1787 (2000).
- B. Lin and J.H. Pease, in preparation for Comb. Chem. High Throughput Screening
- E.H. Kerns, J. Pharm. Sci.94, 1–16 (2001).
- A. Avdeef, Absorption and Drug Development: Solubility, Permeability, and Charge State (Wiley-Interscience, Hoboken, New Jersey, USA, 2003).
- K. Valko, C. Bevan, and D. Reynolds, Anal. Chem. 69(11), 2022–9 (1997).
- B. Lin and J.H. Pease, Comb. Chem. High Throughput Screening16, 817–825 (2013).
- I. Nikcevic, A. Piruska, K.R. Wehmeyer, C.J. Seliskar, P.A. Limbach, and W.R. Heineman, Electrophoresis31(16), 2796–2803 (2010).
- K. Box, C. Bevan, J. Comer, A. Hill, R. Allen, and D. Reynolds, Anal. Chem. 75, 883–892 (2003).
- H. Eshghi and H.P. Yazdi, Islamic Repub. Iran 14(1), 17–19 (2003).
Baiwei Lin is an analytical scientist and a manager for the analytical laboratory in Small Molecule Discovery Chemistry at Genentech, Inc. She earned a BS in chemical engineering at Dalian University in China and a MS in chemical engineering from Montana State University. She later pursued a PhD in analytical chemistry from Montana State University. After graduating, she joined Berlex Biosciences in 1993 as a scientist specializing in LC–MS method development for small molecules, peptides, and proteins, and DMPK characterization. In 2007, Baiwei joined Genentech’s small molecule analytical group and continues to develop methods for high throughput QC, characterization, quantification, and physicochemical property determination.
Joseph H. Pease leads the Analytical Chemistry & Purification Department in Small Molecule Discovery Chemistry at Genentech, Inc. He earned a BS degree in chemistry from U.C. Davis and a PhD in biophysical chemistry from U.C. Berkeley. Joe joined Syntex in 1990 as a research scientist specializing in NMR and structureâbased drug discovery. After Roche acquired Syntex in 1994 to form Roche Bioscience, he stayed with the company until its closure in 2010 and then joined Genentech in 2011. During his career, Dr. Pease has held leadership positions in discovery research, preclinical development, and informatics.
Michael W. Dong is a principal in MWD Consulting focusing on training and consulting services in HPLC, UHPLC, pharmaceutical analysis, and drug quality. He was formerly Senior Scientist at Genentech, Small Molecule Analytical Chemistry and QC, Research Director at Synomics Pharma, Research Fellow at Purdue Pharma, and Senior Staff Scientist at Applied Biosystems/PerkinElmer. He holds a PhD in analytical chemistry from City University of New York, and a certificate in biotechnology at University of California, Santa Cruz. He has more than 100 publications and a best-seller in chromatography. He is an editorial advisory board member of LCGC North America. Direct correspondence to:
michaelwdong2015@gmail.com

Determining the Effects of ‘Quantitative Marinating’ on Crayfish Meat with HS-GC-IMS
April 30th 2025A novel method called quantitative marinating (QM) was developed to reduce industrial waste during the processing of crayfish meat, with the taste, flavor, and aroma of crayfish meat processed by various techniques investigated. Headspace-gas chromatography-ion mobility spectrometry (HS-GC-IMS) was used to determine volatile compounds of meat examined.
University of Tasmania Researchers Explore Haloacetic Acid Determiniation in Water with capLC–MS
April 29th 2025Haloacetic acid detection has become important when analyzing drinking and swimming pool water. University of Tasmania researchers have begun applying capillary liquid chromatography as a means of detecting these substances.
Using GC-MS to Measure Improvement Efforts to TNT-Contaminated Soil
April 29th 2025Researchers developing a plant microbial consortium that can repair in-situ high concentration TNT (1434 mg/kg) contaminated soil, as well as overcome the limitations of previous studies that only focused on simulated pollution, used untargeted metabolone gas chromatography-mass spectrometry (GC-MS) to measure their success.

.png&w=3840&q=75)

.png&w=3840&q=75)


.png&w=3840&q=75)


.png&w=3840&q=75)


![PEFTEC-Header[2].jpg PEFTEC-Header[2].jpg](/_next/image?url=https%3A%2F%2Fcdn.sanity.io%2Fimages%2F0vv8moc6%2Fchroma%2Fecf65f783b8e1faface63b195f44801441785652-990x250.jpg%3Ffit%3Dcrop%26auto%3Dformat&w=3840&q=75)


