Overload in Liquid Chromatography
How to distinguish between liquid chromatography (LC) column overload and detector overload.
How to distinguish between liquid chromatography (LC) column overload and detector overload.
For many applications of liquid chromatography (LC), the goal is to measure very small quantities of the analytes of interest. In such cases, the problems associated with too much sample are rarely encountered. However, problems at the other end of the scale exist when more of an analyte is present than can be accommodated by the LC system. This situation is usually referred to as overload. Overload most commonly occurs as column overload or detector overload. This month’s “LC Troubleshooting” article looks at these two overload types, their causes, and possible solutions to correct the problem.
What Are the Symptoms?
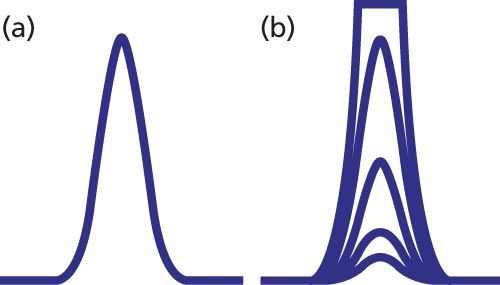
An ideal chromatographic peak is Gaussian in shape, as seen in Figure 1(a). However, perfectly symmetric peaks are rare in LC separations, with most peaks tailing a bit. LC detectors are designed so that an increase in peak height and peak area are seen with an increase in the concentration of sample injected onto the column. With ultraviolet (UV) absorbance detectors, for example, we expect the peak area and height to increase in proportion to the sample size, as seen for the four smaller nested peaks of Figure 1(b). When the sample concentration exceeds the range of the detector, the detector cannot generate a larger response, and typically a flat-topped peak is observed, as for the largest peak of Figure 1(b). This is referred to as detector overload.
Figure 1: Simulated chromatograms illustrating (a) normal peak shape and (b) increasing mass on column until detector overload occurs.

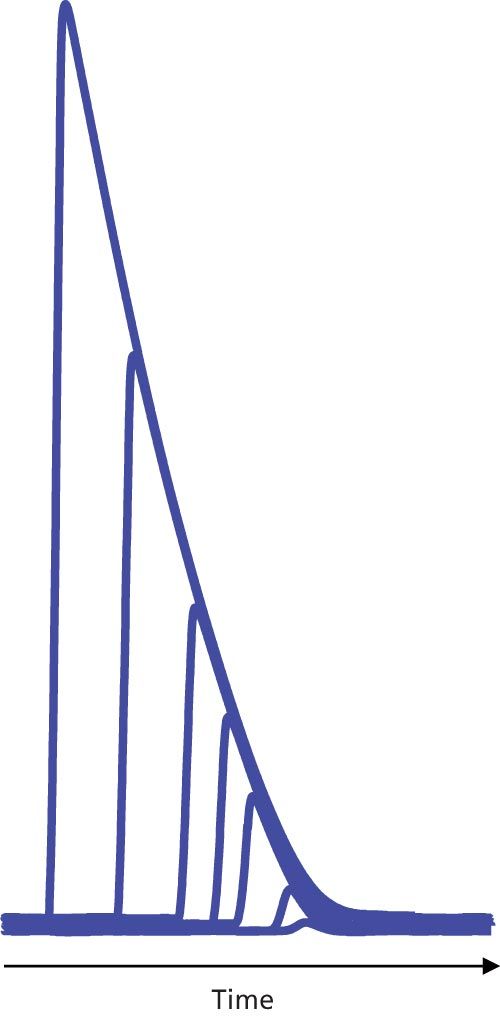
A second type of overload in LC occurs when the detector responds properly, but the capacity of the column to interact normally with sample molecules is exceeded. In such cases, the classic symptoms are reduced retention time for the peak apex and an increasingly steep front edge of the peak until the peak takes on a rightâtriangle appearance, as in Figure 2.
Figure 2: Column overload for injected masses of 10 ng to 5 µg of nortriptyline on a 150 mm × 4.6 mm, 3.5-µm particle size C18 column with a mobile-phase pH of 2.7. Adapted from reference 1.

Of course, a combination of column and detector overload can occur, where column overload, as in Figure 2, occurs first, but at some point, detector overload will occur and the right-triangle peaks of Figure 2 would take on the additional characteristic of flat tops. This combination is rare in analytical separations, but can be common for preparative separations, where column overload is intentional so as to increase the throughput in terms of mass of sample per hour; in such cases, detector overload may not be of much concern, either. We won’t consider preparative separations further here.
Column Overload
Let’s first consider column overload in more detail, because it is more commonly encountered by most workers than detector overload is. To conceptually illustrate column overload, I like to consider an imaginary column that comprises a series of 250-mL beakers lined up side by side. If we have a 100-mL sample, we can pour the entire sample into the first beaker, then pick up the first beaker and pour it into the second, the second into the third, and so forth until we get to the end of the column, perhaps 100 beakers later. The entire sample is still contained in a single beaker, ignoring minor losses along the way because of incomplete transfers. This situation is analogous to normal sample loading on an LC column. If, on the other hand, we have a 1000-mL sample, it completely fills the first 250-mL beaker, so we move to the next one and fill it, and the next and the next. Now the sample fills four 250-mL beakers. When we pick up the first beaker to transfer it down the column, we have to skip to the fifth beaker before we can find room. Similarly, the second goes to number 6, 3 to 7, and so forth. This is analogous to column overload - the band on the column is considerably wider (broader peaks) and the centre of mass travels faster than normal (shorter retention). Of course, the column doesn’t really contain beakers, but it does have “active sites”, where chemical interaction between the solute and the stationary phase can take place. When an active site is “busy” interacting with one sample molecule, a new molecule may displace it or may continue travelling in the mobile phase until a free active site is available for interaction. In either case, the result is the same, with shorter retention times and broader peaks.
The test to confirm column overload is obvious - reduce the amount of sample on column, and if the retention time increases and peak width is reduced, overload is confirmed. For the example of Figure 2, as the amount of sample on column is reduced, we would see the progression of peaks from left to right until the retention time and peak shape stabilize. Although not shown in Figure 2, further reductions in solute concentration would produce a series of peaks similar to the four smaller peaks in Figure 1(b), where peak height and area are proportional to the amount of sample on column, but the peak width and retention time are constant.
Column Overload Is Not a Simple Process
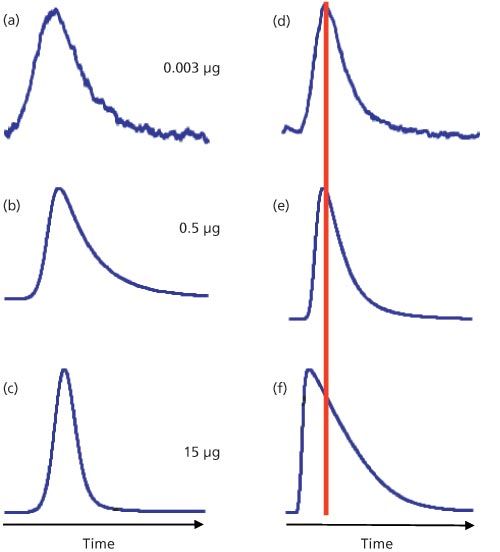
Column overload, as described above, is conceptually simple, but it can be much more complicated with real samples. We can see this in the example of Figure 3. On the left is a series of injections of increasing mass of mefenamic acid at low pH. As the injected sample mass increases from 3 ng (Figure 3[a]) to 500 ng (Figure 3[b]) to 15 µg (Figure 3[c]), we observe a peak that changes shape as the mass on column grows. However, the peak tailing decreases and no shift in retention is observed. At the mobile-phase pH of 2.8, the solute, mefenamic acid, is well below its pKa (4.2), and is retained primarily by its hydrophobic interaction with the C18 stationary phase. The capacity of the column is not exceeded, so no signs of overload are seen.
Figure 3: Behaviour of (a–c) mefenamic acid and (d–f) amitriptyline injected on a 150 mm × 4.6 mm, 5-µm particle size C18 column with a mobile-phase pH of 2.8. Injected masses as indicated. Adapted from reference 2.

Consider the same conditions for amitriptyline, a tricyclic antidepressant drug with a pKa of 9.4. At pH 2.8, this basic solute is strongly ionized. At a loading of 500 ng on column (Figure 3[e]), the symptoms of overload appear with a slight decrease in retention and steepening of the leading edge of the peak. By 15 µg on column (Figure 3[f]), the classic right-triangle peak shape and reduced retention of column overload appear.
Why does mefenamic acid behave normally and amitriptyline severely overload under the same conditions? This is likely because of the interaction of amitriptyline with the column. The surface area of the column is almost exclusively inside the column pores, so to interact with the C18 stationary phase bonded to the column, sample molecules must diffuse into the pores. In its charged state, amitriptyline will interact with the stationary phase in the lowest energy configuration, which means that the nonpolar part of the molecule will be attracted to the nonpolar C18 groups by hydrophobic forces and the ionized portion of the molecule will favour the more polar mobile phase within the pore. Thus, the interior of the pore will take on a more and more positive charge as the amitriptyline load increases. At some point, this charge will repel additional positively charged solute molecules through a process called ion exclusion. As a result, the amitriptyline molecules must continue through the column until they find pores that are not so heavily loaded, so they are not repelled. A similar pattern is shown in the overlaid chromatograms of the related compound, nortriptyline, in Figure 2 with sample loadings of 10 ng to 5 µg on a C18 column.
Detector Overload
Detector overload is also simple in concept. All LC detectors have a limited response range. Below a certain concentration of analyte, no signal is seen, and above a higher concentration of analyte, the same signal will be observed for all higher concentrations. As the peak height, which represents the concentration of analyte at the centre of the peak, approaches the upper end of the linear range of the detector, the response will drop off in a usually nonlinear manner with the increase in peak height until the response versus concentration curve flattens out. This will result in flat-topped peaks. This flattening is usually not a sharp transition, as is seen in the simulated peak of Figure 1, but more commonly will result in some rounding of the peak from the normal peak front increase (or back decrease) to a flat-topped peak.
Sometimes detector overload can occur at sample concentrations much lower than were experienced previously for the same method. This can happen if the baseline is significantly elevated above the true zero signal. Take, for example, a UV detector with a linear range up to 1.0 absorbance unit (1 AU). If the mobile phase background has no UV absorbance at the selected wavelength, the response should be linear up to 1 AU. However, if the mobile phase has significant UV absorbance, as may be the case when ion-pairing reagents or other UV-active compounds are added to the mobile phase, the linear range may appear to be reduced. For example, if the baseline background has an absolute absorbance of 0.2 AU, it may be autozeroed to appear at the bottom of the computer display, but the remaining linear response range would only be 0.8 AU. Thus a peak with 0.9 AU of absolute absorbance would overload the detector.
The Importance of Peak Volume
Any process in the LC system that reduces the volumetric peak width of the analyte can contribute to both column and detector overload. This is because in each case, overload is determined by the concentration of sample at the peak apex, not just the mass on column. Thus, a broad peak of the same sample mass on column may not overload, whereas the same sample mass appearing as a narrow peak may overload the column or detector. Several factors in modern LC applications can contribute to smaller peak volumes. A reduction in column diameter will reduce the peak volume in proportion to the change in crossâsectional area. For example, you may want to reduce solvent consumption in the laboratory, so you switch from a 150 mm × 4.6 mm column to a 150 mm × 2.1 mm column. The cross-sectional area change is (4.6/2.1)2 = 4.8 ≈ 5, so you reduce the flow rate from 1.5 mL/min to 0.3 mL/min to have the same linear velocity of the mobile phase and the same retention times. You benefit from a fivefold saving in mobile-phase consumption. The peak volume will also decrease five times, so the peak will be five times as tall. This sounds like good news, but you may experience other problems. The injection volume will be five times as large, which may cause injectionârelated peak broadening or splitting, especially for early peaks in the column. The injected mass would also be relatively five times as large, which may cause column or detector overload. In theory, you should reduce the injection volume by five times to avoid these problems. However, if the original method was well within the limits of injection volume and below the overload limits, you may be able to gain response (peak height) if the injection volume can be reduced by less than fivefold. You’ll have to test this experimentally to find the limits. Remember to build in an adequate safety margin for normal variations experienced in day-to-day use of the method.
Similar problems of potential overload can occur whenever the peak volume is reduced by other system changes. Reductions in column length or diameter as well as smaller packing particle sizes all contribute to smaller peak volumes. These can happen when switching from conventional LC with a 150 mm × 4.6 mm column packed with 5-µm particles to LC–mass spectrometry (LC–MS) with 50 mm × 2.1 mm columns and 3-µm particles or to ultrahigh-pressure LC (UHPLC) with 50–100 mm × 2.1 mm columns packed with sub-2-µm particles.
Additional Solutions
The example given above for a smaller-diameter column could be mitigated by reducing the mass of sample injected. This solution will reduce overload in most situations. If detector overload is encountered, a change in detection wavelength to one with less absorbance may be useful for UV detection. Another alternative might be to change to another detector type. For example, refractive index and evaporative light scattering detectors are often avoided because of their poor response relative to UV, fluorescence, or MS detection, but if sample concentrations are high, one of these detectors may be just what
is needed.
References
- D.V. McCalley, Anal. Chem.78, 2532 (2006).
- D.H. Marchand, L.R. Snyder, and J.W. Dolan, J. Chromatogr. A.1191, 2–20 (2008).
John Dolan is vice president of LC Resources, Walnut Creek, California, USA. He is also a member of LCGC Europe’s editorial advisory board. Direct correspondence about this column should go to: “LC Troubleshooting”, LCGC Europe, Honeycomb West, Chester Business Park, Wrexham Road, Chester, CH4 9QH, UK, or e-mail the editorâinâchief, Alasdair Matheson, at amatheson@advanstar.com

The Next Frontier for Mass Spectrometry: Maximizing Ion Utilization
January 20th 2025In this podcast, Daniel DeBord, CTO of MOBILion Systems, describes a new high resolution mass spectrometry approach that promises to increase speed and sensitivity in omics applications. MOBILion recently introduced the PAMAF mode of operation, which stands for parallel accumulation with mobility aligned fragmentation. It substantially increases the fraction of ions used for mass spectrometry analysis by replacing the functionality of the quadrupole with high resolution ion mobility. Listen to learn more about this exciting new development.
The Complexity of Oligonucleotide Separations
January 9th 2025Peter Pellegrinelli, Applications Specialist at Advanced Materials Technology (AMT) explains the complexity of oligonucleotide separations due to the unique chemical properties of these molecules. Issues such as varying length, sequence complexity, and hydrophilic-hydrophobic characteristics make efficient separations difficult. Separation scientists are addressing these challenges by modifying mobile phase compositions, using varying ion-pairing reagents, and exploring alternative separation modes like HILIC and ion-exchange chromatography. Due to these complexities, AMT has introduced the HALO® OLIGO column, which offers high-resolution, fast separations through its innovative Fused-Core® technology and high pH stability. Alongside explaining the new column, Peter looks to the future of these separations and what is next to come.