Selectivity in Reversed-Phase LC Separations, Part IV: Pressure Selectivity
LCGC North America
Can pressure alone affect the appearance of a chromatogram?
Can pressure alone affect the appearance of a chromatogram?
In this series of "LC Troubleshooting" columns, we've been looking at various factors that can influence selectivity — that is, peak spacing — in a liquid chromatography (LC) separation. An understanding of these variables can be useful if we are developing a new method or modifying an old one, as well as for troubleshooting existing separations. We started out by looking at the effect of the solvent type on peak spacing (1). We saw that changing from one solvent to another could make dramatic changes in the appearance of the chromatogram. In the next column installment (2), we found that changing the solvent strength, or percent organic solvent, was sufficiently effective to make necessary selectivity changes to improve the separation. Many workers like to use changes in the chemistry of the LC column to change the chromatogram, and this was the subject of the third article in this series (3). The use of a free database from the United States Pharmacopeia (USP) makes it possible to improve our chances of picking a column that is very similar to, or quite different from, the column we currently are using (4). This month, we'll consider another factor that can affect selectivity — pressure.
Expectations
Most of us consider the pressure that we observe in an LC separation to be an artifact of the separation conditions, and not much more than that. In other words, if we double the flow rate, we expect the back pressure to double, but that's all. And that is a fairly reasonable conclusion when we consider the pressure changes that have been made historically to LC methods. For example, we might change the flow rate from 1.0 to 1.5 mL/min and see that the pressure goes up by 50%. Or we might switch from a 150-mm-long column to a 250-mm column, and the pressure will rise by two-thirds (250/150). If some other minor changes in the separation occur, they are often ignored.
What about changes in particle size? Let's say we move from a 150 mm × 4.6 mm, 5-µm particle column to a 100 mm × 4.6 mm, 3-µm column in an effort to speed up the separation. The change in pressure is inversely related to the square of the particle size, so the pressure change due to particle size alone should be (5/3)2 ≈ 2.8-fold increase. However, shortening the column should drop the pressure by 100/150 = 67%. The combination should be the product of these two changes, or ≈1.9 times increase in pressure. If we see any small changes in peak spacing, we attribute that to minor changes in column chemistry when we change particle sizes — after all, the two packing materials have a little different history in their synthesis, right?
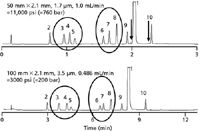
With the advent of ultrahigh-pressure LC (UHPLC), the changes in pressure that we observe when changing from one condition to another can be much larger than with the particle size changes noted above. For example, we might move a conventional LC method to UHPLC in an effort to reduce the run time. Or we might use UHPLC as a development tool, but then migrate the method to a conventional system for routine use. In such cases, large changes in pressure can be observed. In the example of Figure 1, a method was developed on a 50 mm × 2.1 mm, 1.7-µm particle column operated at 1 mL/min, which generated ≈11,000 psi of back pressure. When the method was converted to a conventional LC system, a 100 mm × 2.1 mm, 3.5-µm particle column was run at 0.486 mL/min, and the pressure dropped to ≈3000 psi. Let's see if this pressure change is reasonable. The 50- to 100-mm column length change should double pressure. The 1.7- to 3.5-µm particle change should result in a drop of (1.7/3.5)2 ≈ 4.3-fold. The flow rate change should drop the pressure by twofold. Combined, this should give 11,000 psi × 2 × 1/4.3 × 1/2 × 2500 psi, which is close enough to the observed ≈3000-psi pressure. The resulting method was suitable for its intended purpose of measuring impurities in a pharmaceutical product, providing adequate resolution of nine potential impurities and the active pharmaceutical ingredient (API). However, a close look at the chromatogram shows that peaks did move a bit relative to each other, as we can see by comparing the two sets of three circled peaks. In both cases, the upper chromatogram gives more even peak spacing between the peaks of interest.

Figure 1: Comparison of an "equivalent" gradient method at UHPLC and conventional LC pressures. Active ingredient (peak 1) plus nine impurities (peaks 2â10). Adapted from reference 1.
Surprising Observations
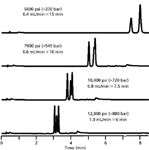
Back in 2005, when UHPLC was first becoming of commercial interest, we had a chance to examine one in our laboratory. In one of the tests we made, we ran a test mixture at several different pressures. These were run under what are considered equivalent gradient conditions. That is, the gradient volume, in terms of flow rate times the gradient time, was constant, which should give equivalent separations. You can see that the four runs in Figure 2 all have the same gradient volume (0.4 mL/min × 15 min = 0.6 × 10 = 0.8 × 7.5 = 1.0 × 6 = 6 mL). With all other variables (mobile phase, temperature, and so forth) held constant, we expected the pressure to change in proportion to the flow rate, and this is what we saw. For example, at 1 mL/min, the pressure was 12,800 psi. At 0.8 mL/min, we would expect 0.8 × 12,800 psi = 10,240 psi, which is close to the observed 10,400 psi. The same pattern was seen for the other flow rates. Shorter retention times were expected with increased flow rate and decreased gradient times, and this was observed too. What surprised me was that selectivity changed rather significantly. These separations were all done on the same column, with the same mobile phase and under "equivalent gradient" conditions, so I expected to see the same separation in each case. But look closely, and you can see that this is not at all what happened. At 5400 psi, peaks 2 and 3 overlap completely. As pressure is increased, peak 2 moves forward, relative to peaks 1 and 3. I was all excited about this and called a colleague, who calmly told me that pressure selectivity had been known since before I made my first injection. For example, in the 1960s, Giddings (6,7) pointed out that pressure changes could affect the molar volume of solutes and thus their interaction with the stationary phase. Realizing that I had not discovered something new, I filed the knowledge away in the gray matter and went about my business. Now and then I'd see an example, such as that in Figure 1, that I suspected was related to pressure selectivity.

Figure 2: "Equivalent" gradient methods under conditions shown on chromatograms.
Digging Deeper
More recently, David McCalley's laboratory published two papers that dig deeper into the relationship of pressure and selectivity (8,9). They designed some simple experiments that examined pressure alone. This helps to unravel some of the ambiguity of the examples in Figures 1 and 2. In Figure 1, the column packing, flow rate, gradient conditions, and pressure were changed. In Figure 2, the flow rate, gradient conditions, and pressure were changed. In both of these cases, although "equivalent gradient" conditions can be argued, the interpretation of gradient data is a bit more difficult than with isocratic data. One other factor that may account for some of the changes observed in Figures 1 and 2 is an inadvertent change in column temperature when the pressure is changed. When an increase in flow rate is made (all other conditions held constant), frictional heating of the column takes place, so the temperature of the column will increase. It is well known that temperature changes can affect selectivity, and this influence in addition to pressure can confuse interpretation of results, especially when other factors are changed simultaneously, such as for the results shown in Figures 1 and 2.
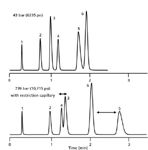
In the two chromatograms of Figure 3, only the pressure is changed, so flow-rate and temperature variations are eliminated. This is done by placing a restriction capillary after the column, between the column and the detector. (The capillary has a negligible volume, and in back-up calculations, even this volume was taken into account.) Look at the dramatic difference between these two chromatograms — peak pairs 3–4 and 5–6 both reverse when the pressure is increased from 43 to 739 bar (≈625 to ≈10,700 psi).

Figure 3: Effect of pressure on selectivity. 1 = thiourea, 2 = propranolol, 3 = diphenhydramine, 4 = acetophenone, 5 = protriptyline, 6 = nitrobenzene. C18 column, acetonitrileâbuffer (pH 2.7). Adapted from reference 8.
McCalley (8,9) looked at several different solute compounds, column stationary phases, and mobile phases to try to sort out what is happening when pressure is changed. Here are some of the conclusions:
- In reversed-phase LC, retention increases for all molecules tested when pressure is increased.
- The effect of increased retention with increased pressure is true both for conventional silica-based columns as well as hybrid inorganic-organic based columns. The effect is more dramatic for C18 columns than for shorter-chain columns, but seems to be universal for reversed-phase separations.
- The water–organic ratio of the mobile phase affects the magnitude of the increase in retention with increased pressure. (This may confuse interpretation of gradient separations, such as those in Figures 1 and 2.)
- Retention increases with increased pressure were observed for all molecule types, but polar or ionized compounds were affected more strongly than nonpolar ones of the same molecular weight, and larger molecules more than smaller ones of the same charge. In some cases, the retention changes were very large for a relatively small pressure increase. For example, prednisolone showed an increase in the retention factor, k, of ≈10%/100 bar (1450 psi) of pressure increase, although some other compounds changed by only 10% of this amount.
- For hydrophilic interaction chromatography (HILIC), the effects were the opposite of reversed-phase. That is, retention was reduced when pressure increased.
Although the physical process of this phenomenon is not completely understood, it is consistent with a change in the solute molecular volume — perhaps as the degree of hydration changes — when pressure is changed.
Practical Implications
From all of this I draw three important conclusions. First, retention increases with increased pressure are universal in reversed-phase separations. Second, these changes can be of sufficient magnitude to be readily observed under pressure changes that may be encountered in the routine LC laboratory. Third, different compounds and different states of ionization respond differently to the same change in pressure.
How can we apply this information in a practical way to our day-to-day work? Most of us have never noticed changes in retention with pressure changes. One reason is that typical changes in pressure for a given LC method are relatively small. For example, as a column ages, the pressure may increase by 50 bar (725 psi) or so before we do something to mitigate the problem, such as replacing a frit or back-flushing the column. In this environment, small changes in selectivity might be just as well assigned to small changes in column chemistry as to pressure changes. When more dramatic changes in pressure are encountered, such as by a change in particle size (Figure 1, for example) or gradient (Figures 1 and 2), any small changes may be assigned to factors other than pressure. So even if pressure selectivity is present, we may not notice it or misinterpret the cause.
Can we use pressure selectivity as a tool to control a separation, much as we discussed the use of solvent type, solvent strength, or column type in earlier articles? I think that this is a bit of a stretch at this point of our understanding of pressure selectivity. The relationships are not that well understood, the magnitude of retention changes can be small, and results may be unintentionally influenced by other factors, such as frictional heating of the mobile phase. As a result, I think it would be much better to invest our time in taking advantage of other selectivity variables instead.
However, this is not to say that we can ignore pressure-retention effects. This is especially important when methods are used both in a UHPLC environment and a conventional-pressure LC environment. The separations of Figure 1 are a good example of this. In this case, UHPLC was used in the development laboratory because of its speed. But the routine laboratory lacked the instrumentation (and perhaps skills) to run this method in the UHPLC mode. For this reason, the method was scaled to conventional pressures (<400 bar, 6000 psi) for routine use. This did not change the ability to apply the method for the intended application (nine impurities plus API), even though minor changes in selectivity were observed (circled peaks in Figure 1). What concerns me is the application to samples where all of the components are not known, such as a stability-indicating method with force-degraded samples. For example, note the peaks in the top chromatogram of Figure 1 that I've marked with arrows. What has happened to these in the lower chromatogram? Did they drop below the detection limit, did they slide under neighboring peaks because of a pressure-selectivity change, or . . . ? Fortunately, in the present application it was not important, but it could be very important in other methods.
I very much agree with one of McCalley's conclusions (8), ". . . an exact replication of the selectivity obtained when transferring methods for mixtures of different types of solute, developed with larger particle columns to small particle columns, should not necessarily be expected, even if the stationary phase particles differ only in their size." In other words, keep your eyes open for unexpected changes in peak spacing if you transfer methods from a high-pressure system to a lower-pressure one, or vice versa, if the change in pressure is more than ≈100 bar (≈1450 psi). Don't be caught by surprise!
References
(1) J.W. Dolan, LCGC 28, 1022–1027 (2010).
(2) J.W. Dolan, LCGC 29, 28–34 (2011).
(3) J.W. Dolan, LCGC 29, 236–244 (2011).
(4) PQRI database at http://www.usp.org/USPNF/columns.html
(5) J. Dai and Q. Zhang, "Strategies for Using Fast Liquid Chromatography in Method Development," oral presentation at Pittsburgh Conference (2008).
(6) J.C. Giddings, Sep. Sci. 1, 73 (1966).
(7) J.C. Giddings, Dynamics of Chromatography, Part I (Dekker, New York, 1965).
(8) M.M. Fallas, U.D. Neue, M.R. Hadley, and D.V. McCalley, J. Chromatogr. A 1209, 195–205 (2008).
(9) M.M. Fallas, U.D. Neue, M.R. Hadley, and D.V. McCalley, J. Chromatogr. A 1209, 276–284 (2008).
John W. Dolan
"LC Troubleshooting" Editor John Dolan has been writing "LC Troubleshooting" for LCGC for more than 25 years. One of the industry's most respected professionals, John is currently the Vice President of and a principal instructor for LC Resources, Walnut Creek, California. He is also a member of LCGC's editorial advisory board. Direct correspondence about this column via e-mail to John.Dolan@LCResources.com.

John W. Dolan

Common Challenges in Nitrosamine Analysis: An LCGC International Peer Exchange
April 15th 2025A recent roundtable discussion featuring Aloka Srinivasan of Raaha, Mayank Bhanti of the United States Pharmacopeia (USP), and Amber Burch of Purisys discussed the challenges surrounding nitrosamine analysis in pharmaceuticals.
Extracting Estrogenic Hormones Using Rotating Disk and Modified Clays
April 14th 2025University of Caldas and University of Chile researchers extracted estrogenic hormones from wastewater samples using rotating disk sorption extraction. After extraction, the concentrated analytes were measured using liquid chromatography coupled with photodiode array detection (HPLC-PDA).


