Screening by LC–MS-MS and Fast Chromatography: An Alternative Approach to Traditional Immunoassays?
Special Issues
A new technique was developed based on liquid chromatography coupled with tandem mass spectrometry to analyze drugs that are not part of current immunoassay screening, specifically zolpidem, zopiclone, and zaleplone, or "z-drugs."
In our routine drug analysis workflow, urine samples originating from traffic control or accidents and from intoxications are screened by immunoassay (cloned enzyme donor immunoassay) with good selectivity and sensitivity for illegal drugs, psychotropic drugs, hypnotics, and tranquilizers. However, zolpidem, zopiclone, and zaleplone — three important hypnotics — are not part of current immunoassay screening and there is no antibody available for these three compounds. To overcome this disadvantage of our screening workflow, a new technique was developed based on liquid chromatography coupled with tandem mass spectrometry with very short run times, combined with column switching. This method allows for the simultaneous quantification of the "z-drugs" and all major benzodiazepines in human urine samples.
In forensic and clinical chemistry a fast response to incoming samples is essential because the presence or absence of selected legal or illegal compounds is used for decision-making in cases of forensic samples and how to initiate an immediate treatment for patients in cases for clinical samples. Immunoassays are a widely established and mature approach to achieve the goal of fast response with acceptable selectivity and precision. Nevertheless these biological tests may exhibit some disadvantages. The potential disadvantages include cross reactivities with chemically related compounds or even unrelated compounds; structurally related compounds that are detected as a group; and the use of cut-off values with relative narrow ranges instead of exact concentration values. With our current immunoassay screening, which is based on the cloned enzyme donor immunoassay (CEDIA) chemistry (1–3), there is no antibody available for zolpidem, zopiclone, and zaleplone (referred to as "z-drugs"). For other immunoassay types — for example, the enzyme multiplied immunoassay technique (EMIT) (4) or enzyme linked immunosorbent assay (ELISA) (5) — screening tests for z-drugs are commercially available, but these biochemical tests are not compatible with our installed instrumentation. As a result, an alternative approach for the measurement of z-drugs was necessary because the use of these drugs is steadily increasing.
Liquid chromatography coupled to tandem mass spectrometry (LC–MS-MS) was the first choice for the development of a novel screening method because in our laboratory LC–MS-MS methods for the quantification of hypnotics and tranquilizers were already established and several methods for the quantification of these compounds have been published (6–13). In addition, previous work (14) illustrated the major advantages of two-dimensional LC (on-line solid-phase extraction [SPE]) for the analysis of forensic samples.
The analysis of drugs by two-dimensional high performance liquid chromatography (HPLC) (injection of prepared samples onto a trapping column and subsequent detection by elution through an analytical column) combined with UV detection was presented by R. Wyss and colleagues (15,16). This particular method was developed for the quantification of retinoids in human plasma and has been applied ever since. Most of these retinoids can be detected at a wavelength of 360 nm with high sensitivity after protein precipitation of plasma samples.
HPLC coupled to electrospray ionization (ESI) and MS-MS in combination with column switching was introduced in the 1990s and has been used in different applications areas. In particular, if smaller column diameters are used (such as with capillary columns) the direct injection is limited to very small volumes and therefore reduces the benefits of using capillary columns. To overcome this limitation, a two-dimensional approach is mainly used in which a larger volume is injected to a trapping column with a larger diameter in the first step and then eluted to the analytical (capillary) column. This approach is state of the art for any protein or peptide analysis where low concentrations need to be detected and baseline separation is beneficial for any data dependent acquisition controlled by the software of the mass spectrometer (17).
At the same time different groups introduced the analysis of pharmaceuticals by two-dimensional HPLC combined with atmospheric pressure ionization (ESI or APCI) on triple-stage quadrupole mass spectrometers (18–20). Many different advantages were achieved by two-dimensional HPLC in this application area. Parts of the sample preparation were implemented in-line with the chromatographic separation (for example on-line SPE); salts, lipids, and other impurities could be flushed into waste before they reached the ionization source, which allowed for simple sample preparation procedures and also reduced the instruments cleaning cycles; additional selectivity was gained for usually coeluted compounds (drugs, pro-drugs, and metabolites); and there was a reduction of sample amount because large volumes could be injected without compromising the chromatographic separation on the analytical column.
Common run times for these methods were between 5 and 10 min. The samples were mainly prepared in 96-deep-well plates and about 100 μL of plasma was used for these assays. The direct injection of blood or plasma was presented by Boos and colleagues (21) in which restricted access material (RAM) size exclusion chromatography with on-line SPE was coupled to LC–MS-MS. Different systems were commercialized (Spark Holland [22] and Cohesive [23]), some with disposable cartridges and some with reusable SPE columns. However, the use of a simple sample preparation approach such as protein precipitation has become standard over the last few years. One reason is the handling of infectious samples, which would potentially contaminate parts of the HPLC equipment. In terms of run times and multitarget analysis, the work of Koal and colleagues (24) was among the first presented that was also implemented in many hospital and clinical laboratories. The simultaneous determination of four immunosuppressants was achieved with two-dimensional HPLC coupled to electrospray ionization and triple-quadrupole mass spectrometers. As a trapping column (on-line enrichment) a perfusion column was used and then the four compounds separated on a reversed-phase column. These four immunosuppressants were quantified within 2.5 min and the assay was able to process a few thousand samples without user intervention.
In summary, all of these listed methodologies have one thing in common: They are using two or multidimensional LC to achieve extra separation, reduce signal suppression or enhancement during the ionization process, enrich the processed sample solution to increase sensitivity, enhance selectivity, or different combinations of these processes.
In this study the main goals were to push the current limitations on both sides, HPLC and MS, achieve high throughput for a multicomponent quantification assay with a possible automated sample preparation, and still keep all the benefits of multidimensional chromatography. One key factor in forensic and clinical toxicology is certainly satisfactory selectivity for every routine assay to reduce or even eliminate false positive or false negative results.
Experimental
Reagents
All compounds and their isotopic labeled analogues were purchased from Cerilliant and were further used as stock solutions. For the active compounds two different lots were used, one for the calibration samples and one for the quality control samples. The compounds were separated into two groups according to the expected final concentrations. Group I consisted of 7-NH2-flunitrazepam, alprazolam, clonazepam, flunitrazepam, flurazepam, lormetazepam, nor-flunitrazepam, temazepam, triazolam, zolpidem, zopiclone, and zaleplone. Group II consisted of bromazepam, desalkylflurazepam, diazepam, lorazepam, midazolam, nordiazepam, nitrazepam, clobazam, and oxazepam. Acetonitrile (supra gradient grade) was obtained from Acros, HPLC-grade water was produced by a Milli-Q water system from Millipore, and formic acid (puriss p.a., 98%) was purchased from Fluka Sigma Aldrich. Precision pipettes from Gilson were used for handling all of the solutions and samples. Protein precipitation was carried out in 96-deep-well plates that were sealed with silicone mats (plates and mats were obtained from Axygen).
Instrumentation
A triple-stage mass spectrometer with linear ion trap capability (3200 QTrap, AB Sciex) with Analyst version 1.5.1 software was used in selective reaction monitoring (SRM) scan mode for the mass spectrometric detection. Electrospray ionization was performed in positive ion mode for all analytes, and the following instrument parameters for the ionization were used: ion source voltage, 5000 V; curtain gas, 20; gas 1, 40; gas 2, 40 (arbitrary units for the gas settings); and source temperature, 650 °C. All compounds were tuned manually by infusion via syringe pump and the most abundant fragment ions were selected as possible quantifiers and qualifiers. The selection of fragment ions that are optimal for the method was tested later on by injection of pooled blank human urine and injection of spiked urine, where the lowest interference and highest intensity were used as criteria. The final parameters for the quantifiers are listed in Table I (the parameters for the qualifiers are not shown, the parameters for the internal standards are identical to the main compounds). The internal standards were also tuned manually to identify possible fragment ions. Dwell times were adjusted as follows: 8 ms for the main compounds (quantifier ion), 4 ms for the internal standards and the qualifier ion, and 2 ms pause time between the SRM transitions. Isotopic labeled compounds were used as internal standards if available. If no labeled internal standard was available another isotopic labeled compound next to the compounds retention time was chosen. The sum of all dwell times and pause times resulted in a total cycle time of 420 ms (57 SRM transitions were measured). The HPLC equipment consisted of two HPG-3200A binary HPLC pumps, an ISO-3000-SD isocratic pump, a TC-3100 heated column compartment with a built-in six-port switching valve, and a WPS-3200 TSL well-plate autosampler (Dionex). For the trapping column a 10 mm × 2.0 mm, 4-μm dpPhenomenex Polar RP column was used and for the analytical column a 30 mm × 2.0 mm, 2.6-μm dp Phenomenex Kinetex PFP core–shell column was used.
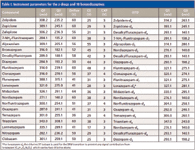
Table I: Instrument parameters for the z-drugs and 18 benzodiazepines
Sample Preparation
Working solutions for the calibration and the quality control samples were prepared in acetonitrile from diluted stock solutions. A dilution solution V0 was prepared in which the group I compounds were concentrated at 10 μg/mL and group II compounds at 100 μg/mL. For the group I compounds, working solutions at 6.25, 2.5, 1.25, 0.625, 0.25, 0.125, and 0.0625 μg/mL were prepared, and for the group II compounds working solutions at 62.5, 25, 12.5, 6.25, 2.50, 1.25, and 0.625 μg/mL were prepared (Table II). Blank human urine was obtained from staff and tested before its use. Calibration samples were prepared freshly for each run by spiking 490 μL of urine with 10 μL of working solution. Then 200 μL of these solutions was used for sample preparation (200 μL for the first calibration curve and 200 μL for the second calibration curve). The resulting sample concentrations were 125, 50, 25, 12.5, 5.0, 2.5, and 1.25 ng/mL for the group I compounds and 1250, 500, 250, 125, 50, 25, and 12.5 for the group II compounds. For the quality control samples concentrations of 1.25 ng/mL (12.5 for group II), 3.75 ng/mL (37.5 for group II), 30.0 ng/mL (300 for group II), and 90.0 ng/mL (900 for group II) were used. Next, 300 μL of internal standard solution was added to 100 μL of urine sample (pure acetonitrile containing the internal standards at a concentration of 10 ng/mL for the group I and 100 ng/mL for the group II compounds) to dilute the samples and possibly precipitate any existing proteins. The samples were prepared in well plates, and after adding the internal standard solution, the plates were vortexed for 10 min and then centrifuged for 35 min at 3500 relative centrifugal force units and at about 8 °C.

Table II: Working solutions for preparing the calibration samples
Column Switching, Dilution of Prepared Samples, and Gradient Programs
The gradient elution was performed with 0.1% formic acid in water as the aqueous phase and 0.1% formic acid in acetonitrile as the organic phase. The injection volume was 25 μL. During the loading onto the trapping column the HPLC flow from gradient pump 3 was diluted with water (containing 0.1% formic acid, isocratic pump 3) via a T-union to retain all selected compounds on the trapping column (Figure 1, valve position A). The starting conditions — amount of diluting flow and percentage organic phase of the gradient pump 2 and isocratic pump 3 — were optimized experimentally. At the end it was essential to have conditions that allowed for the increase of the injected volume without losing peak shape on the chromatograms and to gain sensitivity when the injected volume was increased. After 0.5 min the valve was switched and the trapping column was connected with HPLC pump 1 and the analytical column in backflush direction (Figure 1, valve position B). Starting conditions of the HPLC pump 1 for running the gradient through the trapping and analytical column were optimized to the highest sensitivity of all the compounds. This was experimentally optimized as well. After evaluating flow and composition parameters for each pump the resulting pump gradient program was found to be optimal (Table III). Potential dead volume between the autosampler and the ionization source was estimated at about 120 μL because all connecting tubing (75-μm i.d. PEEK tubing) was kept as short as possible. It is also estimated that all compounds would be retained at the entry of the trapping column and therefore the trapping column would not contribute to the dead volume.

Table III: Pump gradient program and switching position
Results and Discussion
According to the Food and Drug Administration (FDA) guidelines and our requirements, a validation procedure was planned and carried out to establish the method's linear range, accuracy, imprecision, selectivity, specificity, dilution ability, recoveries, reinjection stability, carryover, matrix effect for urine samples, and robustness. Freeze–thaw cycles were not explicitly verified, because our routine samples are immediately analyzed upon arriving and from previous validation it is known that all samples are stable for at least three freeze–thaw cycles. Calibration was performed with first order (y = ax + b) with 1/x weighting factor and all chromatograms were processed with one smooth cycle.
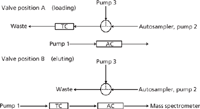
Figure 1: Valve position A and valve position B with corresponding flow directions.
All analyzed compounds could be trapped during the first 0.5 min on the trapping column and then pumped and eluted via backflush through the analytical column. The measured drugs showed retention times between 0.85 min (7-NH2-flunitrazepam) and 1.22 min (flurazepam). A typical chromatogram of a calibration sample (containing all compounds and all internal standards) is shown in Figure 2. The trapping conditions were also verified by increasing the injected volume and resulted in good linearity between 10 μL and 80 μL; for example, by injecting 50 μL instead of 25 μL the signal intensity increased by a factor of two, which confirmed the appropriate conditions for retaining all compounds on the trapping column during the loading step.
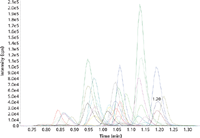
Figure 2: Typical chromatogram for all 57 SRM traces.
The number of data points for each SRM transition was between seven and eight, which can still be considered acceptable. If more compounds were added to the method all dwell times would require appropriate adjustment. Fixed dwell times (compared to scheduled dwell times) were chosen because all of the compounds were eluted in a very short time window and therefore, the number of data points is almost identical for all compounds.
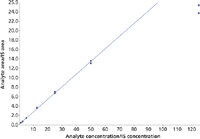
Figure 3: Typical calibration curve for zolpidem.
For 7-NH2-flunitrazepam, alprazolam, clonazepam, flunitrazepam, flurazepam, lormetazepam, nor-flunitrazepam, temazepam, triazolam, zopiclone, and zaleplone (group I) a linear range from 1.25 ng/mL to 125 ng/mL was obtained. For zolpidem a linear range from 1.25 ng/mL to 100 ng/mL was established, because the highest calibrator (125 ng/mL) was within saturation (Figure 3). Therefore, samples containing zolpidem above concentrations of 100 ng/mL needed to be reanalyzed after dilution with blank human urine. For bromazepam, desalkylflurazepam, diazepam, lorazepam, midazolam, nordiazepam, nitrazepam, clobazam, and oxazepam (group II) a linear range from 12.5 ng/mL to 1250 ng/mL was found to be valid. Correlation coefficients (r) were always better than 0.99. A typical calibration curve for midazolam is shown in Figure 4.
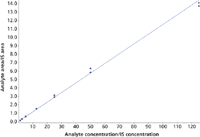
Figure 4: Typical calibration curve for midazolam.
Accuracy and imprecision of the method was verified by three different sequences prepared on three different runs with six replicates of the quality control samples. Interassay accuracy and interassay imprecision fulfilled the criteria of 85–115% (80–120% at the lower limit of quantification [LLOQ] level) and 15% CV (20% CV at the LLOQ level). Typical chromatograms for zolpidem and midazolam at the LLOQ level are shown in Figures 5 and 6.
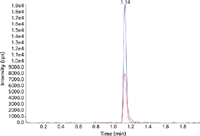
Figure 5: Typical chromatogram of the lowest calibrator of zolpidem (quantifier and qualifier).
For the selectivity, a standard test procedure with blank urine from six different subjects was analyzed. In addition, the selectivity was verified with more than 100 patient samples, in which the patients were hospitalized and the complete treatment was documented and did not contain any of the tested drugs. For all selected compounds, the signal intensity was less than 20% compared to the corresponding LLOQ signal intensity. Therefore, the selectivity of the method was considered to be sufficient.
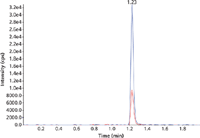
Figure 6: Typical chromatogram of the lowest calibrator of midazolam (quantifier and qualifier).
Specificity was verified at the LLOQ level by measuring six replicates with blank urine from six subjects. All compounds fulfilled the criteria (intra-assay accuracy of 80–120% and intra-assay imprecision better than 20% CV).
For samples above the calibration range the dilution ability was tested with six urine samples spiked with the diluted stock solution V0 followed by a 10-fold dilution with blank urine. The obtained results showed a maximum deviation of 12.6% compared to their nominal value of 200 ng/mL (for group I) and 2000 ng/mL (for group II).
Recoveries were measured in spiked urine samples against processed blank samples that were spiked after the dilution with acetonitrile. Recoveries were found in the range of 50% for oxazepam (lowest recovery) and 90% for diazepam (highest recovery). Because the overall sensitivity was sufficient no further efforts were made to improve recoveries.
Carryover was tested by injection three times the highest calibration sample followed by three different blank samples. The highest carryover signal was detected for alprazolam (5.2% compared to the LLOQ). All other compounds showed lower carryover signals.
Matrix effects were tested by syringe infusion with a solution containing all compounds. The solution was infused via T-union to the HPLC flow after the analytical column. Several different blank urine samples were analyzed and no significant changes of the ion intensities were observed for the analyzed compounds.
Robustness was verified by varying the injection volume from 10 μL to 50 μL and by varying the starting conditions of pump 1 and pump 2 (30–40% B for pump 1 and 45–55% B for pump 2). No significant changes in ion intensities or retention times were observed for any of the compounds.
For the three z-drugs and the 18 selected benzodiazepines, a screening method for human urine was developed and validated according to our requirements for a urine screening method. With a run time of 2.5 min per injection a complete 96-well plate was analyzed within 4 h. The layout of the well plate incorporated 74 case samples, two calibration curves (one at the beginning and one at the end), six quality control samples, and one blank sample and one blank sample with internal standards. Based on this plate layout, about 444 case samples can be analyzed within 24 h.
The goal of this study was also to develop a general sample preparation for different matrices since, in some of our cases, urine was not available. The screening needs then to be carried out in whole blood or plasma. With this is in mind, our sample preparation for urine was planned from the beginning and established in this way. Protein precipitation with acetonitrile at a ratio of 1:3 (100 μL of sample and 300 μL of acetonitrile) is widely used for blood and plasma. Up to date, a partial validation for whole blood and plasma (precision, accuracy, and selectivity) was carried out to prove the concept of general sample preparation. So far the acquired data support our approach, in which one method can be used for different matrices.
In the last few months, several hundred samples (mostly urine samples) either from traffic controls or traffic accidents were analyzed to detect the presence of tranquilizers or hypnotics. Among the cases tested positive for tranquilizers or hypnotics, there were about 9% where the driver has either taken zolpidem or zopiclone before driving a vehicle (zaleplone has never been detected so far). Even though these z-drugs have substantial shorter half-life times and therefore cause fewer problems if taken according to the prescription, a fast and routine screening is essential in forensic toxicology and would be beneficial in clinical chemistry where no immunoassay is available.
Conclusion
LC–MS-MS in combination with on-line SPE (column switching with a trapping column and an analytical column) allows for a comprehensive and selective drug screening and concentrations can be quantified with high accuracy. Even if the run times are pushed to current instrument limitations the assays remain valid and turn out to be competitive to existing immunoassay screening. In addition, drugs that are not detected with our current CEDIA methods can be detected and quantified. This applies to human urine samples for which a validation was successfully carried out, and in the future the validation will be extended to whole blood and plasma by using the same LC–MS-MS conditions and sample preparation methods.
The combined selectivity of two different stationary phases, one from the trapping and one from the analytical column, and the selectivity of the SRM scan provide enough assay selectivity to reduce false positive results, even at short run times. On-going research also aims to incorporate more compounds, incorporate important metabolites of the selected hypnotics and tranquilizers, and extend the current screening method for additional licit drugs and illicit drugs. Subsequent use of the latest generation of mass spectrometers will allow users to shorten dwell times and therefore increase the number of compounds without compromising the chromatographic quality of the analytical data.
Acknowledgments
We gratefully acknowledge Patricia Coro, Sidonia Guggisberg, Anita Iannone, Anja Kaiser, and Severine Krönert for performing the samples analysis for the forensic cases.
References
(1) D. Henderson, S. Friedman, J. Harris, W. Manning, and M. Zoccoli, Clin. Chem. 32(9), 1637–1641 (1986).
(2) http://www.thermoscientific.com.
(3) A.H. Wu, E. Forte, G. Casella, K. Sun, G. Hemphill, R. Foery, and H. Schanzenbach, J. Forensic Sci. 40(4), 614–618 (1995).
(4) K. Huynh, G. Wang, C. Moore, R. Barhate, C. Coulter, W. Rodrigues, P. Catbagan, and J. Soares, J. Anal. Toxicol. 33(8), 486–490 (2009).
(6) A. Salomone, E. Gerace, P. Brizio, M. Gennaro, and M. Vincenti, J. Pharm. Biomed. Anal. 56(3), 582–591 (2011).
(7) C. Kratzsch, O. Tenberken, F. Peters, A. Weber, T. Krämer, and H. Maurer, J. Mass Spectrom. 39, 856–872 (2004).
(8) J. Feng, L. Wang, I. Dai, T. Harmon, and J. Bernert, J. Anal. Toxicol. 31(7), 359–368 (2007).
(9) M. Bjork, M. Nielsen, L. Markussen, H. Klinke, and K. Linnet, Anal. Bioanal. Chem. 396(7), 2393–2401 (2010).
(10) H. Nordgren, P. Holmgren, P. Liljeberg, N. Eriksson, and O. Beck, J. Anal. Toxicol. 29(4), 234–239 (2005).
(11) S. Karampela, I. Vardakou, I. Papoutsis, A. Dona, C. Spiliopoulou, S. Athanaselis, and C. Pistos, J. Chromatogr. B 902, 42–46 (2012).
(12) P. Kintz, M. Villain, V. Dumestre-Toulet, and B. Ludes, J. Clin. Forensic Med. 12(1), 36–41 (2005).
(13) P. Kintz, M. Villain, M. Concheiro, and V. Cirimele, Forensic Sci. Int. 150(2–3), 213–220 (2005).
(14) S. König, B. Aebi, S. Lanz, M. Gasser, and W. Weinmann, Anal. Bioanal. Chem. 400(1), 9–16 (2011).
(15) R. Wyss, Methods Enzymol. 189, 146–155 (1990).
(16) R. Wyss and F. Bucheli, J. Chromatogr. 456(1), 33–43 (1988).
(17) A. Cristobal, M. Hennrich, P. Giansanti, S. Goerdayal, A. Heck, and S. Mohammed, Analyst 137(15), 3541–3548 (2012).
(18) M. Zell, C. Husser, and G. Hopfgartner, J. Mass Spectrom. 32(1), 23–32 (1997).
(19) M. Zell, C. Husser, and G. Hopfgartner, Mass Spectrom. 11(10), 1107–1114 (1997).
(20) G. Hopfgartner and E. Bourgogne, Mass Spectrom. Rev. 22(3), 195–214 (2003).
(21) S. Boos and R. Morello, "LC–MS Adequate Clean-up of Biofluids," short course at the LC–MS meeting in Montreux, Switzerland, 2006.
(22) S. Ghassabian, S. Mojtaba Moosavi, Y. Guerra Valero, K. Shekar, J. Fraser, and M. Smith, J. Chromatogr. B 903, 126–133 (2012) (see also http://www.sparkholland.com).
(23) N. Schaefer, B. Peters, P. Schmidt, and A. Ewald, Anal. Bioanal. Chem. 405(1), 247–258 (2013) (see also http://www.cohesivetech.com).
(24) T. Koal, M. Deters, B. Casetta, and V. Kaever, J. Chromatogr. B 805, 215–222 (2004).
Stefan König is a forensic scientist at the Institute of Forensic Medicine at the University of Bern, Switzerland. Thomas Wüthrich is a lab technician at the Institute of Forensic Medicine at the University of Bern and is specialized in LC–MS-MS method development. Werner Bernhard is a forensic toxicologist and chemist at the Institute of Forensic Medicine at the University of Bern. Wolfgang Weinmann is professor in forensic toxicology at the University of Bern.
Direct correspondence to: stefan.koenig@irm.unibe.ch
Characterizing Plant Polysaccharides Using Size-Exclusion Chromatography
April 4th 2025With green chemistry becoming more standardized, Leena Pitkänen of Aalto University analyzed how useful size-exclusion chromatography (SEC) and asymmetric flow field-flow fractionation (AF4) could be in characterizing plant polysaccharides.
Investigating the Protective Effects of Frankincense Oil on Wound Healing with GC–MS
April 2nd 2025Frankincense essential oil is known for its anti-inflammatory, antioxidant, and therapeutic properties. A recent study investigated the protective effects of the oil in an excision wound model in rats, focusing on oxidative stress reduction, inflammatory cytokine modulation, and caspase-3 regulation; chemical composition of the oil was analyzed using gas chromatography–mass spectrometry (GC–MS).


