Quantitation and Nontargeted Identification of Pesticides in Spinach Extract with GC×GC–TOF-MS
Special Issues
In this study of pesticides in spinach extract, the use of GC×GC–TOF-MS is demonstrated as a methodology to overcome matrix interferences and quickly quantify suspected contaminants. The approach also allows nontargeted analysis using a single sample injection.
Accurate detection, identification, and quantitation of compounds in high matrix food extracts often proves challenging, even to experienced analysts. This work becomes more challenging as regulatory agencies drive limits of detection (LODs) lower, while simultaneously increasing the number and types of compounds that must be targeted. Selected ion monitoring and tandem mass spectrometry (MS/MS) techniques can help mitigate matrix interferences, but they may not be selective enough for all compounds in the most challenging matrices. Furthermore, these types of targeted analysis techniques remove the possibility for retrospective nontargeted analysis of the data, preventing analysts from detecting new or emerging contaminants. In contrast, comprehensive two-dimensional gas chromatography (GC×GC) dramatically improves chromatographic resolution of analytes within a sample, often completely separating target compounds from would-be matrix interferences. Additionally, new time-of-flight mass spectrometers (TOF-MS) allow for full scan collection at selected ion monitoring (SIM)-level sensitivities, obviating the need for quadrupole–based systems. In this article, we demonstrate the use of GC×GC–TOF-MS as a methodology to combat matrix interferences, and quickly target and quantify suspected contaminants, while still allowing nontargeted analyte detection in a single sample injection.
The "quick, easy, cheap, effective, rugged, and safe" (QuEChERS) technique has become the predominant method to extract pesticides from a variety of food products (1). Since its introduction, many improvements have been made to the extraction chemistries, not only to improve pesticide recoveries, but also to decrease the amount of coextracted commodity matrix. Even so, particularly problematic matrices still exist. In the case of samples that contain high levels of fat (fish, avocados, and nuts) or pigmentation (spinach and blueberries), large amounts of unwanted matrix still pass into the final extract. These coextracted compounds often negatively affect pesticide detection and quantitation, challenging the efforts of analysts worldwide, especially as limits of detection (LODs) are decreased by numerous regulatory entities.
In most analyses, a mass spectrometer is coupled to a single dimension of chromatographic separation. In the case of high matrix commodities, the likelihood of coextracted interferences is high, and the system becomes dependent on complex mass transitions, their corresponding retention windows, and peak picking routines (deconvolution, if available) to do the heavy lifting of fully resolving and identifying the target analytes from the ubiquitous background signals. Furthermore, these selective sample data are collected in limited mass windows, and known to be completely ill-suited for nontargeted interrogation. To examine the samples for new or emerging contaminants, samples must be retained for future analyses on an independent analysis system capable of nontargeted work.
Alternatively, one could utilize the additional separation efficiency delivered by two-dimensional gas chromatography (GC×GC) to better chromatographically separate target analytes from matrix interferences and a mass spectrometer (such as time-of-flight [TOF]-MS) capable of collecting full scan data. These separations, combined with the full scan data at the sensitivity available with modern TOF-MS systems (low femtograms on column), allow for successful quantitation of target compounds, plus accurate identification of nontargeted analytes in a single injection.
In this article, we demonstrate improvement in experimental metrics (identification, limit of detection [LOD], and linearity) when performing both quantitative and nontargeted analysis with GC×GC–TOF-MS on spiked extracts from spinach, which is known to be a challenging food matrix.
Experimental Design
Bagged spinach was purchased from a local grocery chain. Using a commercially available QuEChERS extraction kit (Restek PNs 25852 and 26225), a bulk QuEChERS extract was created, and subsequent dSPE cleanup of the spinach was performed. Following the kit instructions (1), 15 g of leaf spinach was homogenized, and combined with 15 mL of 1% acetic acid in acetonitrile in a 50 mL conical tipped tube. The contents of the prepared salt packet (6 g anhydrous MgSO4 and 1.5 g anhydrous Na2SO4) were added, the tube immediately capped and then shaken, by hand, for 1 min. After shaking, the mixture was centrifuged for 5 min at 3500 RPM, separating the organic layer from the spinach solids, water, and unbound salts mixture. Post centrifugation, 6 mL of the organic layer was added to a dSPE tube containing 900 mg MgSO4, 15 mg primary and secondary amine (PSA), and 45 mg graphitized carbon black (GCB). This second clean-up step is responsible for the primary removal of pigments (GCB), sugars, organic and fatty acids (PSA), and any remaining water (MgSO4/H2O), though attention must be paid not to overemploy these compounds, as they may also bind pesticides and lower recovery efficiencies. The dSPE tube was immediately capped, shaken for 2 min, and then centrifuged for 5 min at 3500 rpm. The supernatant was removed from the dSPE material by pipette, and stored in a clean, conical tipped tube. Extracts from duplicate, concurrent preparations were pooled, and centrifuged a final time. This final step is not specifically called for in the kit instructions, though we have found it useful, because it helps ensure that any accidentally pipetted dSPE material is removed from the final extract.
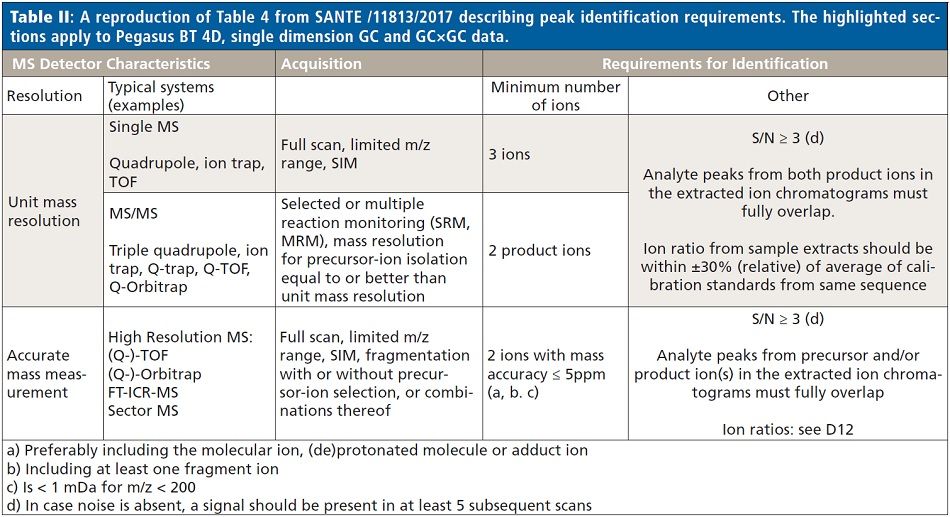
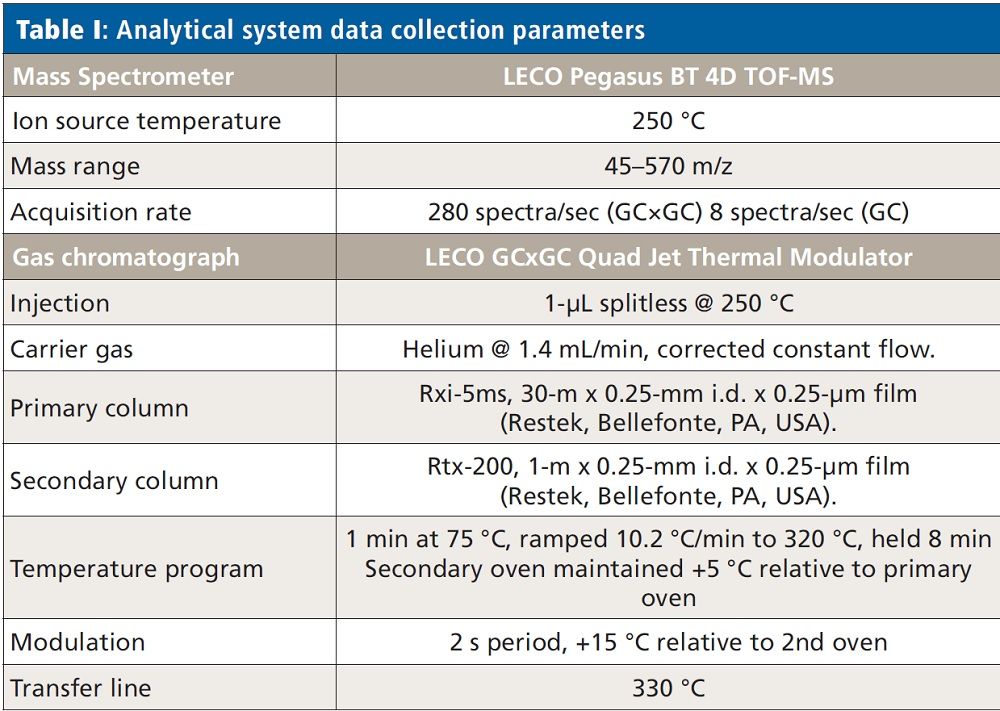
From the pooled extract, a small aliquot was set aside, and the remainder used to create a series of nine matrix-matched quantitation standards, spiked at concentrations from 0.05 to 200 ng/g with a commercially available chlorinated pesticide mix (Restek PN 32564). Dilutions of the stock standard were made so the ratio of spiking standard (20 µL) to matrix extract (180 µL) was consistent in all the experimental standards. The chlorinated mix was chosen because it is less likely that any of the pesticides in this mix would already be present in the spinach, and thus bias the quantitation results. Data from both the matrix-matched standards and unspiked extract were collected in both traditional, single dimension GC as well as GC×GC modes, using conditions described in Table I. Target peak detection, identification, and quantitation limits for each analyte were determined following the criteria for unit mass resolution TOF-MS systems as described in SANTE/11813/2017 (2). Table II shows a reproduction of Table 4 from SANTE/11813/2017, where these criteria are summarized. Following data collection, files were analyzed with ChromaTOF BT software, using both Target Analyte Find (TAF) for quantitative purposes and NonTarget Deconvolution (NTD) for qualitative investigation for incurred contaminants.
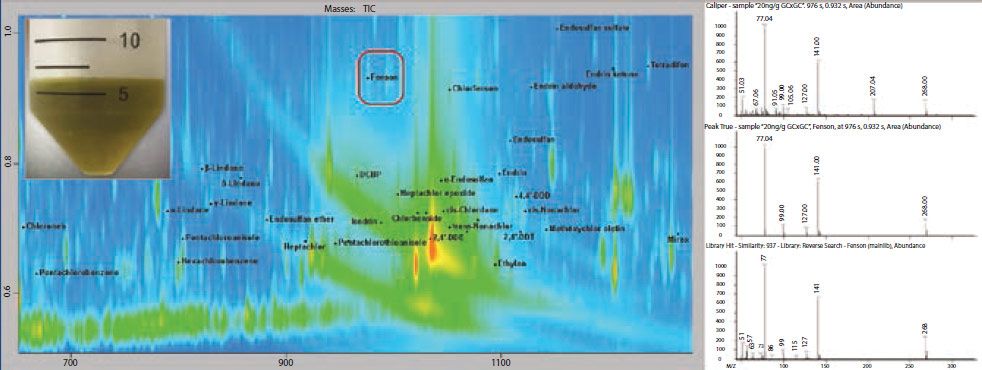
Figure 1: Section of contour plot for the spinach QuEChERS extract with dSPE cleanup (inset upper left), spiked with pesticides at 20 ng/g. In this example, the second dimension of separation effectively moved Fenson and other pesticides away from high concentration matrix interferences. The chromatographic separation of GC×GC significantly improves both analyte detection and quantitation.
Results and Discussion
Quantitation and GCX GC Improvements
Figure 1 shows an example of data collected using a GC×GC–TOF-MS system. In this plot, areas of increased signal are shown with increasing color intensity (red being the highest), and the location of individual pesticides are indicated with labels and peak markers (black dots). In this sample, it is demonstrated that many of the pesticides are chromatographically resolved from the much more abundant matrix background. Additionally, fenson is highlighted with a red box as an example, since it was effectively separated from a very large area of matrix.
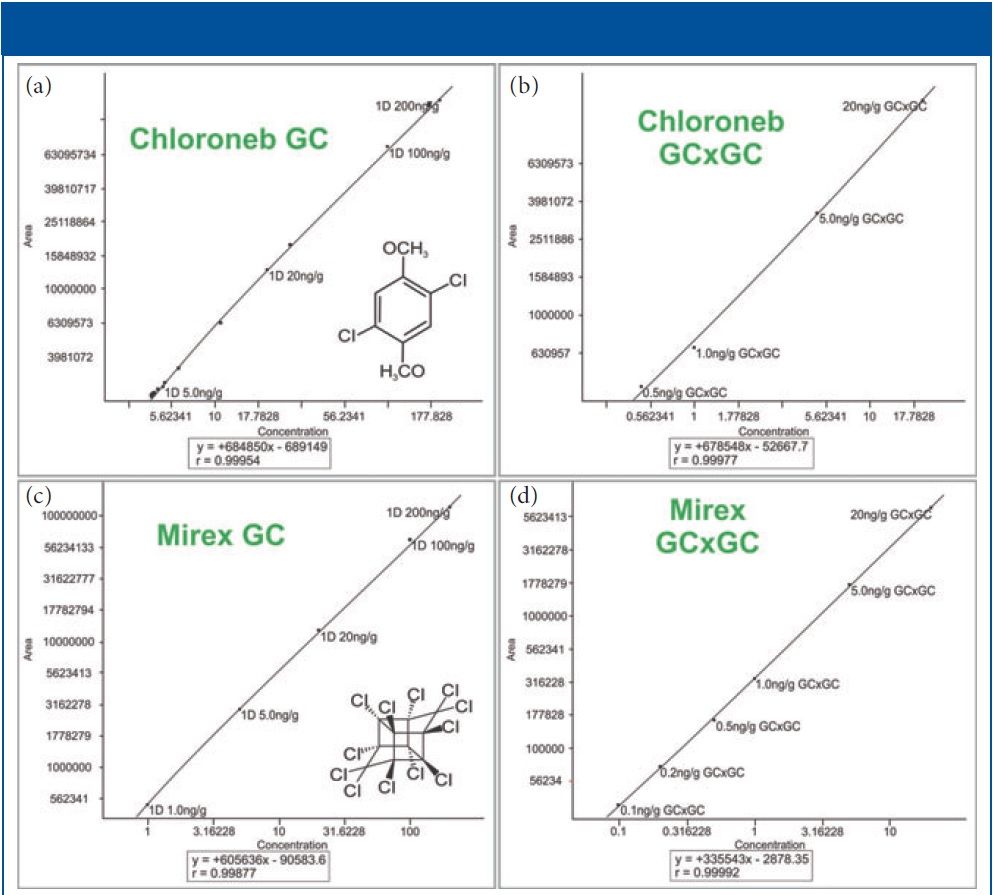
Figure 2: Example GC and GC×GC quantitation curves. The axes are scaled logarithmically for better visualization of the low concentration section of each curve. Shown in the figure are: (a) chloroneb by GC, (b) chloroneb by GC×GC, (c) mirex by GC, and (d) mirex by GC×GC.
With LC–MS experiments, it is well known that high levels of matrix tend to suppress target compound ionization (3), leading to various challenges. In GC–MS experiments, the matrix poses its own set of hurdles, as the matrix tends to interfere by adding spurious signals, sometimes referred to paradoxically as signal enhancement. Far from improving the target signal, matrix noise may skew the lower ends of quantitation curves, or unequally affect ion ratio masses. If, by chromatography, one can separate these targeted compounds from the matrix, interference effects are properly mitigated before detection by the mass spectrometer. As a result, effects on targeted signals are decreased, leading to improvements in LODs and quantitation linearity. As one will see, these improvements are entirely due to both the effect of the thermal modulation process, and secondary chromatographic separation when performing GC×GC.
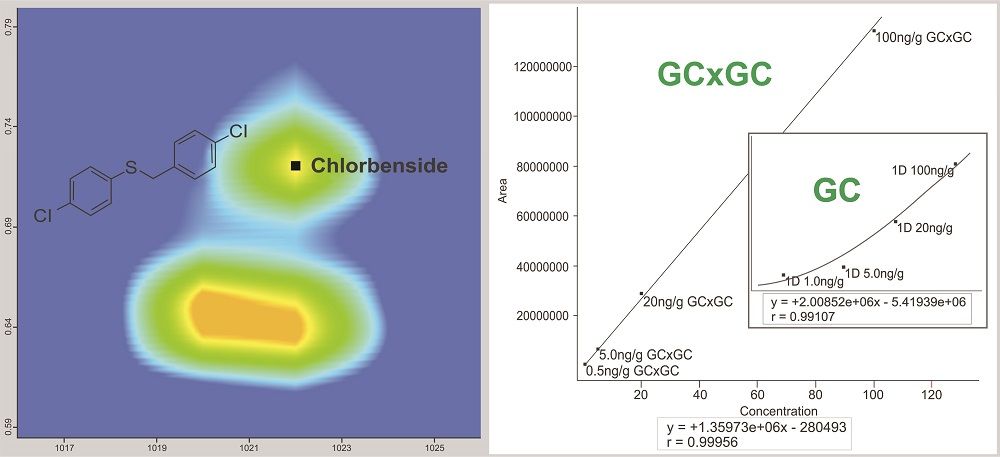
Figure 3: GC×GC resolution of chlorbenside from the matrix interference. The GC×GC separation allows for a linear and sensitive quantitation curve. In the traditional, single-dimension GC separation the coeluting matrix completely obscures the pesticide below 20 ng/g making consistent, accurate integration impossible.
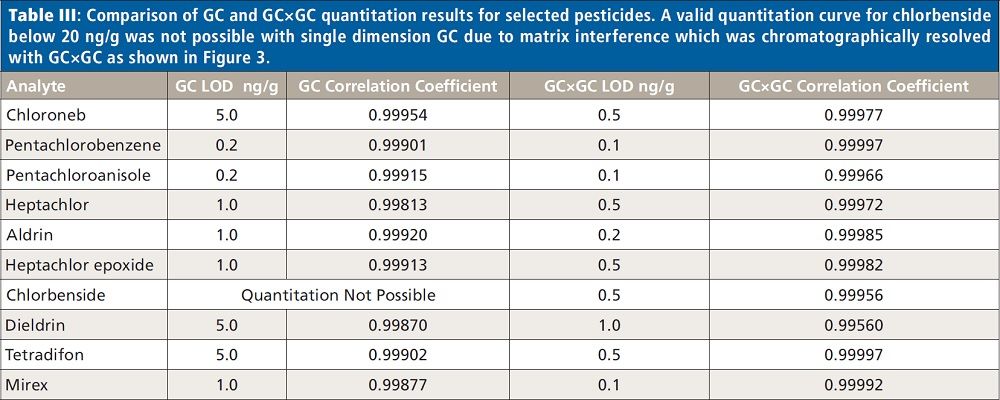
Figures 2 and 3 show examples of calibration curves comparing GC to GC×GC data for the compounds chloroneb, mirex, and chlorbenside. When examining the curves in Figure 2, one can see a significant decrease in LOD (factor of 10x) by using GC×GC with nearly equivalent linearity. Also worth noting is the range of the calibration curves. The entire dynamic range has shifted to lower concentrations. The improvements in the calibration curves and LODs for these analytes are due to both the increased selectivity from enhanced chromatographic resolution, and the improved sensitivity afforded by cryogenic zone compression in GC×GC. In the left side of Figure 3, chlorbenside has very significant matrix coelution in the first dimension (x axis). The calibration curve is improved dramatically by the chromatographic separation of compounds (specifically the second dimension retention time) versus separation by mass only with one-dimensional GC systems. For GC×GC–TOF-MS systems, it is the separation of mass combined with the separation of time (chromatographic) that leads to these advantages. The advantages of the technique become very distinct, as shown in the right side of Figure 3, where the linearity is improved (note the quadratic fit on the simple GC experiment) as well as the limit of detection. Note further that the matrix interference for chlorbenside contains isobaric co-elutions, which would limit quantitation with techniques using GC with quadrupole MS. This trend is further illustrated in Table III, which shows marked improvement in LOD and linearity for GC×GC data compared to the single dimension separation for a variety of spiked pesticides.
Nontargeted Analysis and Identification
In Figure 4, one can observe standard deconvolution results comparing GC and GC×GC data. Mathematical identification of true signal components over noise and GC co-elutions are handled with the NonTarget Deconvolution algorithm provided by ChromaTOF for Pegasus BT. The identification of these known components was performed by comparison of the deconvoluted spectra to the spectra in the NIST GC–MS library (2017). The initial result lead us to several pesticides and an ultraviolet (UV) stabilizer in both the traditional GC and GC×GC data files (Figure 4). However, in the figure, there is no distinct difference between the capabilities of GC and GC×GC in these cases, since the components are well resolved in the primary GC dimension. Perfect co-elutions do frequently exist in nontargeted analysis of complex matrices, and are beyond the capabilities of mathematical deconvolution. These situations benefit greatly from the use of GC×GC.
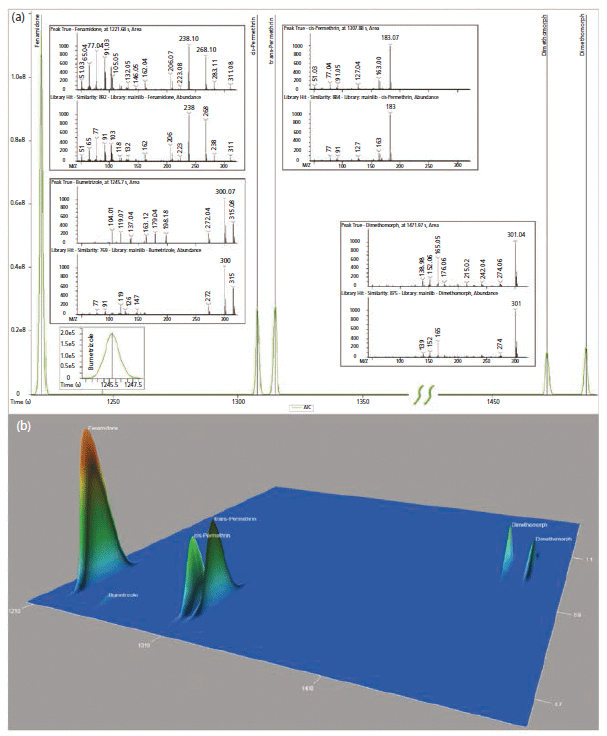
Figure 4: Initially identified incurred pesticides and ultraviolet (UV) stabilizer (Bumetrizole) shown as both (a) traditional GC chromatogram and (b) GC×GC surface plot.
Figures 5 and 6 show an example of the advantages of GC×GC for nontargeted analysis. Review of the GC×GC data lead to the discovery of an unexpected pesticide, chlorantraniliprole, that was not readily apparent in the single dimension GC data. In the GC×GC contour plot (left) of Figure 5, the pesticide is cleanly resolved in the second dimension, whereas perfectly co-eluting with a matrix component in the first dimension. Contrast this result with Figure 6, where the compound was initially missed, due to a nearly perfect coelution with the abundant matrix compound. In Figure 6, the deconvoluted spectrum obtained from GC analysis is actually a combination of chlorantraniliprole and the interfering component resulting in an awful similarity score. The deconvoluted spectra of Figure 5 show the two compounds successfully separated chromatographically, leading to a clean spectrum and a high similarity score for chlorantraniliprole.
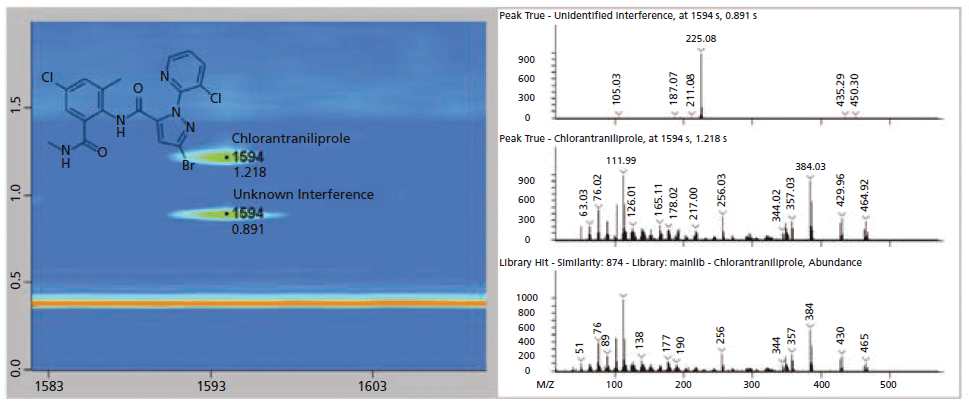
Figure 5: GC×GC contour and spectral plots of chlorantraniliprole and the interfering matrix compound. The two compound signals have been normalized to allow for easier viewing. Note the chromatographic separation from the column bleed (horizontal, orange band) and the improvement in the deconvolution of both compound spectra are compared to the traditional, single dimension GC separation results as shown in Figure 6.
Conclusion
High levels of matrix interference can directly affect the ability to accurately and reliably quantitate low levels of pesticides, and further hamper nontargeted workflows. This study was designed to evaluate and demonstrate the effectiveness of GC×GC separations to mitigate these matrix effects, compared to a traditional, single dimension separation for both targeted, quantitative and nontargeted, qualitative workflows. As shown in these examples, the additional level of chromatographic resolution achievable through GC×GC can indeed reduce matrix interferences, and improve the effectiveness of both types of analyses. By decreasing the level of matrix-induced noise, quantitation becomes both more accurate and more sensitive, leading to dramatic improvements in non-target peak detection, identification, and quantitation.
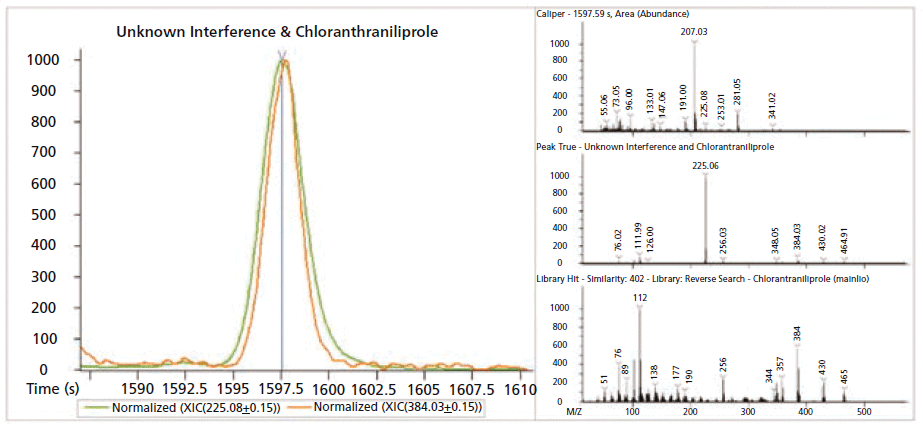
Figure 6: GC extracted ion chromatogram (XIC) and spectra plots of chlorantraniliprole (orange) and matrix (green). The two compound signals have been normalized to allow for easier viewing. The top, raw spectra plot shows the intensity of both compounds relative to the overriding column bleed signal. The GC-MS library spectrum for chlorantraniliprole (bottom) is shown for reference. In the middle deconvoluted spectra you can see the most prevalent ions from chlorantraniliprole al though, they are obviously dwarfed by ions from the coeluting matrix compound.
References
(1) M. Anastassiades, S.J. Lehotay, D. Stajnbaher, and F.J. Schenck, J. AOAC International 86, 412 (2003).
(2) European Commission: Directorate General For Health And Food Safety. SANTE/22813/2017, Guidance document on analytical quality control and method validation procedures for pesticide residues and analysis in food and feed. URL: https://ec.europa.eu/food/sites/food/files/plant/docs/pesticides_mrl_guidelines_wrkdoc_2017-11813.pdf.
(3) T.M. Annesley, Clin. Chem. 49(7) 1041–1044 (2003). DOI: 10.1373/49.7.1041
Todd Richards and Joseph Binkley are with LECO Corporation, in Saint Joseph, Michigan. Direct correspondence to: todd_richards@leco.com

Understanding FDA Recommendations for N-Nitrosamine Impurity Levels
April 17th 2025We spoke with Josh Hoerner, general manager of Purisys, which specializes in a small volume custom synthesis and specialized controlled substance manufacturing, to gain his perspective on FDA’s recommendations for acceptable intake limits for N-nitrosamine impurities.


