High-Throughput Structure-Based Profiling and Annotation of Flavonoids
Special Issues
A novel mass spectrometry-based flavonoid profiling workflow is applied to characterize and structurally annotate a large number of unknown flavonoids in fruit juice and vegetable juice samples.
One of the most widely encountered challenges in untargeted metabolomics is how to identify and annotate unknown compounds. Many classes of compounds, such as flavonoids, endocannabinoids, steroids, and phospholipids, are difficult to confidently identify and annotate, due to their structural diversity and the limited availability of reference standards. This study applies a novel mass spectrometry-based flavonoid profiling workflow to characterize and structurally annotate a large number of unknown flavonoids in fruit juice and vegetable juice samples.
Widely found in fruits and vegetables, as well as plant-derived products such as tea, cocoa, and wine, flavonoids are powerful antioxidants with anti-inflammatory and immune system benefits (1). With diverse and important biological roles, flavonoids have been the focus of much research interest.
Untargeted flavonoid profiling using high-resolution mass spectrometry (MS) is one of the most widely used approaches for flavonoid analysis, because the resulting data can provide insight into the biological functions and potential health benefits of these compounds. However, the comprehensive identification of flavonoids remains challenging, due to their structural diversity. Because flavonoids are involved in a broad range of secondary metabolic pathways that involve modifications such as acylation, hydroxylation, methylation, prenylation, and glycosylation, large numbers of isomeric and isobaric structures may exist in the same sample. Indeed, over 10,000 flavonoid structures have been isolated (2).
Despite the vast number of reported flavonoids, the limited availability of authentic flavonoid reference standards, and therefore reference spectra, means that many unknown flavonoid compounds encountered in profiling studies do not have an exact match in MS spectral libraries. This is particularly true for flavonoids with multiple glycoside modifications, which can be very challenging to characterize. Consequently, many flavonoid structural characterization studies published to date have involved the manual assignment of fragment ions generated from tandem mass spectrometry (MS2) and higher order MS data (MSn) (3,4). This painstaking analysis requires in-depth knowledge of flavonoid fragmentation rules, and is both labor- and time-intensive. Moreover, for the majority of flavonoid glycoconjugates, MS2 does not generate sufficient diagnostic fragment ion information to annotate aglycone structures (5), or differentiate between isomers.
Multiple stage mass spectrometry can be used to systematically fragment analytes to generate more structurally relevant fragment ion information. This approach can be used to generate a so-called "spectral tree" to support the annotation of unknown compounds. Here, we report a novel structure-based flavonoid profiling workflow for the detection and identification of unknown flavonoids in fruit and vegetable juices. The method uses comprehensive fragment ion information generated from higher-energy collisional dissociation (HCD) and collisional induced dissociation (CID) Fourier transform (FT) MS2, as well as higher order CID-FT-MSn, for rapid flavonoid annotation. We demonstrate this workflow for the annotation of flavonoid glycoconjugates, although the approach may be applied to other transformation products of secondary metabolism.
Experimental
Sample Preparation
Three commercially available fruit and vegetable juice samples (kale juice; berries juice mixture, consisting of apple, orange, cherry, peach, mango strawberry, and blackberry juices; and a "red" juice mixture, consisting of apple, strawberry, banana, beet, and raspberry juices) were analyzed in this study. Each juice sample was filtered and diluted two-fold with methanol prior to analysis.
UHPLC Conditions
Separations were performed on a Thermo Scientific Vanquish ultrahigh-pressure liquid chromatography (UHPLC) system. The gradient was as follows: 0.5% to 10% B in 1 min, 10 to 30% B in 9 min, 30 to 50% B in 8 min, 50 to 99% B in 4 min, hold at 99% B for 3 min, 99 to 0.5% B in 4.99 min. Mobile phase A was water with 0.1% formic acid, and mobile phase B was methanol with 0.1% formic acid, operating at a flow rate of 200 µL/min. A Thermo Scientific Hypersil Gold (2.1 × 150 mm, 1.9 µm) column, operating at 45 °C, was employed. Each sample (2 µL injection volume) was analyzed in triplicate.
MS Conditions and Spectral Tree Approach
MS data were collected on a Thermo Scientific Orbitrap ID-X Tribrid mass spectrometer using electrospray ionization (ESI). A default acquisition template was used to collect the maximum amount of MSn spectral tree data to enable the structure annotation of unknown flavonoid compounds. A short cycle time of 1.2 s was chosen to permit sufficient MS scan points across each peak for precise quantitation, while delivering high resolution spectral data. Because HCD MS2 provides sufficient fragment ions for structure annotation when the flavonoid compounds do not have glycol modifications, only HCD MS2 data were collected for precursor ions in the mass range 150–420 m/z. For precursor ions in the mass range 420–1200 m/z, glycol modifications were anticipated, and product ion-dependent MSn method was employed. This approach involved a high-resolution accurate mass (HRAM) full MS scan, followed by CID MS2 scans. Product ions generated from each MS2 scan were monitored by the mass spectrometer, and an MS3 scan was triggered if one or more predefined neutral sugar losses were detected. An additional MS4 scan was triggered if predefined neutral sugar losses were detected from the MS3 scan. The product ion dependent method and predefined neutral sugar loss scheme are shown in Figure 1.
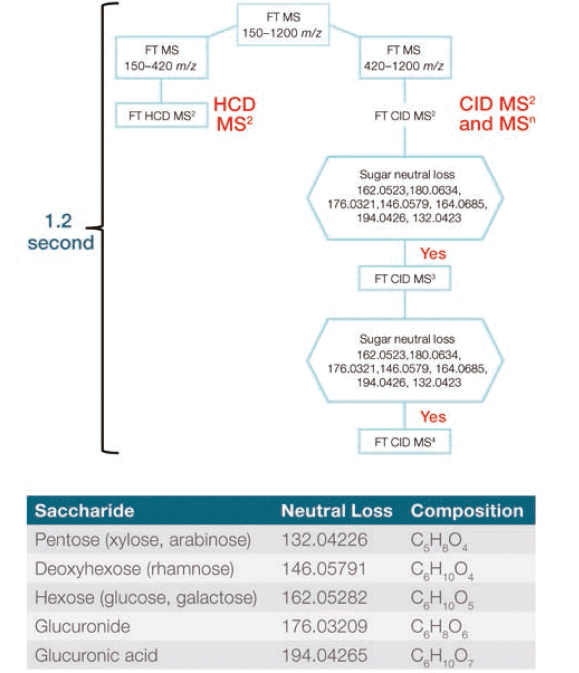
Figure 1: Flowchart visualizing the intelligent, automated product ion-dependent MSn method, and table detailing the targeted sugar neutral loss scheme.
Data Analysis
The collected MSn spectral tree data were initially processed using Thermo Scientific Mass Frontier 8.0 software to determine which compounds included the basic flavonoid structure. Detected flavonoid-related compounds were subsequently annotated using a flavonoid structure database and structural ranking tools within the Thermo Scientific Compound Discoverer 3.0 software.
Results
The MSn approach described in the experimental section was used to systematically fragment flavonoids, generating spectral trees. A representative MS3 spectral tree, generated from an unknown compound detected in the kale juice sample, is shown in Figure 2. The MS2 spectrum for the precursor ion at m/z 641.1720 did not return an exact match against the cloud-based mass spectral database (mzCloud) spectral library (Figure 2a). However, fragmenting the MS2 product ion present at m/z 317.0657 resulted in the detection of more structurally relevant fragment ions, which matched with the reference flavonoid isohamnetin (Figure 2b). Thanks to this confident substructure match using MS3 spectral data, we established that part of the structure of the unknown compound had the same structure as the reference, confirming that this unknown compound belongs to the same flavonoid class.
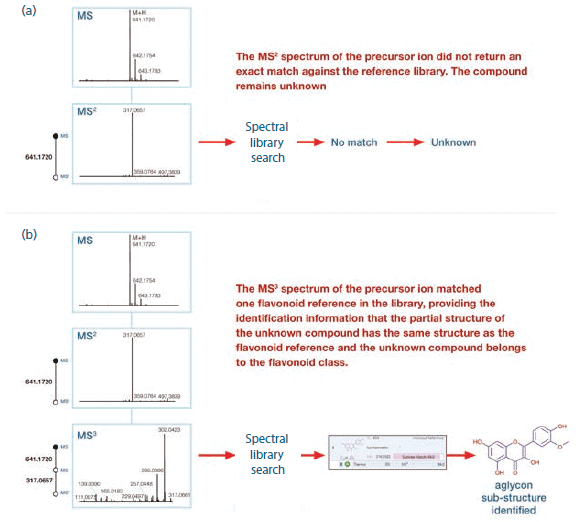
Figure 2: (a) MS2 and (b) MS3 spectral trees for an unknown compound (M + H: 641.1720) detected in the kale juice sample.
The Mass Frontier 8.0 software was used to process the MSn spectral tree data for each juice sample. The software's Joint Components Detection (JCD) algorithm was used to detect unknown compounds from the raw data for each juice, with detected compounds and associated spectral trees then queried against mzCloud's MSn spectral library containing mass spectra generated from authentic reference material. Using the "subtree search" functionality, experimental MSn trees were compared against MSn trees within mzCloud.
For each unknown compound, the greatest overlap between the spectral tree and the library was identified when performing a subtree search. Exact compound matches were made where MSn tree matches were found, whereas substructure/subtree matches were made when the compound did not exist in the reference library. These outcomes depended on whether there was an exact or partial MSn tree match.
If the MS2 precursors of the unknown compound and library reference matched, and the spectral tree match between the unknown compound and reference yielded a confidence score of greater than 60, full spectral annotation was achieved. Typically, however, the MS2 precursor and MS2 spectra of the unknown compound did not match any library references, due to the limited availability of reference flavonoid standards. The subtree search was able to overcome this challenge by using the substructure information from the partial MSn spectral tree match for true unknown compounds. When a subtree match between an unknown compound and a reference was found, the substructure of the unknown compound was identified to match the reference structure or its substructure. In this way, the software was able to detect true unknown flavonoid compounds using molecular weight, retention time, and substructural data.
The detected compounds that matched both mass lists were selected for further flavonoid structure annotation using the Compound Discoverer 3.0 software. A detected compound with a molecular weight of 742.2320, which matched both mass lists, is shown in Figure 3. Two isomeric flavonoid structures from the Arita Lab 6549 flavonoid structural database, and three isomeric flavonoid structures from the ChemSpider database, were selected as candidate structures for this compound. These five structure candidates were ranked using the Fragment Ion Search (FISh) scoring algorithm; the software first predicted the fragmentation of the five structural candidates based on known fragmentation rules, before calculating the FISh scores through matching predicted fragment ions with observed fragment ions from MSn data. The structure with the highest FISh score was the best proposed match with the observed fragment ions from the MSn data, and was the best structure candidate for the unknown flavonoid class compound. For the flavonoid highlighted in Figure 3, the FISh scoring algorithm annotated the compound as narirutin 4'-glucoside.
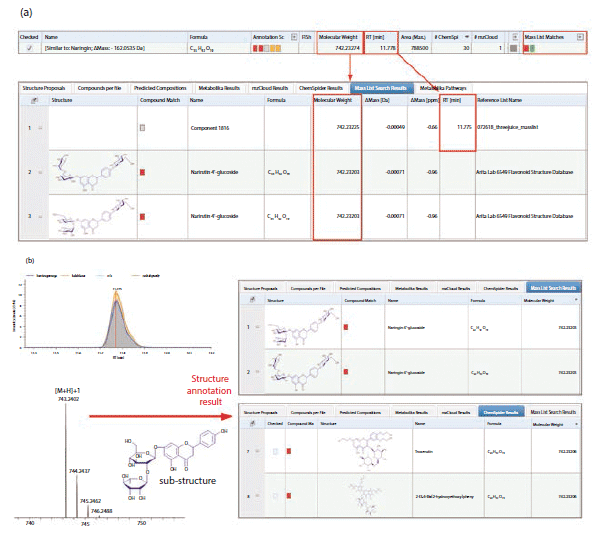
Figure 3: (a) An unknown flavonoid compound (MW = 742.23274) that matched both mass lists; (b) candidate structures proposed using the Arita Lab 6549 flavonoid structure database and the ChemSpider database for the identified compound.
Discussion
Although an MSn spectral tree data has previously been used to generate detailed fragmentation pathways for flavonoid annotation (5), MSn workflows have traditionally been limited by issues around ease of use. Establishing instrument methods has historically been challenging for nonexpert users, a challenge that has been further compounded by the fact that MSn spectral tree data processing has required manual fragment ion assignment. This has proved to be a major process bottleneck, and has required specialist knowledge around flavonoid chemical structure and fragmentation rules.
The structure-specific MSn instrument template used in this study enabled the acquisition of high-quality MSn data without the need for any specialist expertise. Furthermore, the analysis tools applied in this workflow, including the subtree search function in the Mass Frontier 8.0 software and the FISh scoring algorithm in the Compound Discoverer 3.0 software, allow fragment ion information from the MSn spectral tree to be processed automatically, without the need for knowledge of specific fragmentation rules.
The new workflow presented here makes full use of the deeper and more structurally relevant fragment ion information generated through MSn analysis, enabling more flavonoid compounds to be annotated relative to an MS2-only approach. The partial MSn spectral tree match results provided valuable substructural information for true unknown compounds; with subtree search, the software identified unknown compounds belonging to the flavonoid compound class that did not have exact references in the mzCloud library, but partial matches of the extensive high resolution fragmentation information within mzCloud.
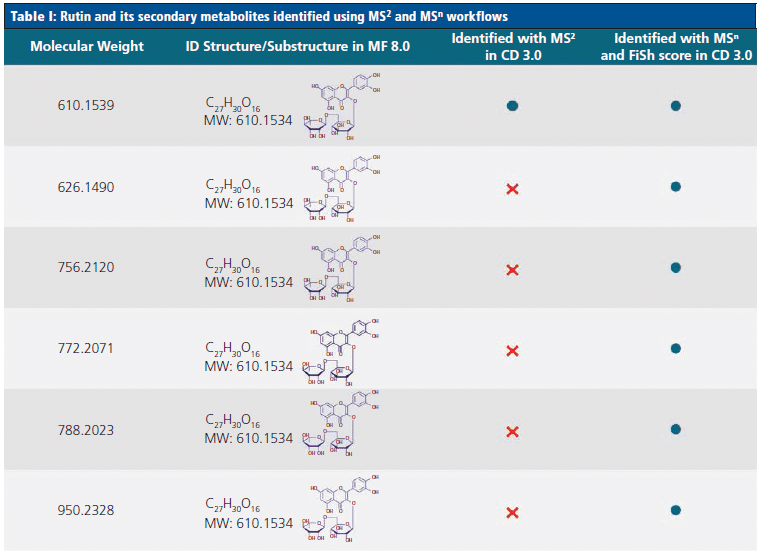
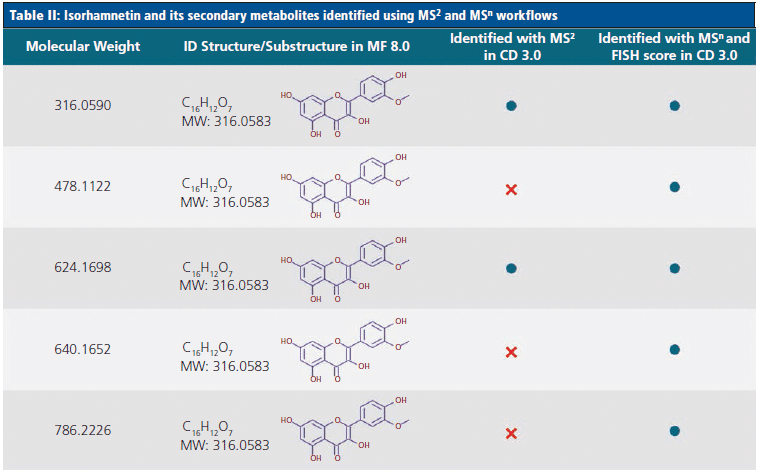
Tables I and II highlight some of the flavonoids identified by the novel MSn workflow, and compare these to the compounds identified using an MS2-only approach. Table I demonstrates that, although both methods identified the flavonoid rutin in the juice samples, the MSn method was able to identify five additional unknown secondary metabolites of this compound. Similarly, Table II shows that an additional three secondary metabolites of the flavonoid isorhamnetin could be identified using the MSn spectral tree data.
In total, the MSn spectral tree workflow was able to identify a total of 129 flavonoid compounds in the three fruit and vegetable juice samples analyzed in this study. All 62 flavonoid structures identified by the MS2-only approach were found using the MSn spectral tree workflow, together with an additional 67 flavonoids that were only detected using the new technique (Figure 4). This represents a twofold increase in the number of annotations relative to the MS2-only approach.
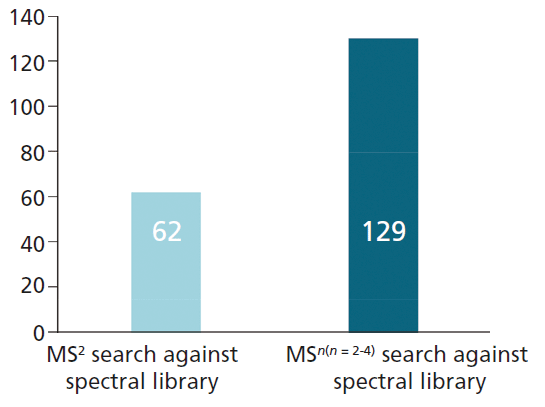
Figure 4: Number of annotated flavonoid compounds detected by MS2-only and MSn workflow.
The structure-based MSn approach presented here also enables simultaneous quantitation of identified flavonoid compounds and statistical analysis. The instrument template was deliberately designed with a short cycle time of 1.2 s to achieve sufficient scan points across the chromatographic peak. This strategy enabled both precise quantitation, while facilitating the acquisition of detailed MSn spectral tree data in the same LC–MS run.
By obtaining wider annotation coverage of flavonoid compounds using this approach, a greater number of data points could be obtained for more precise statistical analysis. A hierarchical cluster analysis (HCA) of the detected flavonoids revealed that the kale and berries juice samples contained a greater number of high abundance flavonoids. In contrast, most flavonoids detected from the "red" juice sample were present in low concentrations. The principal component analysis (PCA) shown in Figure 5 reveals that the three juice samples are well differentiated. The proximity of the points for each replicate analyses highlights the precision of the method. This approach could potentially be used in food analysis workflows to support juice adulteration testing.
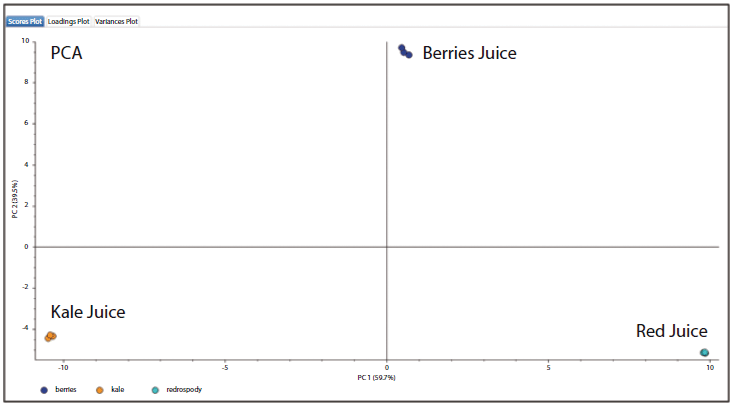
Figure 5: Principal components analysis (PCA) of flavonoid compounds identified from the three juice samples.
Conclusion
The limited availability of authentic flavonoid reference standards has proven to be a major challenge for flavonoid structure characterization workflows, with existing profiling efforts largely reliant upon manual and time-consuming assignment of MS2 and higher-order MS fragmentation data. The novel structure-based MSn flavonoid profiling workflow presented overcomes these challenges to deliver comprehensive unknown compound annotation, without the need for in-depth knowledge of flavonoid fragmentation rules. Using this approach to analyze three juice samples, over twice as many flavonoids were annotated compared to an MS2-only method. This broad coverage enabled PCA to be performed, highlighting distinct differences in the flavonoid composition of the three juices. This workflow is well-suited for the analysis of juices for food integrity applications.
References
(1) A.N. Panche, A.D. Diwan, and S.R. Chandra, J. Nutr. Sci. 5, e47 (2016).
(2) V.C. George, G. Dellaire, and H.P. Vasantha Rupasinghe, J. Nutr. Biochem. 45, 1 (2017).
(3) P. Kachlicki, A. Piasecka, M. Stobiecki, and L. Marczak, Molecules 21, 1494 (2016).
(4) D. Tsimogiannis, M. Samiotaki, G. Panayotou, and V. Oreopoulou, Molecules12, 593 (2007).
(5) J.J.J. van der Hooft, J. Vervoort, R. J. Bino, J. Beekwilder, and R.C.H. de Vos, Anal. Chem. 83, 409 (2011).
Acknowledgements
This article is based on research conducted by Reiko Kiyonami, Seema Sharma, Graeme McAlister, Caroline Ding, and Andreas Huhmer of Thermo Fisher Scientific, and Iwao Sakane of ITO EN Ltd, Tokyo, Japan.
Simon Cubbon is a Senior Global Marketing and Strategy Manager for connected laboratory and software at Thermo Fisher Scientific. Direct correspondence to: simon.cubbon@thermofisher.com

Accelerating Monoclonal Antibody Quality Control: The Role of LC–MS in Upstream Bioprocessing
This study highlights the promising potential of LC–MS as a powerful tool for mAb quality control within the context of upstream processing.
Using GC-MS to Measure Improvement Efforts to TNT-Contaminated Soil
April 29th 2025Researchers developing a plant microbial consortium that can repair in-situ high concentration TNT (1434 mg/kg) contaminated soil, as well as overcome the limitations of previous studies that only focused on simulated pollution, used untargeted metabolone gas chromatography-mass spectrometry (GC-MS) to measure their success.
Prioritizing Non-Target Screening in LC–HRMS Environmental Sample Analysis
April 28th 2025When analyzing samples using liquid chromatography–high-resolution mass spectrometry, there are various ways the processes can be improved. Researchers created new methods for prioritizing these strategies.
Potential Obstacles in Chromatographic Analyses Distinguishing Marijuana from Hemp
April 28th 2025LCGC International's April series for National Cannabis Awareness Month concludes with a discussion with Walter B. Wilson from the National Institute of Standard and Technology’s (NIST’s) Chemical Sciences Division regarding recent research his team conducted investigating chromatographic interferences that can potentially inflate the levels of Δ9-THC in Cannabis sativa plant samples, and possible solutions to avoid this problem.

.png&w=3840&q=75)

.png&w=3840&q=75)


.png&w=3840&q=75)


.png&w=3840&q=75)


