Quality by Design: A Tool for Separation Method Development in Pharmaceutical Laboratories
Special Issues
Quality by design (QbD) has gained in importance in the pharmaceutical industry and is supported by several regulatory documents (ICH, FDA). The aim is to ensure product quality through a better understanding of products and processes during pharmaceutical development. As analytical procedures are critical processes of pharmaceutical product development and quality control (QC), QbD has become a key tool in the development of analytical methods. This article outlines the general trends observed when applying QbD to the development of separation methods in pharmaceutical analysis. The main pharmaceutical applications are reviewed along with a detailed description of tools involved in QbD methodology. A focus on QbD benefits for the pharmaceutical industry is provided.
Photo Credit: Ralf Hiemisch/Getty Images

Karen Gaudin and Ludivine Ferey, School of Pharmaceutical Sciences, Bordeaux University, Bordeaux, France
Quality by design (QbD) has gained in importance in the pharmaceutical industry and is supported by several regulatory documents (ICH, FDA). The aim is to ensure product quality through a better understanding of products and processes during pharmaceutical development. As analytical procedures are critical processes of pharmaceutical product development and quality control (QC), QbD has become a key tool in the development of analytical methods. This article outlines the general trends observed when applying QbD to the development of separation methods in pharmaceutical analysis. The main pharmaceutical applications are reviewed along with a detailed description of tools involved in QbD methodology. A focus on QbD benefits for the pharmaceutical industry is provided.
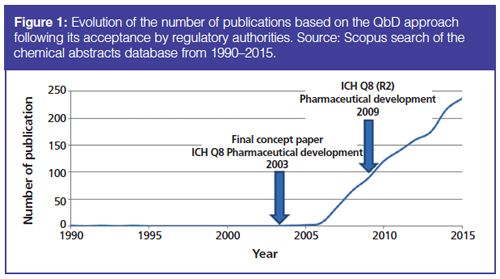
The concept of quality by design (QbD) was first introduced in 2004 by the US Food and Drug Administration (FDA), as an essential pharmaceutical quality model to be considered in the development of new products and processes (1). Later, QbD was supported by the International Conference on Harmonization (ICH). Since the adoption of the ICH Q8 (R2) guideline encouraging the implementation of a QbD approach in pharmaceutical development, QbD has become a key methodology in the pharmaceutical industry (2). Indeed, the number of publications discussing QbD has exponentially increased over the last 10 years, as shown in Figure 1.
In the ICH Q8 (R2) guideline, QbD is defined as “a systematic approach to development that begins with predefined objectives and emphasizes product and process understanding based on sound science and quality risk management” (2). The main purpose is to improve the quality of pharmaceutical products and ultimately patient safety by designing quality directly into pharmaceutical processes. Processes are better understood compared to the quality-by-testing (QbT) approach, which is traditionally implemented in the pharmaceutical industry. In fact, QbT does not ensure product quality since processes and products cannot be sufficiently known and controlled.
A QbD approach is mainly applied to the development of new pharmaceutical formulations, as encouraged by the specific guideline (2). However, in the ICH Q8 (R2) guideline, the need to gain a greater understanding of all processes involved in product development to achieve a proper control strategy is outlined. By supporting drug development and quality control (QC) activities, analytical procedures form an integral part of pharmaceutical processes. Analytical methods play a key role throughout a drug product life cycle because they ensure efficacy and safety of a pharmaceutical product by including scientific and regulatory knowledge, as well as QC needs. As a result, QbD is being adopted more and more by pharmaceutical and biopharmaceutical analysts to achieve a higher quality of analytical methods and thus a higher quality of the pharmaceutical product. The ICH Q8 (R2) guideline is completed by the ICH Q9 (3) and Q10 (4) guidelines, which provide a comprehensive overview of the basic tools that can be used to effectively build quality into products.
This article presents examples of applications of QbD in the development of separation methods for pharmaceutical analysis. The global methodology of QbD is summarized, followed by a focus on some essential tools and concepts related to QbD strategy. Finally, this article concludes on how QbD stands out as a powerful tool for the pharmaceutical analyst.
Applications
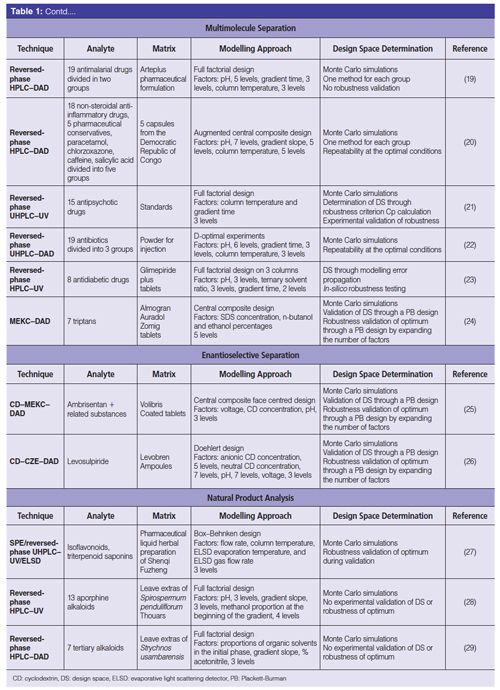
Table 1 classifies the use of QbD for the development of separation methods dedicated to pharmaceutical analysis in four main applications: the simultaneous analysis of an active pharmaceutical ingredient (API) and its related substances; multimolecule separation; enantioselective separation; and natural product analysis. All of these applications are encountered in the pharmaceutical industry and are challenging because of the simultaneous analysis of an important number of molecules and the difficulty of separating molecules with closely related properties.
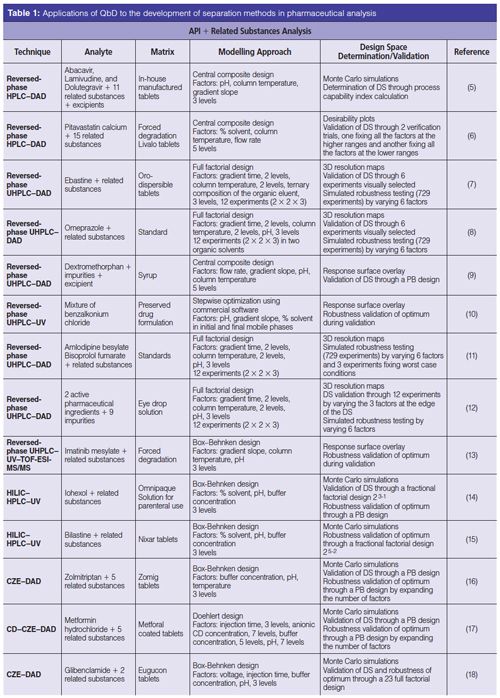
Related substance analysis represents one of the most challenging analytical applications required in QC and research and development activities. As these methods are included in the Common Technical Document (CTD) of a pharmaceutical product, the robustness of the method is an added value. Samples to be analyzed can be highly complex because of the combination of unreacted starting materials, impurities originating from starting materials, unreacted intermediates, reaction byproducts, and degradation products. Compounds with closely related structures are present at very different concentrations in the samples, making the development of separation methods difficult. However, these impurities usually provide no benefit to patients and can actually constitute risks to patient safety or drug efficacy. There is a great need therefore to be able to control them during the manufacturing process and in the final product. To deal with such expectation, a QbD strategy has proved to be appropriate. For the study of related compounds in a QC context, the most current techniques coupled to QbD are high performance liquid chromatography (HPLC) and ultrahigh-pressure liquid chromatography (UHPLC) in reversedâphase mode (5–13). However, as QbD provides a better understanding of the development process, more complex and recent techniques that suffer from robustness problems (such as, hydrophilic interaction liquid chromatography [HILIC] and capillary zone electrophoresis [CZE]) could take advantage of this approach (14–18).
The second important pharmaceutical application using QbD is the separation of several APIs for the detection of counterfeit medicines (19–23) or for homologous molecule analysis in QC (24). When a high number of compounds (above 10) needs to be simultaneously separated, the method must be specific and robust to distinguish one API from another. QbD is the most appropriate tool to speed up the development of such a method, while also improving knowledge acquired on the analytical method.
Enantioselective separations represent a fundamental field of research in drug analysis because the potential biological activity of chiral compounds is mostly down to one enantiomer only. Optical purity, that is, enantiomeric excess (ee), determination represents a major challenge for the analyst. Indeed, the main enantiomer is the active one and is present in high amounts in the sample, whereas the impurity enantiomer is expected to be under 0.1% of the main enantiomer. To quantify the chiral impurity, the complete separation of the two enantiomers is required with a low limit of quantitation for the impurity enantiomer. However, enantiomers have closely related physico-chemical properties, making the separation challenging. CZE is a powerful technique for chiral analysis because of its high efficiency, fast analysis, and the low amounts of chiral selector required. Cyclodextrins are the most commonly used chiral selectors in CZE. The association of QbD with CZE proves that robust methods for enantioseparations can be achieved (25,26).
The final application combining QbD and separation method development in pharmaceutical analysis is the characterization of natural products. Traditional medicine still holds an important place in curing disease in developing countries. This also includes occidental countries with a greater use of phytotherapy and an increased consumption of natural medicines and food supplements. Efficient analytical methods are required for structural identification, classification of varieties or geographical origin, and purification purposes. The safety and quality aspects of finished herbal medicinal products depend on source materials of high complexity and variability because they can include hundreds of constituents. Fast, selective, and accurate analytical methods are therefore needed. QbD can manage this natural heterogeneity to provide the best controlled separations (27–29). In addition, the optimization offered by QbD can combine separation parameters with those of the extraction that may be intercorrelated (27). Therefore, the optimum condition and the design space are designed taking into account the influence of both separation and extraction methods.
The main use of QbD in the optimization of separation method development lies in the separation of samples composed of a large number of molecules. This approach takes advantage of the design of experiments to find the optimum method for the separation and to provide method robustness. QbD is a powerful tool that can offer a guarantee of separation quality.
QbD Methodology
Traditional univariate methods vary only one factor at a time (OFAT) between consecutive experiments. Such method development strategies can lead to nonoptimized methods and offer no warranty of robustness. On the contrary, by conducting a systematic development, QbD allows optimal method performance to be obtained.
An implementation of the QbD approach during analytical method development involves several steps, as described in Figure 2.
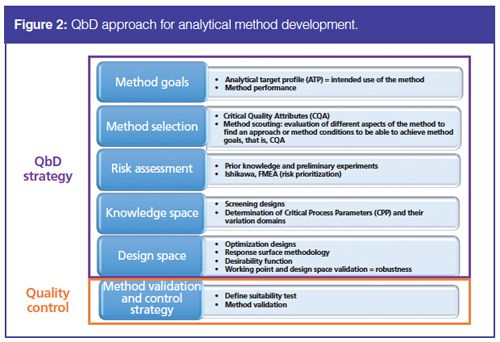
QbD requires the determination of predefined objectives of the analytical method, called the analytical target profile (ATP). The intended purpose of the method can be stability testing, quantitative determination, or a limit test. This means that the goals of the method - including its performance -must be precisely described before the development. For separation methods, the objectives could be described as the separation of compounds with an identification or quantification purpose, with no specification of the separation technique at this step.
The method is selected based on its ability to fulfill the objectives specified in the ATP. A significant amount of knowledge of analytical technologies and the drug helps with the selection of an appropriate method. Through method scouting experiments and prior knowledge, the most suitable analytical technique is chosen: HPLC, UHPLC, or CZE. At the same time, Critical Quality Attributes (CQAs) are selected. They are defined in ICH Q8 (R2) as “physical, chemical, biological, or microbiological property or characteristic that should be within an appropriate limit, range, or distribution to ensure the desired product quality” (2). These elements convert the intended purpose of the method into performance criteria. Therefore, the CQAs are a measure of method performance in accordance with the ATP - in other words, the method specifications. In chromatographic methods, resolution of the critical pairs (5,7,8,17,18,21,25), time differences between chromatographic peaks (19,20,22), analysis time (24–26), and even robustness as allowed by a QbD approach (5,21) are examples of CQAs to evaluate separation quality.
Once the CQAs are selected, the method under development follows a quality risk assessment to investigate Critical Process Parameters (CPPs). CPPs are “parameters whose variability has an impact on CQAs and therefore should be monitored or controlled to ensure the process produces the desired quality” (2). Risk assessment tools can be used to identify and rank parameters with a potential impact on method quality, based on prior knowledge and initial experimental data. A fishbone diagram, also known as Ishikawa diagram, identifies potential factors and classifies risks associated with these factors into groups related to instrumentation, materials, methods, chemicals and reagents, operators, and laboratory environment (5,9,30,31). Risk factors can be further ranked and prioritized through a Failure Mode and Effect Analysis (FMEA) approach (32). This approach guarantees that all parameters of the analytical method were listed and their influence evaluated.
High-risk parameters, known as Critical Process Parameters (CPPs), are then assessed experimentally through screening designs, which are first-degree Design of Experiments (DOEs). For separation methods, mobile phase or buffer pH often appears as a CPP when ionizable compounds have to be separated, since pH has an impact on resolution between compounds (5,8–20,25,26). Others factors identified as CPPs are flow rate (6,9,27); gradient slope (5, 7–13,19–23,28,29) in reversedâphase HPLC; percentage organic solvent in the initial and final mobile phases (6,10,14,15,28,29) in reversed-phase HPLC and HILIC–HPLC; buffer concentration (14–18) in HILIC–HPLC and CZE; and column or capillary temperature in HPLC and CZE. During this stage, the knowledge space is fixed, which corresponds to the range of CPP variation.
DOEs based on higher-order polynomial models are then performed to optimize CPPs through a response-surface methodology, that is, the modelling of the CQAs as a function of the CPPs.
The main goal of a QbD approach is, in fine, to define the Method Operable Design Region (MODR) or the Design Space (DS). This is the multidimensional subspace of the experimental domain where assurance of analytical method quality is provided. This domain is determined using a desirability function. Further information about the concept of DS for analytical methods is provided later in the article. A detailed review on DS for analytical methods is also available in the literature (33). The final step of the QbD approach is the validation of the DS to prove experimentally that the ATP is achieved inside the DS. The range of each CPP is thus validated and the robustness domain of the achieved method is described.
To use the optimized method routinely in QC laboratories, a formal validation is necessary (34–36). The final step is the implementation of a control strategy to ensure that the method will perform as expected during its routine use (4). Some responses measuring method performance, known as systemâsuitability criteria, are selected and monitored at each analytical run during routine applications. Therefore, risk assessment and DS definition involved in QbD approach can help to identify an appropriate control strategy (36).
DOE and Response Modelling
DOEs are key components of a QbD methodology. Compared to the OFAT approach, DOEs minimize the number of experiments, while gaining knowledge about the analytical method. Such multivariate strategies allow the evaluation of the effects of the factors and their interactions, the modelling and the prediction of the responses as a function of the factors, and, in fine, the determination of the DS. The factors are the CPPs and the responses the CQAs.
Method optimization often begins with a screening phase followed by an optimization step using screening and response-surface designs, respectively.
Screening Designs: After a risk prioritization, where a high number of factors have been revealed as potentially critical on method performance, screening designs are used to identify which parameters are effectively critical. The aim is the selection of CPPs. Such designs allow the evaluation of a relatively high number of factors (qualitative or quantitative) - mostly at two levels in a relatively low number of experiments. The relation between the responses and the factors is described by a first-order polynomial model. An estimation of the main effects of factors on the considered responses, mainly the CQAs, can be assessed by calculating model coefficients for the linear terms. Factors with the most significant affect on the analytical method are retained as CPPs. Interaction effects between factors are rarely evaluated, while higher order terms, for example, quadratic effects, cannot be studied. Indeed, two-level screening designs don’t allow modelling of curvature. Such designs are therefore not sufficient to investigate a process involving interactions and higherâorder effect terms. The most often applied screening designs are two-level fractional factorial or two-level Plackett-Burman designs (9,27,37).
Response-Surface Designs: Once identified, CPPs are further studied through a response-surface method to predict CQAs. For a given number of parameters, many more experiments are required compared to first degree screening designs. The analysis of the results is focused on building a mathematical model linking the responses (CQAs) to the factors (CPPs). More than two levels for each factor are needed to fit quadratic or higher-order-term polynomial functions and, thus, to model the curvature in the function responses. Interactions between factors and higher-order effect terms can then be evaluated.
Full factorial designs (7,8,11,12,19,21,23,28,29), central composite designs (5,6,9,20,24,25), Box-Behnken (13–16,18,27), and Doehlert designs (17,26) are commonly used. Figure 3 shows the experimental domains resulting from the study of three factors for central composite designs, BoxâBehnken designs, and Doehlert designs. D-optimal designs can also be performed in particular cases, for example, when experimental space is constrained or standard factorial designs require too many runs (22).
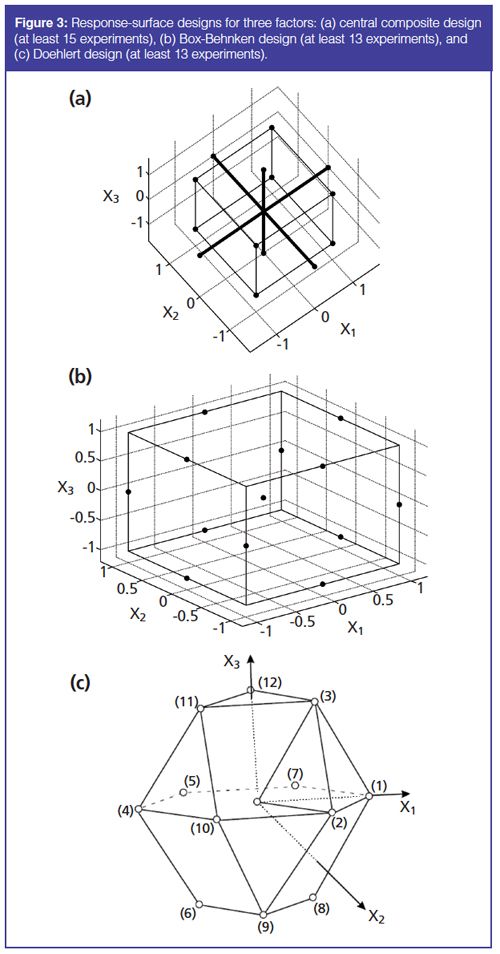
Such DOEs are essential tools to define the DS of an analytical method (33). Indeed, the model enables response values (CQAs) within the investigated experimental domain to be predicted. Moreover, model-parameter uncertainty and the prediction uncertainty of the model can be estimated, providing information on the probability of meeting the specifications imposed on CQAs. The resulting DS corresponds to a subspace of the experimental domain where a level of quality is ensured, that is, the CQAs meet the specifications with a given probability.
Response Modelling: Responses can be modelled in different ways. The first approach uses optimization software for an automated method development. Such software is mostly dedicated to reversed-phase HPLC and based on the well-known linear solvent-strength theoretical model. Several software systems are available commercially (7,8,11,12,38). However, such theoretical models do not usually take into account all the parameters that may impact the analytical method. Moreover, the variability or the method quality (the robustness) is not included in the method development.
A second approach is the use of empirical models based on DOEs and multiple linear regressions (MLR). Such models link the responses to the factors investigated by fitting an appropriate polynomial model on the data obtained from DOEs. Software used for such empirical approaches is that classically dedicated to experimental designs. However, there is software that is appropriate for QbD developments by combining DOE, MLR, and some specific CQAs to evaluate method robustness (21,39).
Design Space: As mentioned previously, the main aim in applying QbD to analytical method development is to establish a DS. In the ICH Q8 (R2) guideline, DS is defined as “the multidimensional combination and interaction of input variables (such as material attributes) and process parameters that have been demonstrated to provide assurance of quality” (2).
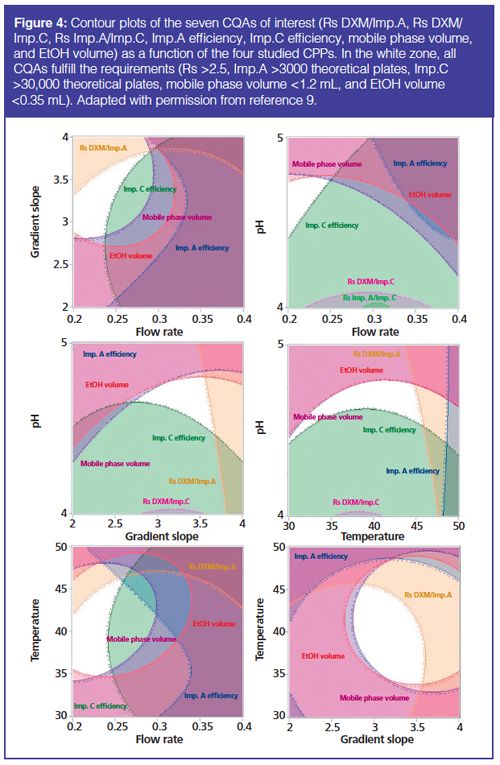
Most of the time, DS is represented graphically through response surface overlay. A graph displaying multiple CQA objectives is plotted using software (Figure 4). This example deals with the development of a UHPLC method for the simultaneous analysis of dextromethorphan (DXM) and its main degradation products (9). Contour plots of the seven studied CQAs as a function of the four CPPs are overlaid and DS is represented by the white zone where all CQAs meet predefined criteria.
Up to now, the DS of an analytical method has been mainly defined through mean-response surfaces. However, mean-response surfaces do not provide any guarantee about method quality, and so it is impossible to know with which probability the CQAs will reach the performance criteria. As “assurance of quality” is clearly required by ICH Q8 (R2)guideline (2), the level of assurance that the analytical method will meet the specifications must be known. This is why a group of researchers highlighted the need to consider the prediction uncertainty by taking into account the model-coefficient uncertainty, that is, the model uncertainty (40). The Monte Carlo study is the most implemented strategy (5,14–26). By including model coefficient uncertainty, a model’s predictive errors can be calculated. This provides access to the distributions of the modelled responses for each operating condition of the DOE. Consequently, when establishing the DS, a level of quality assurance can be set by imposing a probability threshold above which the CQAs meet the requirements. As an example, Debrus et al. performed Monte Carlo simulations to compute and model a “robustness criteria”, called Cp. As such criterion was a quantitative measure of the variation of the predicted responses, it was modelled as an additional CQA to guarantee the quality of the method (21). Quality should be assured inside the DS and as specified by ICH Q8 guideline “working within the design space is not considered as a change” (2), DS should represent a zone of robustness of the analytical method.
The final step of the QbD method is to experimentally validate the DS. To limit the number of experiments, DOEs are usually required. Screening designs, such as two-level fractional factorial or two-level Plackett-Burman designs, are sufficient to achieve this validation. To validate the whole DS, CPPs are usually varied from the lowest to the highest limits of the DS borders (6,9,14,16–18 24–26). DS represents the robustness zone of the method, and so a classical robustness study verifying the influence of small changes of the CPPs around the working point on the CQAs performance is not required. However, after DS determination, it may be preferred to perform a robustness study before or juxtaposed to a complete method validation (6,14,
16–18,24–26). Additional parameters may be added, but the range of variation of each parameter is often reduced in comparison to the values defined by the DS.
Another approach has been proposed by Molnár et al. Using chromatography modelling software, a robustness testing is simulated over more than 700 conditions by enlarging the number of tested factors compared to the number of CPPs retained for the optimization step. Some selected points are then experimentally checked (7,8,11,12).
Some authors limit the DS validation to a traditional robustness validation of the optimum point, leading to methods with a smaller robustness domain because the method operable region is also reduced (10,13,27). Finally, in several papers DS validation and robustness validation have been replaced by a single repeatability study at optimal conditions (20,22) without verifying if the DS is correctly defined. This latter approach cannot provide a DS for the analytical method under development, while robustness inside is not experimentally checked. This conflicts with the objectives of QbD to develop a robust method.
Conclusion
A QbD approach for analytical method development aims at determining a multivariate domain, called the design space (DS), where method critical parameters have been demonstrated to provide assurance of quality. In fact, the analytical method is no longer restricted to one single combination of parameters, but is now identified by a set of operating conditions defining the DS. Inside the DS, the method achieves the predefined performance with a high level of probability.
Many benefits are intrinsic to QbD for the pharmaceutical industry. Robust methods are developed so that fewer method failures may
appear during routine use in QC laboratories. Moreover, higher flexibility is achieved because moving inside the DS is not considered a change and does not require any further regulatory approval. QbD offers a deeper understanding of the analytical method through the evaluation of the main and interaction effects of the method parameters on its performance. This additional knowledge gained during development is crucial for pharmaceutical analysts. Method validation becomes less prone to unpredictable errors, analyst reactivity is improved to face future operating problems, and strong scientific justification may influence future regulatory frameworks. Finally, method transfer from one laboratory to another is simpler because the adaptation of the transferred method will be eased by the knowledge of its DS at the receiving site.
Throughout the product life cycle, companies have the opportunity to evaluate innovative approaches to improve product quality. QbD, through a more systematic approach, plays a major role in assessing the potential of new techniques and thus contributes to continual improvement within the pharmaceutical industry.
References
- US Food and Drug Administration (FDA), Department of Health and Human Services, Pharmaceutical cGMPs for the 21st Century - A Risk-Based Approach, Final report, September 2004 (http://www.fda.gov/downloads/Drugs/DevelopmentApprovalProcess/Manufacturing/Questionsand AnswersonCurrentGoodManufacturingPracticescGMPforDrugs/UCM176374.pdf)
- International Conference on Harmonization (ICH) of Technical Requirements for Registration of Pharmaceuticals for Human Use, Topic Q8 (R2): Pharmaceutical Development (ICH, Geneva, Switzerland, 2009).
- International Conference on Harmonization (ICH) of Technical Requirements for Registration of Pharmaceuticals for Human Use, Topic Q9: Quality Risk Management (ICH, Geneva, Switzerland, 2005).
- International Conference on Harmonization (ICH) of Technical Requirements for Registration of Pharmaceuticals for Human Use, Topic Q10: Pharmaceutical Quality System (ICH, Geneva, Switzerland, 2008).
- T. Tol, N. Kadam, N. Raotole, A. Desaib, and G. Samanta, J. Chromatogr. A1432, 26–38 (2016).
- B. Hariram, R. Suresh Kumar, A. Jaya Shree, D. Venugopala Rao, L. Kalyanaraman, and K. Srinivas, Chromatogr. 78, 1017–1029 (2015).
- A.H. Schmidt and I. Molnár, J. Pharm. Biomed. Anal.78–79, 65–74 (2013).
- A.H. Schmidt and M. Stanic, LCGC North America32, 126–148 (2014).
- C. Boussès, L. Ferey, E. Vedrines, and K. Gaudin, J. Pharm. Biomed. Anal. 115, 114–122 (2015).
- R. Mallik, S. Raman, X. Liang, A.W. Grobin, and D. Choudhury, J. Chromatogr. A1413, 22–32 (2015).
- R. Kormany, I. Molnár, J. Fekete, D. Guillarme, and S. Fekete, Chromatogr.77, 1119–1127 (2014).
- K. Monks, I. Molnár, H.J. Rieger, B. Bogati, and E. Szabo, J. Chromatogr. A1232, 218–230 (2012).
- Z. Ren, X. Zhang, H. Wang, and X. Jin, RSC Adv. 6, 13050–13062 (2016).
- M. Jovanovic, T. Rakic, A. Tumpa, and B. Jancic Stojanovic, J. Pharm. Biomed. Anal. 110, 42–48 (2015).
- J. Terzic, I. Popovic, A. Stajic, A. Tumpa, and B. Jancic Stojanovic, J. Pharm. Biomed. Anal. 125, 385–393 (2016).
- S. Orlandini, B. Pasquini, C. Caprini, M. Del Bubba, S. Pinzauti, and S. Furlanetto, Electrophoresis36, 2642–2649 (2015).
- S. Orlandini, B. Pasquini, R. Gotti, A. Giuffrida, F. Paternostro, and S. Furlanetto, Electrophoresis 35, 2538–2545 (2014).
- S. Furlanetto, S. Orlandini, B. Pasquini, and C. Caprini, Anal Bioanal Chem 407, 7637–7646 (2015).
- B. Debrus, P. Lebrun, J.K. Mbinze, F. Lecomte, A. Ceccato, G. Caliaro, J. Mavar Tayey Mbay, B. Boulanger, R.D. Marini, E. Rozet, and Ph. Hubert, J. Chromatogr. A 1218, 5205–5215 (2011).
- J.K. Mbinze, P. Lebrun, B. Debrus, A. Dispas, N. Kalenda, J. Mavar Tayey Mbay, T. Schofield, B. Boulanger, E. Rozet, Ph. Hubert, and R.D. Marini, J. Chromatogr. A1263, 113–124 (2012).
- B. Debrus, D. Guillarme, and S. Rudaz, J. Pharm. Biomed. Anal.84, 215–223 (2013).
- J.K. Mbinze, A. Dispas, P. Lebrun, J. Mavar Tayey Mbay, V. Habyalimana, N. Kalenda, E. Rozet, Ph. Hubert, and R.D. Marini, J. Pharm. Biomed. Anal.85, 83–92 (2013).
- H.I. Mokhtar, R.A. Abdel-Salam, and G.M. Hadad, J. Chromatogr. A1399, 32–44 (2015).
- B. Pasquini, S. Orlandini, M. Del Bubba, E. Bertol, and S. Furlanetto, Electrophoresis36, 2650–2657 (2015).
- S. Orlandini, B. Pasquini, C. Caprini, M. Del Bubba, M. Dousa, S. Pinzauti, and S. Furlanetto, J. Chromatogr. Adoi:10.1016/j.chroma.2016.06.082 (2016).
- S. Orlandini, B. Pasquini, M. Del Bubba, S. Pinzauti, and S. Furlanetto, J. Chromatogr. A1380, 177–185 (2015).
- L. Wang and H. Qu, Anal. Bioanal. Chem. 408, 2133–2145 (2016).
- M.H. Rafamantanana, B. Debrus, G.E. Raoelison, E. Rozet, P. Lebrun, S. Uverg-Ratsimamanga, P. Hubert, and J. Quetin-Leclercq, J. Pharm. Biomed. Anal. 62, 23–32 (2012).
- I. Nistor, M. Cao, B. Debrus, P. Lebrun, F. Lecomte, E. Rozet, L. Angenot, M. Frederich, R. Oprean, and P. Hubert, J. Pharm. Biomed. Anal. 56, 30–37 (2011).
- S. Orlandini, S. Pinzauti, and S. Furlanetto, Anal. Bioanal. Chem. 405, 443–450 (2013).
- K. Ishikawa, What is Total Quality Control? The Japanese Way (Prentice-Hall, Englewood Cliffs, NJ, USA, 1985).
- D. Stamatis, Failure Modes and Effects Analysis, Second Edition (ASQ Quality Press, Milwaukee, WI, USA, FMEA from Theory to Execution, 2003).
- E. Rozet, P. Lebrun, B. Debrus, B. Boulanger, and P. Hubert, Trends Anal. Chem. 42, 157–167 (2013).
- International Conference on Harmonization (ICH) of Technical Requirements for registration of Pharmaceuticals for Human Use, Topic Q2 (R1): Validation of Analytical Procedures: Text and Methodology (ICH, Geneva, Switzerland, 2005).
- C. Hubert, S. Houari, E. Rozet, P. Lebrun, and Ph Hubert, J. Chromatogr. A1395, 88–98 (2015).
- F.G. Vogt and A.S. Kord, J. Pharm. Sci. 100, 797–812 (2001).
- D. Awotwe-Otoo, C. Agarabi, P.J. Faustino, Muhammad J. Habib, S. Lee, M.A. Khan, and R.B. Shah, J. Pharm. Biomed. Anal.62, 61–67 (2012).
- C. Horváth, W. Melander, and I. Molnár, J. Chromatogr.125, 129–156 (1976).
- R. Cela, E.Y. Ordonez, J.B. Quintana, and R. Rodil, J. Chromatogr. A1287, 2–22 (2013).
- P. Lebrun, B. Govaerts, B. Debrus, A. Ceccato, G. Caliaro, P. Hubert, and B. Boulanger, Chemom. Intell. Lab. Syst.91, 4–16 (2008).
Karen Gaudin completed a Ph.D. in analytical chemistry in 1999 at the School of Pharmacy of Paris XI University in France. She is a professor and director of a research team focusing on analytical and pharmaceutical developments at the University of Bordeaux. These main developments concern strategies to analyze APIs or lipids in new pharmaceutical products using various separation techniques (reversed phase, HILIC) and detectors (CAD) eventually in green chemistry and QbD. She has published more than 50 papers in reputed journals and serves as an editorial board member of repute.
Ludivine Ferey has completed a Ph.D. in analytical chemistry at the Industrial Physics and Chemistry Higher Educational Institution (ESPCI) in Paris, France. She is an associate professor in the ChemBioPharm team (ARNA, INSERM U1212) at the University of Bordeaux in France. Her research is focused on the use of chemometric tools, mostly QbD, for the development and optimization of separation analytical methods in the field of pharmaceutical analysis.
Polysorbate Quantification and Degradation Analysis via LC and Charged Aerosol Detection
April 9th 2025Scientists from ThermoFisher Scientific published a review article in the Journal of Chromatography A that provided an overview of HPLC analysis using charged aerosol detection can help with polysorbate quantification.
Analyzing Vitamin K1 Levels in Vegetables Eaten by Warfarin Patients Using HPLC UV–vis
April 9th 2025Research conducted by the Universitas Padjadjaran (Sumedang, Indonesia) focused on the measurement of vitamin K1 in various vegetables (specifically lettuce, cabbage, napa cabbage, and spinach) that were ingested by patients using warfarin. High performance liquid chromatography (HPLC) equipped with an ultraviolet detector set at 245 nm was used as the analytical technique.
Removing Double-Stranded RNA Impurities Using Chromatography
April 8th 2025Researchers from Agency for Science, Technology and Research in Singapore recently published a review article exploring how chromatography can be used to remove double-stranded RNA impurities during mRNA therapeutics production.


