The Problems with Large-Molecule Separations
Some attributes of large molecules make them behave differently from small molecules in reversed-phase separations.
Some attributes of large molecules make them behave differently from small molecules in reversed-phase separations.
Several readers have sent emails to me lately with questions and problems related to the liquid chromatographic separation of proteins, peptides, and other large molecules, so I've combined their questions into a discussion of some of the problems related to such separations. I'll use proteins as the model compounds, although the general behaviour of large molecules is similar. Reversed-phase liquid chromatography (LC) is the most popular separation technique for these molecules, and will be the focus of this month's "LC Troubleshooting" instalment. Reversed-phase LC, of course, is a denaturing technique, so it is good for analysis, but not for purification or recovery of intact molecules. For example, if you want to separate an enzyme from other compounds and then collect it for other uses, you'll want to preserve the activity of the enzyme. This means that the mobile phase must be sufficiently gentle that it does not denature the protein. Some techniques to accomplish this include ion exchange, gel permeation chromatography (GPC), hydrophobic interaction chromatography (HIC), and affinity chromatography, each of which use a nondenaturing aqueous mobile phase. Reversed-phase mobile phases for protein separations usually include acetonitrile, which will irreversibly denature the proteins.
When protein separations by Reversed-phase LC were first being explored in the 1980s, some workers thought that the separation mechanism was completely different than that for small-molecule separations. Today, we know that is not the case — the same rules apply. But there are some aspects of the separation that we have to be careful of or we will not get the results we expect. Even today these "surprises" can confound workers new to the field. Let's look at some of the aspects of large-molecule separations that we need to pay attention to with reversed-phase LC.
Column Selection
Before starting any kind of LC separation, we need to pick a column. There are literally hundreds of Reversed-phase columns to choose from, but we still need to make a wise choice. With small molecules, typically we start with a silica-based column with a C18 or C8 bonded phase. With large molecules, a C4 phase is a much more common choice. For small-molecule separations (for example, <1000 Da), the sample molecules are small enough to get between the bonded phase chains on the packing surface, so different chain lengths will effectively result in a different amount of chemically active surface area. Thus, we typically observe that a C18 phase will have retention factors that are perhaps 70% larger than those for a C8 phase, or that it takes approximately 5% more organic solvent to get the same retention time with a C18 phase as with a C8 phase. On the other hand, large molecules (for example, >10 kDa) are too large to penetrate the densely bonded phase, so they only "see" the tips of the bonded phase chains. This means that a C8, C18, and even C4 chain length "look" about the same to a large molecule. Another way to think of this is to visualize the column packing as a toothbrush, where the handle of the brush is the silica support and the bristles are the stationary phase molecules, fastened at one end. Small molecules might be thought of as grains of sand, which can penetrate into the densely packed bristles, whereas a large molecule might be more like a marble that sits on top of the tips of the bristles. So there isn't much effect of bonded phase chain length on retention with large molecules. Early in the development of such separations, a C4 chain length was chosen and has become the defacto standard for protein separations.
A second aspect of the column that is important is the size of the pores in the packing particles. The silica support is not a solid bead with the bonded phase on the outside, like the fuzz on a tennis ball. A better description would be a porous sponge, or better yet, a popcorn ball, where the pores are the spaces between the kernels. As a result, nearly all the surface area is within the particle, not on the outside. For this reason, the pores have to be large enough that the sample molecules can easily penetrate the pores. As a rule of thumb, we want the pore diameter to be at least three times the hydrodynamic diameter of the sample molecule. Columns used for small-molecule separations typically have pore diameters that range (between products) of 6–15 nm (60–150 Å), which are ample for free movement of small molecules in and out of the pores. Such pores, however, are too small for proteins, where pore diameters of 30–40 nm (300–400 Å) are more common. Larger-pore columns are available for size exclusion separations, but surface area is roughly proportional to the pore diameter, and retention to surface area, so excessive pore diameters may translate to insufficient retention.
Mobile-Phase Selection
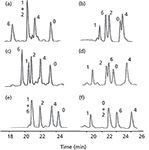
Acetonitrile is usually chosen as the organic solvent for reversed-phase separation of proteins. Methanol could be used, but acetonitrile has the added advantage of transparency at low wavelengths (<220 nm), which often are necessary for detection. Trifluoroacetic acid is the preferred mobile-phase additive. At 0.1% trifluoroacetic acid in water for the A solvent and 0.1% trifluoroacetic acid in acetonitrile as the B solvent, a low pH (~2) and ion-pairing conditions are achieved. Fine-tuning of the concentration of trifluoroacetic acid may improve the separation, as is illustrated in Figure 1, where dramatic changes in retention order of a peptide sample are observed when the concentration of trifluoroacetic acid is changed over a range of 0.02% to 0.8%. However, most workers use 0.1% trifluoroacetic acid and don't vary it. Although trifluoroacetic acid–acetonitrile mobile phases are good for ultraviolet detection down to 200 nm, these mobile phases can cause ion suppression with mass spectrometric detection (LC–MS) when an electrospray ionization (ESI) interface is used. If such problems are encountered, LC–MS with an atmospheric pressure chemical ionization (APCI) interface may be a better choice because ion suppression is much less of a problem with APCI than ESI.

Figure 1: Effect of trifluoroacetic acid concentration on retention of basic peptides (the number of basic groups is indicated on each peak): (a) 0.02%, (b) 0.2%, (c) 0.05%, (d) 0.4%, (e) 0.1%, and (f) 0.8%. Adapted from reference 1.
Gradient Conditions
The selection of the gradient conditions is the place where it is most common to run into problems when setting up a large molecule separation. It is unlikely that a separation will be achieved under isocratic conditions for large molecules, so gradients are standard. The gradient retention factor, k*, is defined as:

where tG is the gradient time (in minutes), F is the flow rate (millilitres per minute), Vm is the column volume (millilitres), ΔΦ is the gradient range (for example, 5–80% = 0.75), and S is a constant that is dependent on the molecular weight of the sample.
S can be estimated as follows:

where MW is the molecular weight (in daltons).
To obtain "good" chromatography, we like to have 2 < k* < 10. Let's see how typical gradient conditions for a 400 Da, small molecule sample fit into this target region for k*. Typical conditions might be a 150 mm × 4.6 mm column operated at 2 mL/min with a 5–95% B gradient over 20 min. In this case, S ≈ 0.25 × 4000.5 = 5, and the column volume is ~1.5 mL. So k* = (20 × 2)/(1.15 × 1.5 × 0.9 × 5) ≈ 5, which is in the middle of the desired 2 < k* < 10 range.
Let's try the same gradient conditions for larger molecules. This was what workers tried when such separations were first attempted, and you'll quickly realize the problem. We'll use a peptide with a molecular weight of 4000 Da and a 40 kDa protein, which give S values of 16 and 50, respectively. Using equation 1 and the same conditions as above, these translate into k* ≈ 1.6 and 0.5, respectively. For the peptide, this might give a marginal separation, but for the protein, the sample is eluted much too early. This would be analogous to "blasting" a sample off a column under isocratic conditions with a very strong mobile phase, where the sample travels through the column so quickly that it doesn't have adequate time to interact well with the column.
To compensate for the large S value, we need to adjust one or more of the other factors in equation 1 so that we can get a reasonable value of k*. For example, with the protein, we could increase the gradient time to 60 min, which would increase k* to ~1.5. Now you can see why large molecule separation methods tend to use long gradients.
Usually it is not necessary to use a full-range gradient with large molecules, so shortening the gradient range may be possible. For example, you might run a scouting gradient of 5–95% B in 60 min and observe the retention times of the components. From this, you can figure out approximately what %B is present when the first and last peaks are eluted, and then shorten the gradient range. Usually a range of 5–80% B is adequate, and a smaller range may be possible with some samples. For the present example, reducing the gradient range from 5–95% B to 5–80% B will increase k* a bit more to ~1.9. Extending the gradient time to 70 min will bring k* above 2.
Other Potential Problems
Sample diffusion in the mobile phase, within the stationary phase, and into and out of the packing pores plays a major role in peak broadening in LC. If the flow rate is too high, sample molecules can be swept through the column so fast that slow diffusion causes broader peaks, lower column plate numbers, and, thus, lower resolution. Under ideal conditions that highlight diffusion effects, significant degradation of the chromatogram can be observed for increases in flow rate with small molecules and packing particle diameters (dp) of ≥5 µm. However, with real samples under typical operating conditions we don't see any practical degradation of the chromatogram with a twofold flow rate change with particles with diameters ≤ 5 µm, and certainly not for diameters ≤ 3 µm. On the other hand, large molecules diffuse much more slowly, and therefore are also more sensitive to flow-rate changes. With small molecules, one way to speed up the separation while maintaining k* constant is to both reduce the gradient time and increase the flow rate to keep the numerator of equation 1 constant. For example, a 20-min gradient at 1 mL/min will give the same k* as a 10 min gradient at 2 mL/min, all other factors constant. For small molecules, this approach is usually successful. But for large molecules, care needs to be taken to be sure that the flow-rate change doesn't cause an increase in peak broadening that more than cancels the benefit of a shorter run. If you decide to use increased flow rate with large molecules, as might be done under ultrahigh-pressure liquid chromatography (UHPLC) conditions, be sure to look for this potential problem.
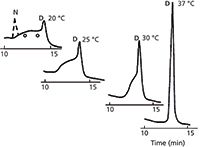
A final caution for the separation of proteins by reversed-phase LC has to do with molecular conformation. The native structure of proteins is complex and is important for biological activity. As was mentioned earlier, acetonitrile-based mobile phases denature proteins. A further complication is that different molecular conformations often have different chromatographic properties, which means that the same protein may have different retention times depending on its conformation. A difference in retention time for the same compound from run-to-run certainly is not a desirable property of a reliable method! An example of this is shown in Figure 2 for a sample of ribonuclease under reversed-phase conditions at different temperatures. The peak at ~13 min is the denatured form (D) of ribonuclease. The native form (N) does not make it through the column, but I've sketched it in with a dashed line in the 20 °C run. At 20 °C, the sample enters the column in the native conformation, but as it travels through the column, it becomes denatured. Molecules that are denatured at the column inlet travel through as a single denatured compound and show up as the 13-min peak. Other molecules travel different distances before they are denatured, and show up as the rounded baseline between the two peaks. By increasing the temperature of the column, the denaturing process takes place earlier, so that at 37 °C, all molecules are denatured at the inlet and travel through as a single denatured peak. The staff in our laboratory referred to chromatograms like the one at 20 °C as "bat-o-grams," because they looked a bit like Batman (eyes added for emphasis). Bat-o-grams are seen occasionally with proteins if they are not fully denatured before injection. It is best to make sure that the sample has been subjected to denaturing conditions before injection if you want to avoid the bat-o-gram problem.

Figure 2: Effect of temperature on peak shape for reversed-phase separation of ribonuclease. Dashed peak added to show approximate position of native (nondenatured) ribonuclease. See text for details. Adapted from reference 2.
Summary
We have seen that large molecules, such as proteins, obey the same rules that small molecules do in reversed-phase separations, but there are aspects of the separation that we need to pay careful attention to. Of particular importance is the requirement that the column packing pore diameter is sufficiently large that the sample molecules have free access to the pores and that the gradient conditions are adjusted so that k* is not too small. Large molecules diffuse slowly, so it is wise to keep the flow rate low enough that they have time to diffuse in and out of the pores. Because Reversed-phase mobile phases are denaturing, it is best to ensure that the sample is fully denatured before injection or protein denaturing on the column may cause peak shape and retention problems. For more information about the separation of peptides and proteins, references 3 and 4 are a good place to start.
John W. Dolan is vice president of LC Resources, Walnut Creek, California, USA. He is also a member of LCGC Asia Pacific's editorial advisory board. Direct correspondence about this column should go to "LC Troubleshooting" LCGC Asia Pacific, 4A Bridgegate Pavilion, Chester Business Park, Wrexham Road, Chester, CH4 9QH, UK, or email the editor-in-chief, Alasdair Matheson, at amatheson@advanstar.com
References
(1) D. Guo, C.T. Mant, and R.S. Hodges, J. Chromatogr. 386, 57 (2005).
(2) S. Cohen, K. Benedek, Y. Tapuhi, J.C. Ford, and B.L. Karger, Anal. Biochem. 144, 275 (1985).
(3) L.R. Snyder, J.J. Kirkland, and J.W. Dolan, Introduction to Modern Liquid Chromatography, 3rd ed. (Wiley, Hoboken, New Jersey, USA, 2010), Chapter 13.
(4) R.L. Cunico, K.M. Gooding, and T. Wehr, Basic HPLC and CE of Biomolecules (Bay Bioanalytical Laboratory, Richmond, California, USA, 1998).

Understanding FDA Recommendations for N-Nitrosamine Impurity Levels
April 17th 2025We spoke with Josh Hoerner, general manager of Purisys, which specializes in a small volume custom synthesis and specialized controlled substance manufacturing, to gain his perspective on FDA’s recommendations for acceptable intake limits for N-nitrosamine impurities.


